
Balance commerciale de la Thaïlande par année ($ US) : excédent (+) ou déficit (−), 1960–2025
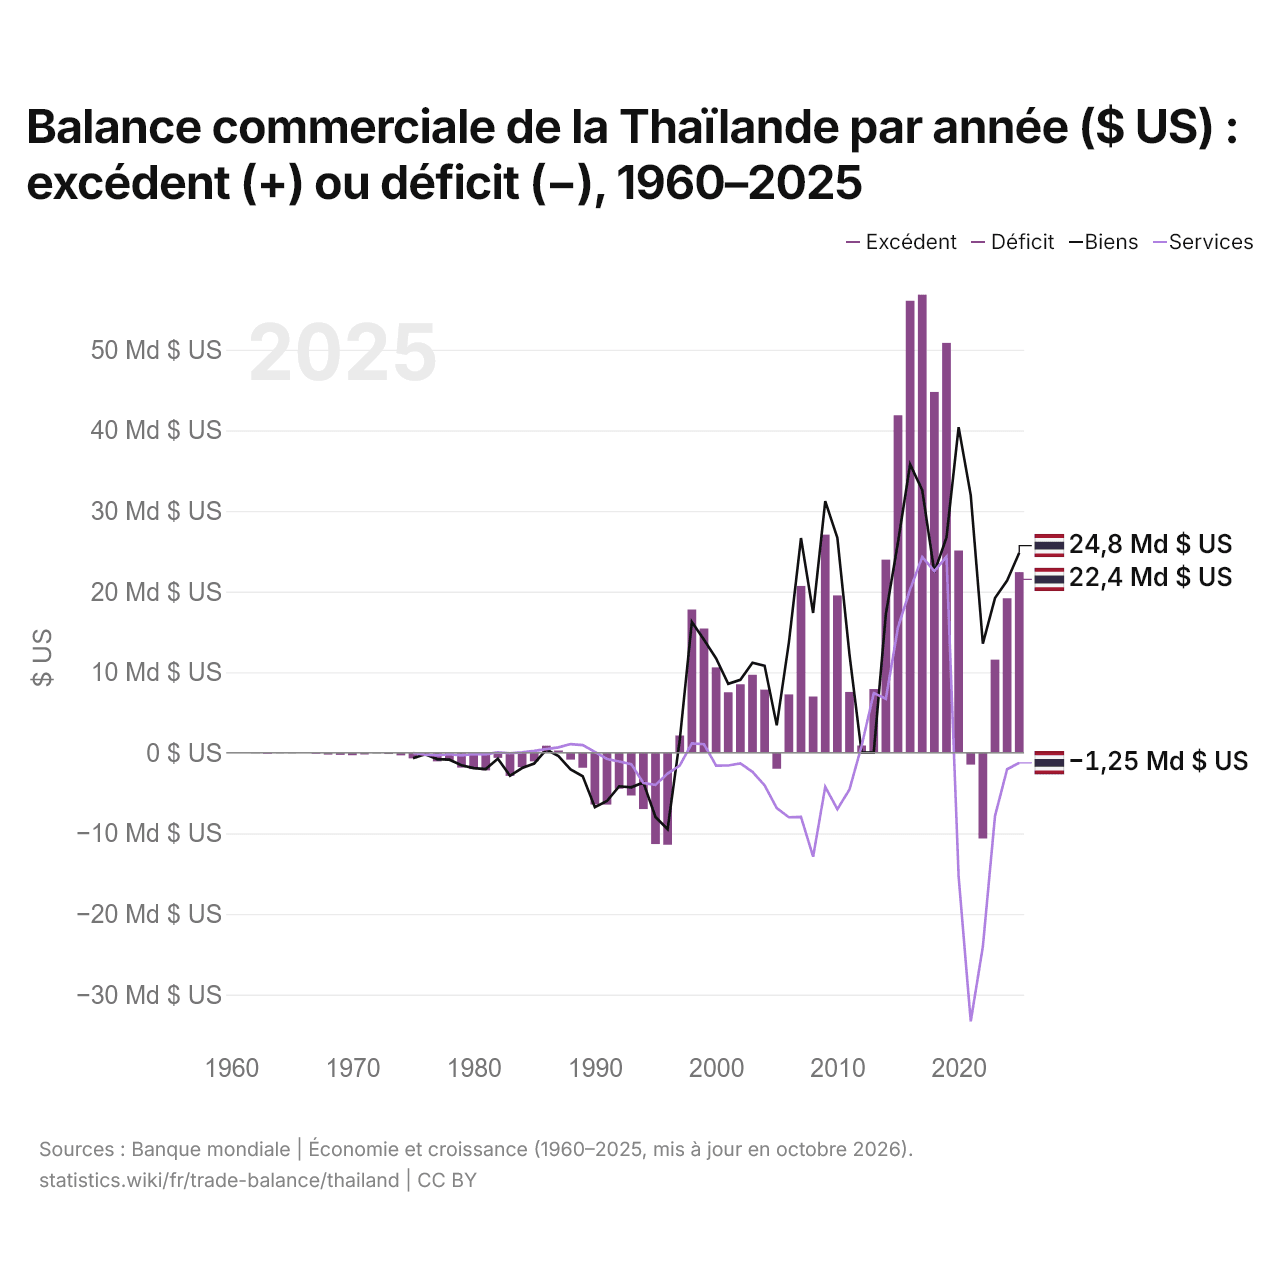
| Année | $ US | ||
|---|---|---|---|
| Biens et services | Biens | Services | |
| 2025 | 22 402 465 677 $ US | 24 811 711 405 $ US | −1 248 465 021 $ US |
| 2024 | 19 165 463 094 $ US | 21 359 130 265 $ US | −2 046 759 514 $ US |
| 2023 | 11 554 301 943 $ US | 19 189 737 784 $ US | −7 855 816 160 $ US |
| 2022 | −10 636 527 116 $ US | 13 543 168 237 $ US | −24 043 635 759 $ US |
| 2021 | −1 463 735 306 $ US | 31 944 662 044 $ US | −33 323 138 856 $ US |
| 2020 | 25 089 768 146 $ US | 40 401 600 209 $ US | −15 344 510 208 $ US |
| 2019 | 50 852 391 002 $ US | 26 724 512 285 $ US | 24 322 927 511 $ US |
| 2018 | 44 768 334 335 $ US | 22 387 658 666 $ US | 22 534 518 938 $ US |
| 2017 | 56 835 761 401 $ US | 32 581 233 624 $ US | 24 295 802 552 $ US |
| 2016 | 56 079 513 870 $ US | 35 776 081 544 $ US | 20 274 953 994 $ US |
| 2015 | 41 870 119 401 $ US | 26 116 490 037 $ US | 15 563 835 871 $ US |
| 2014 | 23 962 838 725 $ US | 17 215 877 880 $ US | 6 692 899 168 $ US |
| 2013 | 7 902 306 215 $ US | 39 589 417 $ US | 7 401 305 828 $ US |
| 2012 | 904 575 388 $ US | 30 070 437 $ US | 849 981 065 $ US |
| 2011 | 7 543 979 216 $ US | 12 185 610 000 $ US | −4 552 804 916 $ US |
| 2010 | 19 517 413 294 $ US | 26 677 710 000 $ US | −6 993 465 838 $ US |
| 2009 | 27 066 211 193 $ US | 31 202 270 000 $ US | −4 225 423 348 $ US |
| 2008 | 6 981 025 387 $ US | 17 348 110 000 $ US | −12 896 600 000 $ US |
| 2007 | 20 697 063 962 $ US | 26 640 300 000 $ US | −7 957 350 000 $ US |
| 2006 | 7 237 609 499 $ US | 13 669 570 000 $ US | −8 001 810 000 $ US |
| 2005 | −1 984 876 727 $ US | 3 401 860 000 $ US | −6 872 790 000 $ US |
| 2004 | 7 835 357 474 $ US | 10 785 241 110 $ US | −4 036 947 942 $ US |
| 2003 | 9 673 296 490 $ US | 11 174 586 667 $ US | −2 370 472 425 $ US |
| 2002 | 8 490 183 783 $ US | 9 043 920 573 $ US | −1 329 775 186 $ US |
| 2001 | 7 498 576 473 $ US | 8 543 463 761 $ US | −1 586 143 563 $ US |
| 2000 | 10 594 886 498 $ US | 11 700 606 670 $ US | −1 592 014 707 $ US |
| 1999 | 15 416 652 651 $ US | 14 013 304 685 $ US | 1 052 347 939 $ US |
| 1998 | 17 772 192 804 $ US | 16 237 902 371 $ US | 1 157 312 271 $ US |
| 1997 | 2 136 056 834 $ US | 1 571 580 383 $ US | −1 591 255 229 $ US |
| 1996 | −11 416 470 782 $ US | −9 488 173 663 $ US | −2 577 684 364 $ US |
| 1995 | −11 327 272 984 $ US | −7 968 062 317 $ US | −3 986 559 372 $ US |
| 1994 | −6 989 078 945 $ US | −3 699 827 992 $ US | −3 755 869 276 $ US |
| 1993 | −5 299 331 021 $ US | −4 288 132 943 $ US | −1 410 156 774 $ US |
| 1992 | −4 468 914 487 $ US | −4 161 016 223 $ US | −1 080 264 320 $ US |
| 1991 | −6 427 021 889 $ US | −5 989 183 374 $ US | −767 773 718 $ US |
| 1990 | −6 416 534 515 $ US | −6 750 841 823 $ US | 109 832 891 $ US |
| 1989 | −1 852 420 621 $ US | −2 916 112 698 $ US | 952 447 346 $ US |
| 1988 | −856 887 188 $ US | −2 074 422 954 $ US | 1 078 154 275 $ US |
| 1987 | 283 017 445 $ US | −424 455 379 $ US | 663 877 903 $ US |
| 1986 | 876 044 811 $ US | 388 378 529 $ US | 450 635 110 $ US |
| 1985 | −1 061 199 599 $ US | −1 332 141 584 $ US | 226 709 768 $ US |
| 1984 | −1 783 296 331 $ US | −1 897 744 076 $ US | 54 432 650 $ US |
| 1983 | −2 867 898 579 $ US | −2 861 116 000 $ US | −63 043 160 $ US |
| 1982 | −626 605 535 $ US | −730 561 531 $ US | 58 912 746 $ US |
| 1981 | −2 186 206 760 $ US | −2 028 951 762 $ US | −207 287 326 $ US |
| 1980 | −2 024 090 911 $ US | −1 902 468 625 $ US | −154 687 677 $ US |
| 1979 | −1 840 938 235 $ US | −1 550 343 492 $ US | −317 375 831 $ US |
| 1978 | −1 014 894 545 $ US | −858 371 454 $ US | −186 261 507 $ US |
| 1977 | −1 071 906 353 $ US | −783 966 633 $ US | −314 851 353 $ US |
| 1976 | −419 507 686 $ US | −193 136 280 $ US | −239 802 712 $ US |
| 1975 | −686 383 795 $ US | −672 693 396 $ US | −25 270 778 $ US |
| 1974 | −324 268 299 $ US | - | - |
| 1973 | −156 454 352 $ US | - | - |
| 1972 | −81 346 040 $ US | - | - |
| 1971 | −208 269 231 $ US | - | - |
| 1970 | −309 086 538 $ US | - | - |
| 1969 | −267 740 385 $ US | - | - |
| 1968 | −227 596 154 $ US | - | - |
| 1967 | −115 576 923 $ US | - | - |
| 1966 | −17 500 000 $ US | - | - |
| 1965 | −52 932 692 $ US | - | - |
| 1964 | −55 240 385 $ US | - | - |
| 1963 | −114 738 358 $ US | - | - |
| 1962 | −64 942 529 $ US | - | - |
| 1961 | 6 838 113 $ US | - | - |
| 1960 | −35 077 326 $ US | - | - |
En 2025, la balance commerciale de la Thaïlande affichait un excédent de 22,4 milliards de dollars, contre un déficit de 35,1 millions de dollars en 1960. Le plus grand déficit a été de 11,4 milliards de dollars, en 1996, et le plus grand excédent de 56,8 milliards de dollars, en 2017. La balance commerciale de la Thaïlande est excédentaire chaque année depuis 2023.
En 2025, le solde commercial de la Thaïlande était le 10e plus élevé de 44 pays situés en Asie, où les soldes allaient d'un déficit de 68,9 milliards de dollars en Inde à un excédent de 816 milliards de dollars en Chine. De 2016 à 2025, les soldes commerciaux de la Thaïlande ont totalisé un excédent de 275 milliards de dollars, contre un excédent de 164 milliards de dollars de 2006 à 2015. En 2025, les transactions courantes de la Thaïlande affichaient un excédent de 3,0 % du PIB.
Commerce de biens de la Thaïlande avec ses 10 principaux partenaires commerciaux, selon la Thaïlande, 2025
| Pays | Exportations vers | Importations depuis | Solde | |
|---|---|---|---|---|
 Chine |
39,4 Md $US | 109 Md $US | −69,2 Md $US | vs Chine |
 États-Unis |
72,2 Md $US | 21,7 Md $US | +50,6 Md $US | |
 Japon |
23,5 Md $US | 30,0 Md $US | −6,44 Md $US | vs Japon |
 Malaisie |
13,4 Md $US | 15,2 Md $US | −1,80 Md $US | vs Malaisie |
 Vietnam |
12,7 Md $US | 11,0 Md $US | +1,73 Md $US | vs Vietnam |
 EAU |
4,45 Md $US | 17,7 Md $US | −13,3 Md $US | |
 Inde |
15,8 Md $US | 6,07 Md $US | +9,77 Md $US | |
 Indonésie |
9,28 Md $US | 10,4 Md $US | −1,14 Md $US | vs Indonésie |
 Singapour |
11,8 Md $US | 7,70 Md $US | +4,10 Md $US | |
 Australie |
12,0 Md $US | 5,40 Md $US | +6,55 Md $US |
Balance commerciale de la Thaïlande : excédent (+) ou déficit (−)
| Biens et services, $ US, 2025 | +22,4 Md $US |
|---|---|
| % du PIB, 2025 | +3,9 % |
| Années d'excédent, 2000–2025 | 23 |
| Biens, $ US, 2025 | +24,8 Md $US |
| Services, $ US, 2025 | −1,25 Md $US |
| Premier excédent en biens, 2025 | États-Unis +50,6 Md $US |
| Premier déficit en biens, 2025 | Chine −69,2 Md $US |
Comparer la balance commerciale de la Thaïlande avec celle d'autres pays
Sources :
- TradeMap (2025, mis à jour en octobre 2026)
- Banque mondiale | Économie et croissance (1960–2025, mis à jour en octobre 2026)
Creative Commons Attribution (CC BY) : vous pouvez copier, partager, adapter et réutiliser ce contenu, y compris à des fins commerciales, à condition de citer statistics.wiki et d’indiquer les modifications apportées. Les sources citées ci-dessus peuvent avoir leurs propres conditions de licence.