
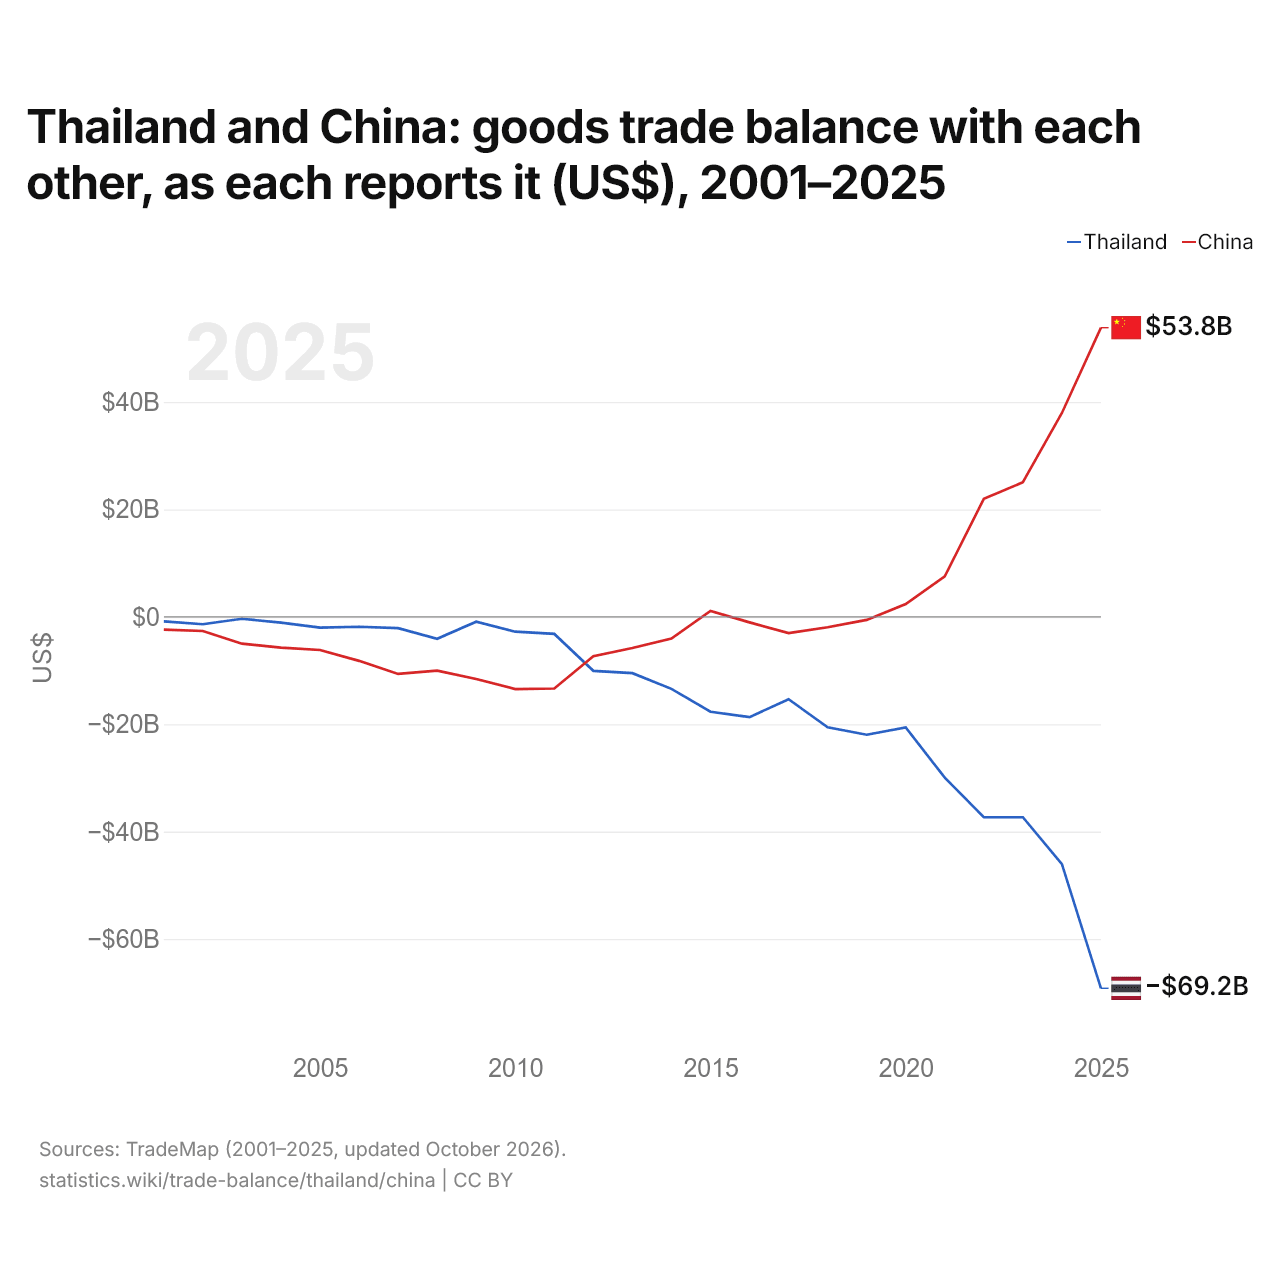
La Thaïlande et la Chine : solde de leur commerce de biens bilatéral, selon chacun ($ US), 2001–2025
| Année | $ US | |
|---|---|---|
| Thaïlande | Chine | |
| 2025 | −69 175 880 000 $ US | 53 839 191 000 $ US |
| 2024 | −46 048 517 000 $ US | 37 958 440 000 $ US |
| 2023 | −37 319 202 000 $ US | 25 050 082 000 $ US |
| 2022 | −37 315 798 000 $ US | 21 961 996 000 $ US |
| 2021 | −29 956 746 000 $ US | 7 537 185 000 $ US |
| 2020 | −20 611 528 000 $ US | 2 373 672 000 $ US |
| 2019 | −21 951 324 000 $ US | −576 812 000 $ US |
| 2018 | −20 562 415 000 $ US | −1 944 414 000 $ US |
| 2017 | −15 336 351 000 $ US | −3 025 092 000 $ US |
| 2016 | −18 678 243 000 $ US | −1 033 038 000 $ US |
| 2015 | −17 673 025 000 $ US | 1 089 488 000 $ US |
| 2014 | −13 413 976 000 $ US | −4 042 700 000 $ US |
| 2013 | −10 488 409 000 $ US | −5 804 777 000 $ US |
| 2012 | −10 056 910 000 $ US | −7 354 438 000 $ US |
| 2011 | −3 178 751 000 $ US | −13 345 192 000 $ US |
| 2010 | −2 766 172 000 $ US | −13 452 143 000 $ US |
| 2009 | −905 090 000 $ US | −11 589 844 000 $ US |
| 2008 | −4 091 319 000 $ US | −10 020 383 000 $ US |
| 2007 | −2 107 316 000 $ US | −10 632 838 000 $ US |
| 2006 | −1 842 996 000 $ US | −8 198 363 000 $ US |
| 2005 | −2 023 667 000 $ US | −6 172 591 000 $ US |
| 2004 | −1 089 855 000 $ US | −5 738 930 000 $ US |
| 2003 | −363 730 000 $ US | −4 998 937 000 $ US |
| 2002 | −1 377 740 000 $ US | −2 642 252 000 $ US |
| 2001 | −853 107 000 $ US | −2 376 739 000 $ US |
En 2025, selon la Thaïlande, son commerce de biens avec la Chine affichait un déficit de 69,2 milliards de dollars ; selon la Chine, son commerce de biens avec la Thaïlande affichait un excédent de 53,8 milliards de dollars. En 2001, les chiffres étaient un déficit de 853 millions de dollars pour la Thaïlande et un déficit de 2,38 milliards de dollars pour la Chine.
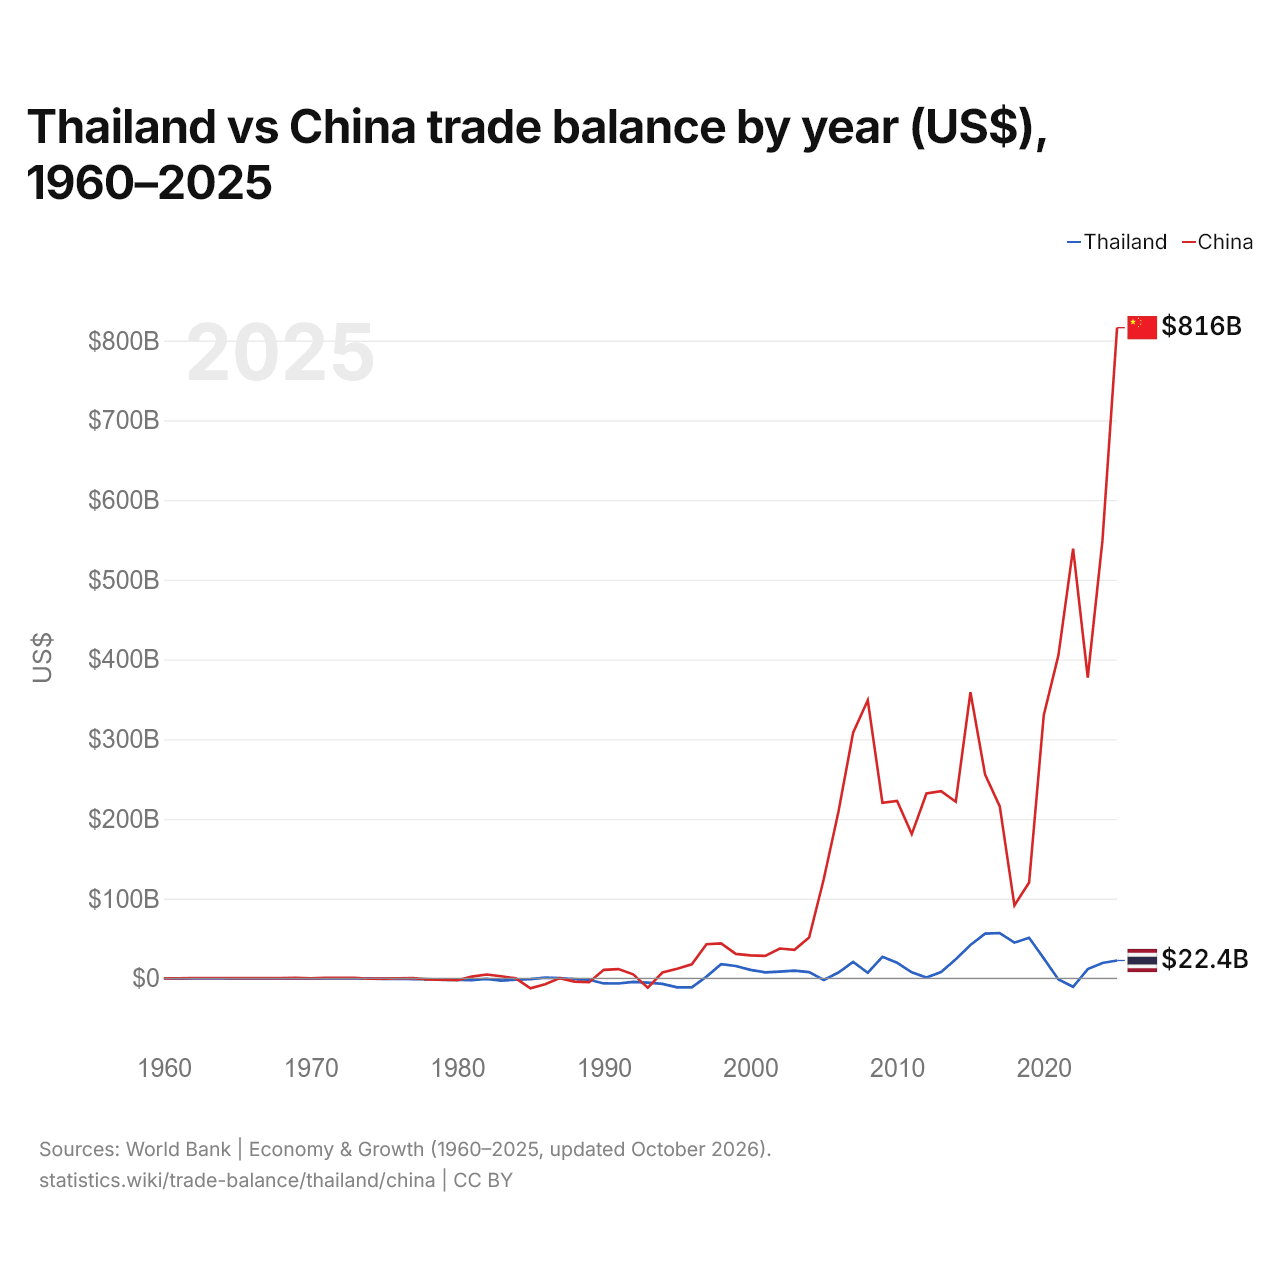
Thaïlande vs Chine : balance commerciale par année ($ US), 1960–2025
| Année | $ US | |
|---|---|---|
 Thaïlande |
 Chine |
|
| 2025 | 22 402 465 677 $ US | 816 189 653 994 $ US |
| 2024 | 19 165 463 094 $ US | 548 703 728 924 $ US |
| 2023 | 11 554 301 943 $ US | 377 368 486 355 $ US |
| 2022 | −10 636 527 116 $ US | 539 054 406 264 $ US |
| 2021 | −1 463 735 306 $ US | 405 394 120 058 $ US |
| 2020 | 25 089 768 146 $ US | 330 134 703 664 $ US |
| 2019 | 50 852 391 002 $ US | 120 151 888 640 $ US |
| 2018 | 44 768 334 335 $ US | 91 487 265 093 $ US |
| 2017 | 56 835 761 401 $ US | 215 697 133 466 $ US |
| 2016 | 56 079 513 870 $ US | 255 484 319 295 $ US |
| 2015 | 41 870 119 401 $ US | 358 836 357 206 $ US |
| 2014 | 23 962 838 725 $ US | 221 549 605 872 $ US |
| 2013 | 7 902 306 215 $ US | 234 872 118 182 $ US |
| 2012 | 904 575 388 $ US | 231 864 021 797 $ US |
| 2011 | 7 543 979 216 $ US | 180 895 321 770 $ US |
| 2010 | 19 517 413 294 $ US | 222 400 893 687 $ US |
| 2009 | 27 066 211 193 $ US | 220 130 401 367 $ US |
| 2008 | 6 981 025 387 $ US | 348 832 533 154 $ US |
| 2007 | 20 697 063 962 $ US | 308 036 028 783 $ US |
| 2006 | 7 237 609 499 $ US | 208 918 924 501 $ US |
| 2005 | −1 984 876 727 $ US | 124 626 797 517 $ US |
| 2004 | 7 835 357 474 $ US | 51 174 382 540 $ US |
| 2003 | 9 673 296 490 $ US | 35 821 129 066 $ US |
| 2002 | 8 490 183 783 $ US | 37 382 671 264 $ US |
| 2001 | 7 498 576 473 $ US | 28 086 220 298 $ US |
| 2000 | 10 594 886 498 $ US | 28 785 851 579 $ US |
| 1999 | 15 416 652 651 $ US | 30 640 955 367 $ US |
| 1998 | 17 772 192 804 $ US | 43 836 689 480 $ US |
| 1997 | 2 136 056 834 $ US | 42 823 220 000 $ US |
| 1996 | −11 416 470 782 $ US | 17 550 000 000 $ US |
| 1995 | −11 327 272 984 $ US | 11 958 000 000 $ US |
| 1994 | −6 989 078 945 $ US | 7 357 000 000 $ US |
| 1993 | −5 299 331 021 $ US | −11 792 000 000 $ US |
| 1992 | −4 468 914 487 $ US | 4 998 000 000 $ US |
| 1991 | −6 427 021 889 $ US | 11 601 000 000 $ US |
| 1990 | −6 416 534 515 $ US | 10 668 000 000 $ US |
| 1989 | −1 852 420 621 $ US | −4 928 000 000 $ US |
| 1988 | −856 887 188 $ US | −4 061 000 000 $ US |
| 1987 | 283 017 445 $ US | 291 000 000 $ US |
| 1986 | 876 044 811 $ US | −7 390 000 000 $ US |
| 1985 | −1 061 199 599 $ US | −12 501 000 000 $ US |
| 1984 | −1 783 296 331 $ US | 54 000 000 $ US |
| 1983 | −2 867 898 579 $ US | 2 571 000 000 $ US |
| 1982 | −626 605 535 $ US | 4 812 000 000 $ US |
| 1981 | −2 186 206 760 $ US | 2 150 220 000 $ US |
| 1980 | −2 024 090 911 $ US | −2 436 990 000 $ US |
| 1979 | −1 840 938 235 $ US | −1 572 643 000 $ US |
| 1978 | −1 014 894 545 $ US | −1 460 560 000 $ US |
| 1977 | −1 071 906 353 $ US | 210 672 000 $ US |
| 1976 | −419 507 686 $ US | 90 791 000 $ US |
| 1975 | −686 383 795 $ US | −380 480 000 $ US |
| 1974 | −324 268 299 $ US | −503 131 000 $ US |
| 1973 | −156 454 352 $ US | 701 488 000 $ US |
| 1972 | −81 346 040 $ US | 620 760 000 $ US |
| 1971 | −208 269 231 $ US | 477 289 000 $ US |
| 1970 | −309 086 538 $ US | 72 660 000 $ US |
| 1969 | −267 740 385 $ US | 483 200 000 $ US |
| 1968 | −227 596 154 $ US | 269 480 000 $ US |
| 1967 | −115 576 923 $ US | 236 020 000 $ US |
| 1966 | −17 500 000 $ US | 185 300 000 $ US |
| 1965 | −52 932 692 $ US | 330 180 000 $ US |
| 1964 | −55 240 385 $ US | 457 760 000 $ US |
| 1963 | −114 738 358 $ US | 455 680 000 $ US |
| 1962 | −64 942 529 $ US | 377 650 000 $ US |
| 1961 | 6 838 113 $ US | 97 520 000 $ US |
| 1960 | −35 077 326 $ US | −7 530 000 $ US |
En 2025, la balance commerciale de la Thaïlande affichait un excédent de 22,4 milliards de dollars et celle de la Chine un excédent de 816 milliards de dollars ; l'excédent de la Chine était 36 fois plus grand. En 1960, la balance commerciale de la Thaïlande affichait un déficit de 35,1 millions de dollars et celle de la Chine un déficit de 7,53 millions de dollars.
De 1960 à 2025, la balance commerciale de la Thaïlande a été excédentaire pendant 29 des 66 années, et celle de la Chine pendant 55. Les balances commerciales de la Thaïlande et de la Chine ont été déficitaires en même temps pendant 10 de ces années, la dernière fois en 1993.
Thaïlande vs Chine : chiffres de la balance commerciale
|
Thaïlande
|
Chine
|
|
|---|---|---|
| Biens et services, $ US | +22,4 Md $US (2025) | +816 Md $US (2025) |
| % du PIB | +3,9 % (2025) | +4,2 % (2025) |
| Années d'excédent depuis 2000 | 23 sur 26 | 26 sur 26 |
| Solde des biens entre les deux, chiffres propres | −69,2 Md $US (2025) | +53,8 Md $US (2025) |
| Premier excédent en biens avec | États-Unis (+50,6 Md $US, 2025) | États-Unis (+280 Md $US, 2025) |
| Premier déficit en biens avec | Chine (−69,2 Md $US, 2025) | Australie (−51,6 Md $US, 2025) |
Comparer la balance commerciale de 2 pays au choix
Sources :
- Banque mondiale | Économie et croissance (1960–2025, mis à jour en octobre 2026)
- TradeMap (2001–2025, mis à jour en octobre 2026)
Creative Commons Attribution (CC BY) : vous pouvez copier, partager, adapter et réutiliser ce contenu, y compris à des fins commerciales, à condition de citer statistics.wiki et d’indiquer les modifications apportées. Les sources citées ci-dessus peuvent avoir leurs propres conditions de licence.