
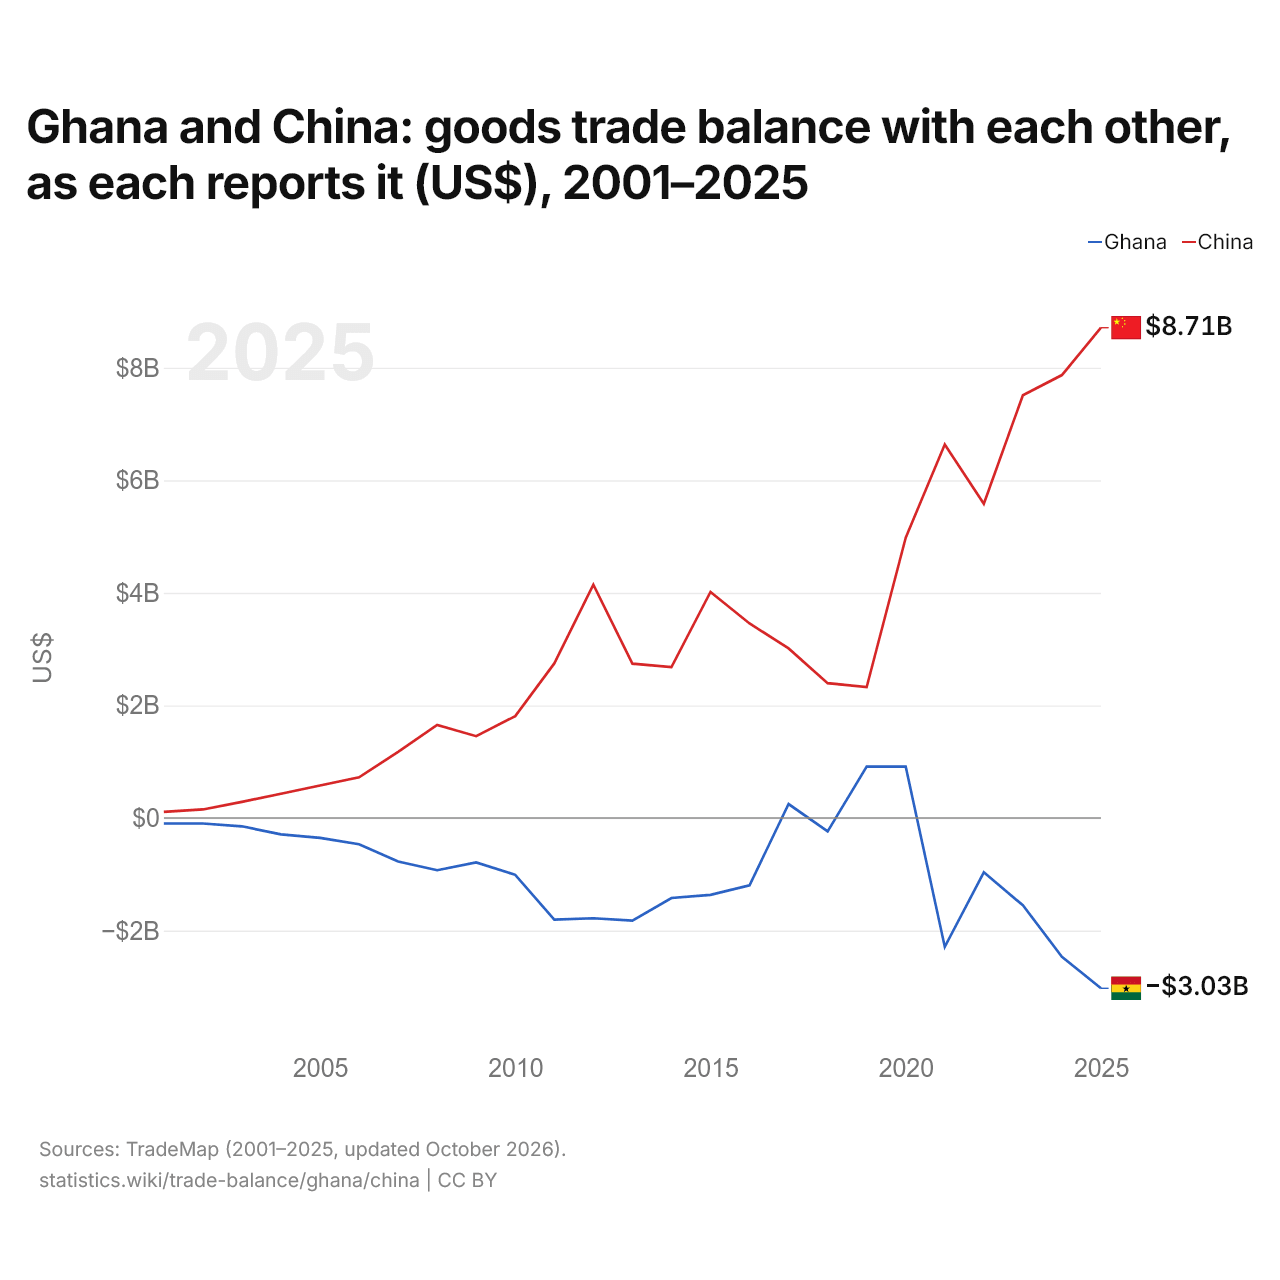
Le Ghana et la Chine : solde de leur commerce de biens bilatéral, selon chacun ($ US), 2001–2025
| Année | $ US | |
|---|---|---|
| Ghana | Chine | |
| 2025 | −3 025 568 000 $ US | 8 711 201 000 $ US |
| 2024 | −2 465 058 000 $ US | 7 869 542 000 $ US |
| 2023 | −1 550 700 000 $ US | 7 511 015 000 $ US |
| 2022 | −963 947 000 $ US | 5 582 003 000 $ US |
| 2021 | −2 288 237 000 $ US | 6 637 401 000 $ US |
| 2020 | 912 686 000 $ US | 4 981 692 000 $ US |
| 2019 | 912 686 000 $ US | 2 326 850 000 $ US |
| 2018 | −238 245 000 $ US | 2 395 746 000 $ US |
| 2017 | 248 514 000 $ US | 3 012 949 000 $ US |
| 2016 | −1 195 284 000 $ US | 3 456 843 000 $ US |
| 2015 | −1 365 841 000 $ US | 4 017 007 000 $ US |
| 2014 | −1 421 884 000 $ US | 2 681 969 000 $ US |
| 2013 | −1 822 876 000 $ US | 2 742 698 000 $ US |
| 2012 | −1 780 632 000 $ US | 4 147 205 000 $ US |
| 2011 | −1 804 256 000 $ US | 2 746 763 000 $ US |
| 2010 | −1 009 051 000 $ US | 1 809 490 000 $ US |
| 2009 | −789 820 000 $ US | 1 454 079 000 $ US |
| 2008 | −928 015 000 $ US | 1 654 486 000 $ US |
| 2007 | −773 365 000 $ US | 1 174 494 000 $ US |
| 2006 | −465 235 000 $ US | 723 414 000 $ US |
| 2005 | −354 075 000 $ US | 576 418 000 $ US |
| 2004 | −289 784 000 $ US | 430 017 000 $ US |
| 2003 | −147 353 000 $ US | 287 477 000 $ US |
| 2002 | −97 309 000 $ US | 152 160 000 $ US |
| 2001 | −97 309 000 $ US | 109 284 000 $ US |
En 2025, selon le Ghana, son commerce de biens avec la Chine affichait un déficit de 3,03 milliards de dollars ; selon la Chine, son commerce de biens avec le Ghana affichait un excédent de 8,71 milliards de dollars. En 2001, les chiffres étaient un déficit de 97,3 millions de dollars pour le Ghana et un excédent de 109 millions de dollars pour la Chine.
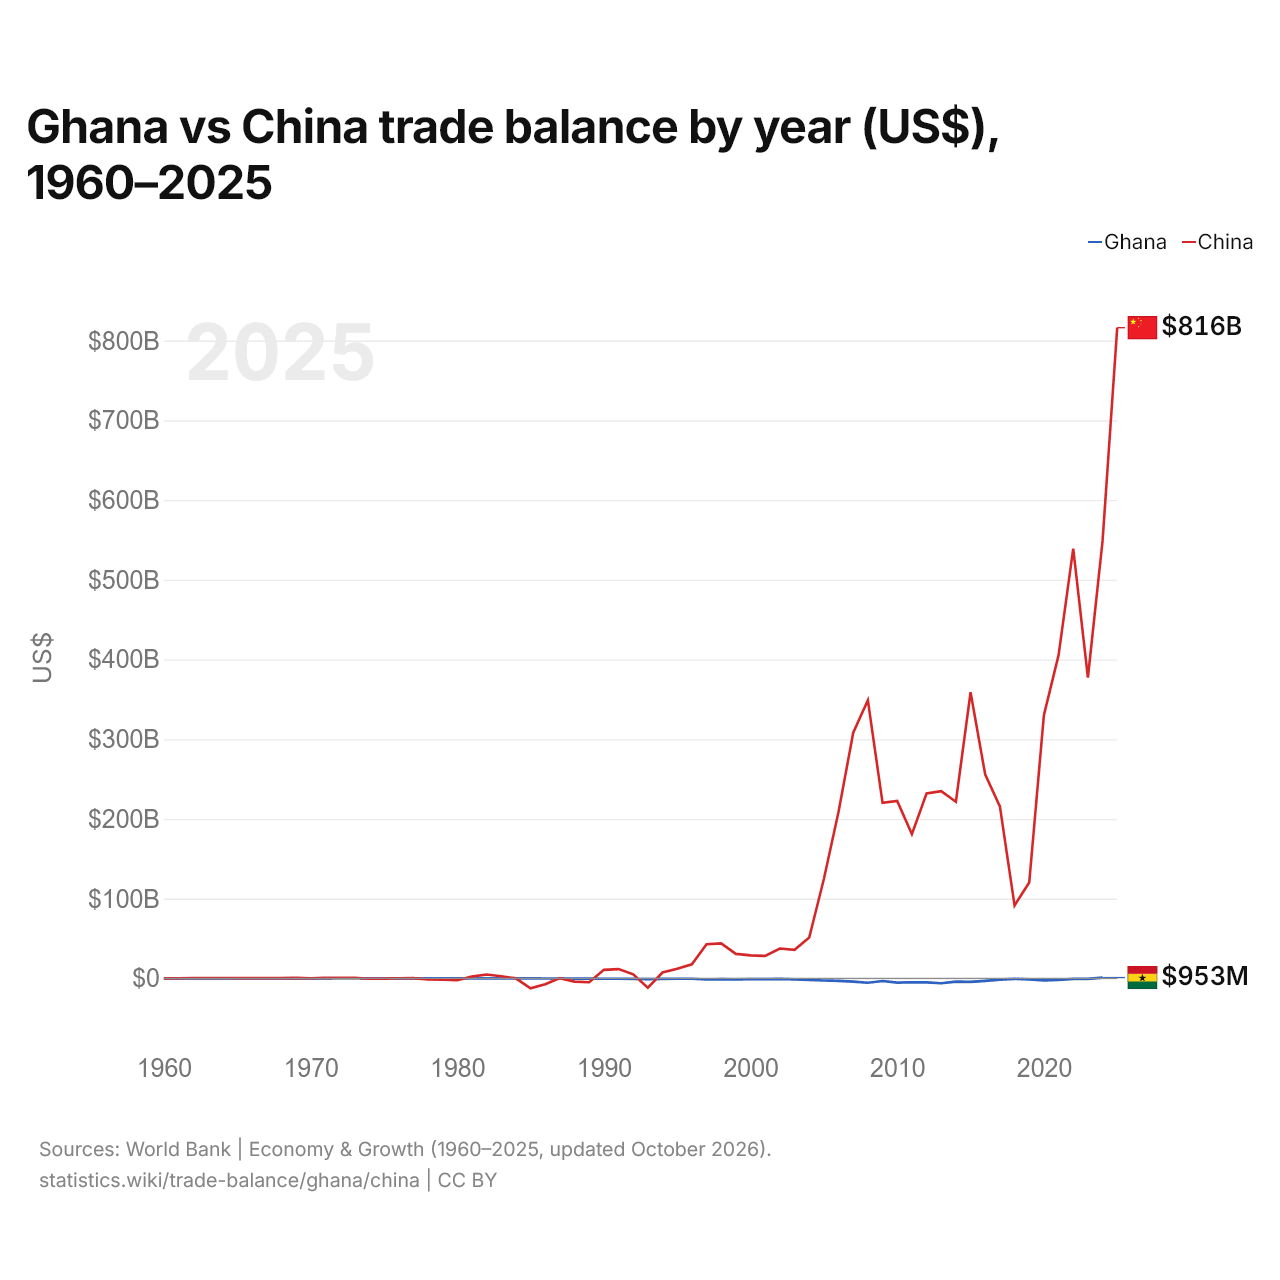
Ghana vs Chine : balance commerciale par année ($ US), 1960–2025
| Année | $ US | |
|---|---|---|
 Ghana |
 Chine |
|
| 2025 | - | 816 189 653 994 $ US |
| 2024 | 953 399 973 $ US | 548 703 728 924 $ US |
| 2023 | −681 612 946 $ US | 377 368 486 355 $ US |
| 2022 | −582 015 087 $ US | 539 054 406 264 $ US |
| 2021 | −2 065 454 600 $ US | 405 394 120 058 $ US |
| 2020 | −2 467 550 988 $ US | 330 134 703 664 $ US |
| 2019 | −1 316 200 284 $ US | 120 151 888 640 $ US |
| 2018 | −705 366 714 $ US | 91 487 265 093 $ US |
| 2017 | −1 687 540 151 $ US | 215 697 133 466 $ US |
| 2016 | −3 082 608 043 $ US | 255 484 319 295 $ US |
| 2015 | −4 379 043 716 $ US | 358 836 357 206 $ US |
| 2014 | −4 031 316 042 $ US | 221 549 605 872 $ US |
| 2013 | −6 207 746 512 $ US | 234 872 118 182 $ US |
| 2012 | −5 138 161 192 $ US | 231 864 021 797 $ US |
| 2011 | −4 886 494 040 $ US | 180 895 321 770 $ US |
| 2010 | −5 288 265 245 $ US | 222 400 893 687 $ US |
| 2009 | −3 389 200 672 $ US | 220 130 401 367 $ US |
| 2008 | −5 579 663 206 $ US | 348 832 533 154 $ US |
| 2007 | −4 047 884 399 $ US | 308 036 028 783 $ US |
| 2006 | −3 175 919 428 $ US | 208 918 924 501 $ US |
| 2005 | −2 715 483 386 $ US | 124 626 797 517 $ US |
| 2004 | −1 870 753 812 $ US | 51 174 382 540 $ US |
| 2003 | −1 215 821 146 $ US | 35 821 129 066 $ US |
| 2002 | −755 774 800 $ US | 37 382 671 264 $ US |
| 2001 | −1 040 642 603 $ US | 28 086 220 298 $ US |
| 2000 | −919 032 737 $ US | 28 785 851 579 $ US |
| 1999 | −1 354 406 829 $ US | 30 640 955 367 $ US |
| 1998 | −961 957 641 $ US | 43 836 689 480 $ US |
| 1997 | −1 418 345 573 $ US | 42 823 220 000 $ US |
| 1996 | −553 292 937 $ US | 17 550 000 000 $ US |
| 1995 | −544 960 555 $ US | 11 958 000 000 $ US |
| 1994 | −626 545 496 $ US | 7 357 000 000 $ US |
| 1993 | −964 654 468 $ US | −11 792 000 000 $ US |
| 1992 | −740 526 497 $ US | 4 998 000 000 $ US |
| 1991 | −565 315 671 $ US | 11 601 000 000 $ US |
| 1990 | −528 394 040 $ US | 10 668 000 000 $ US |
| 1989 | −399 173 615 $ US | −4 928 000 000 $ US |
| 1988 | −305 562 698 $ US | −4 061 000 000 $ US |
| 1987 | −331 027 211 $ US | 291 000 000 $ US |
| 1986 | −204 161 059 $ US | −7 390 000 000 $ US |
| 1985 | −132 195 378 $ US | −12 501 000 000 $ US |
| 1984 | −120 303 327 $ US | 54 000 000 $ US |
| 1983 | −17 570 547 $ US | 2 571 000 000 $ US |
| 1982 | 14 379 085 $ US | 4 812 000 000 $ US |
| 1981 | −23 953 488 $ US | 2 150 220 000 $ US |
| 1980 | −30 601 660 $ US | −2 436 990 000 $ US |
| 1979 | 2 849 003 $ US | −1 572 643 000 $ US |
| 1978 | −48 691 099 $ US | −1 460 560 000 $ US |
| 1977 | −33 428 571 $ US | 210 672 000 $ US |
| 1976 | −9 322 034 $ US | 90 791 000 $ US |
| 1975 | 26 063 830 $ US | −380 480 000 $ US |
| 1974 | −100 621 118 $ US | −503 131 000 $ US |
| 1973 | 152 013 058 $ US | 701 488 000 $ US |
| 1972 | 116 307 445 $ US | 620 760 000 $ US |
| 1971 | −108 286 464 $ US | 477 289 000 $ US |
| 1970 | −30 396 585 $ US | 72 660 000 $ US |
| 1969 | −11 766 420 $ US | 483 200 000 $ US |
| 1968 | −7 844 280 $ US | 269 480 000 $ US |
| 1967 | −44 144 369 $ US | 236 020 000 $ US |
| 1966 | −106 455 106 $ US | 185 300 000 $ US |
| 1965 | −197 502 236 $ US | 330 180 000 $ US |
| 1964 | −68 635 529 $ US | 457 760 000 $ US |
| 1963 | −96 650 031 $ US | 455 680 000 $ US |
| 1962 | −58 830 453 $ US | 377 650 000 $ US |
| 1961 | −134 469 608 $ US | 97 520 000 $ US |
| 1960 | −88 245 680 $ US | −7 530 000 $ US |
La balance commerciale du Ghana affichait un excédent de 953 millions de dollars (2024) et celle de la Chine un excédent de 549 milliards de dollars (2024) ; l'excédent de la Chine était 580 fois plus grand. En 1960, la balance commerciale du Ghana affichait un déficit de 88,2 millions de dollars et celle de la Chine un déficit de 7,53 millions de dollars.
Depuis 1960, la balance commerciale du Ghana a été excédentaire pendant 6 des 65 années, et celle de la Chine pendant 54. Les balances commerciales du Ghana et de la Chine ont été déficitaires en même temps pendant 9 de ces années, la dernière fois en 1993.
Ghana vs Chine : chiffres de la balance commerciale
|
Ghana
|
Chine
|
|
|---|---|---|
| Biens et services, $ US | +953 M $US (2024) | +816 Md $US (2025) |
| % du PIB | +1,1 % (2024) | +4,2 % (2025) |
| Années d'excédent depuis 2000 | 1 sur 25 | 26 sur 26 |
| Solde des biens entre les deux, chiffres propres | −3,03 Md $US (2025) | +8,71 Md $US (2025) |
| Premier excédent en biens avec | Émirats arabes unis (+7,07 Md $US, 2025) | États-Unis (+280 Md $US, 2025) |
| Premier déficit en biens avec | Chine (−3,03 Md $US, 2025) | Australie (−51,6 Md $US, 2025) |
Comparer la balance commerciale de 2 pays au choix
Sources :
- Banque mondiale | Économie et croissance (1960–2025, mis à jour en octobre 2026)
- TradeMap (2001–2025, mis à jour en octobre 2026)
Creative Commons Attribution (CC BY) : vous pouvez copier, partager, adapter et réutiliser ce contenu, y compris à des fins commerciales, à condition de citer statistics.wiki et d’indiquer les modifications apportées. Les sources citées ci-dessus peuvent avoir leurs propres conditions de licence.