
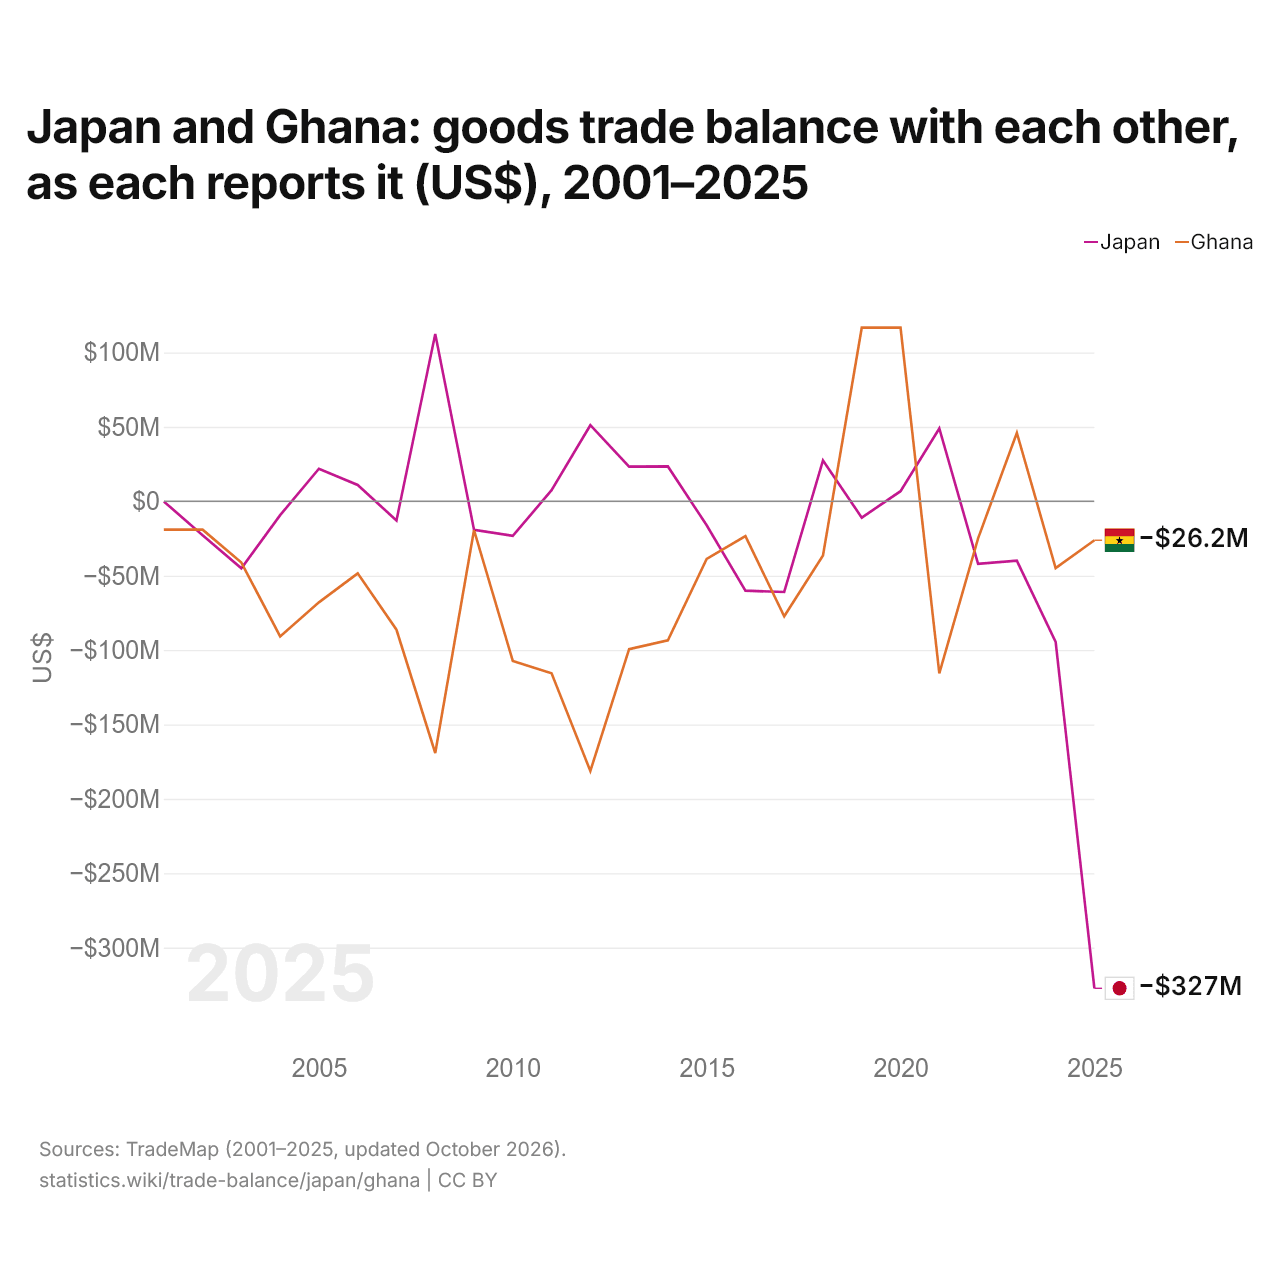
Le Japon et le Ghana : solde de leur commerce de biens bilatéral, selon chacun ($ US), 2001–2025
| Année | $ US | |
|---|---|---|
| Japon | Ghana | |
| 2025 | −327 378 000 $ US | −26 222 000 $ US |
| 2024 | −94 574 000 $ US | −44 923 000 $ US |
| 2023 | −39 979 000 $ US | 45 956 000 $ US |
| 2022 | −42 111 000 $ US | −24 915 000 $ US |
| 2021 | 48 951 000 $ US | −115 653 000 $ US |
| 2020 | 6 777 000 $ US | 116 654 000 $ US |
| 2019 | −11 038 000 $ US | 116 654 000 $ US |
| 2018 | 27 457 000 $ US | −36 379 000 $ US |
| 2017 | −60 992 000 $ US | −77 357 000 $ US |
| 2016 | −60 107 000 $ US | −23 419 000 $ US |
| 2015 | −16 148 000 $ US | −38 734 000 $ US |
| 2014 | 23 401 000 $ US | −93 518 000 $ US |
| 2013 | 23 258 000 $ US | −99 392 000 $ US |
| 2012 | 51 134 000 $ US | −181 304 000 $ US |
| 2011 | 7 395 000 $ US | −115 645 000 $ US |
| 2010 | −23 242 000 $ US | −107 385 000 $ US |
| 2009 | −19 152 000 $ US | −19 353 000 $ US |
| 2008 | 112 356 000 $ US | −169 232 000 $ US |
| 2007 | −12 925 000 $ US | −86 350 000 $ US |
| 2006 | 10 904 000 $ US | −48 444 000 $ US |
| 2005 | 21 856 000 $ US | −67 944 000 $ US |
| 2004 | −9 340 000 $ US | −90 883 000 $ US |
| 2003 | −45 105 000 $ US | −41 191 000 $ US |
| 2002 | −22 809 000 $ US | −19 129 000 $ US |
| 2001 | −150 000 $ US | −19 129 000 $ US |
En 2025, selon le Japon, son commerce de biens avec le Ghana affichait un déficit de 327 millions de dollars ; selon le Ghana, son commerce de biens avec le Japon affichait un déficit de 26,2 millions de dollars. En 2001, les chiffres étaient un déficit de 150 000 dollars pour le Japon et un déficit de 19,1 millions de dollars pour le Ghana.
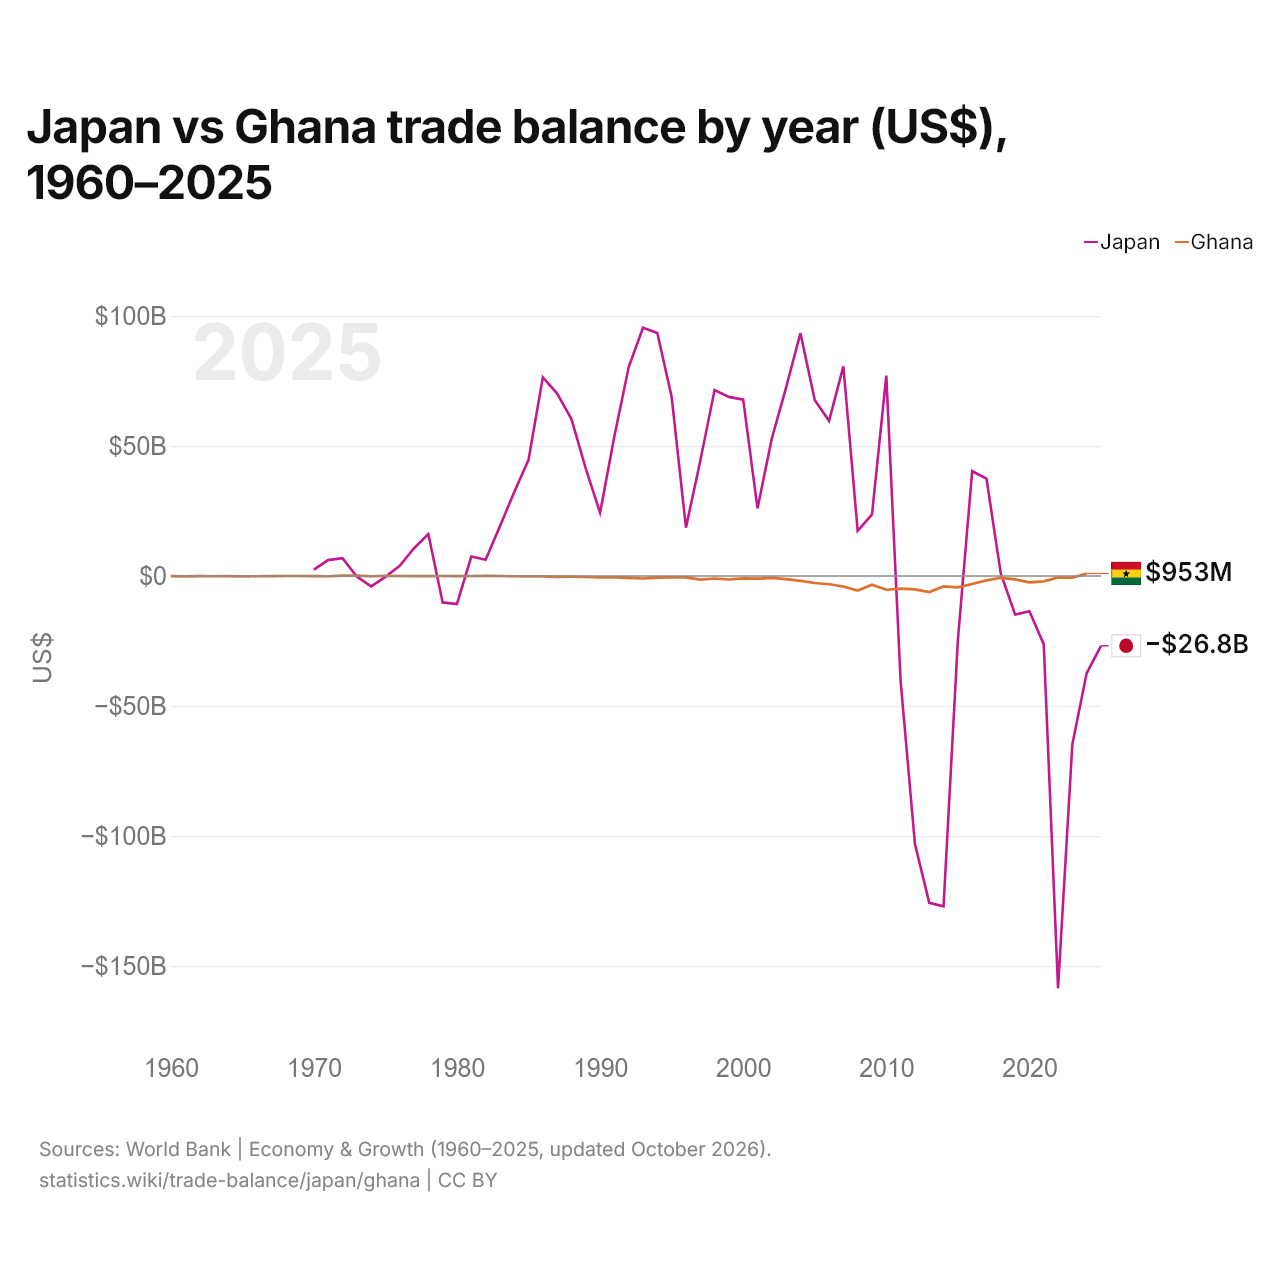
Japon vs Ghana : balance commerciale par année ($ US), 1960–2025
| Année | $ US | |
|---|---|---|
 Japon |
 Ghana |
|
| 2025 | −26 840 701 298 $ US | - |
| 2024 | −37 421 806 079 $ US | 953 399 973 $ US |
| 2023 | −64 740 755 791 $ US | −681 612 946 $ US |
| 2022 | −158 565 740 395 $ US | −582 015 087 $ US |
| 2021 | −26 203 979 027 $ US | −2 065 454 600 $ US |
| 2020 | −13 587 503 404 $ US | −2 467 550 988 $ US |
| 2019 | −14 829 877 577 $ US | −1 316 200 284 $ US |
| 2018 | 964 471 415 $ US | −705 366 714 $ US |
| 2017 | 37 424 841 039 $ US | −1 687 540 151 $ US |
| 2016 | 40 295 828 111 $ US | −3 082 608 043 $ US |
| 2015 | −24 640 621 321 $ US | −4 379 043 716 $ US |
| 2014 | −127 067 136 943 $ US | −4 031 316 042 $ US |
| 2013 | −125 688 992 897 $ US | −6 207 746 512 $ US |
| 2012 | −103 017 334 054 $ US | −5 138 161 192 $ US |
| 2011 | −40 334 797 700 $ US | −4 886 494 040 $ US |
| 2010 | 77 030 184 880 $ US | −5 288 265 245 $ US |
| 2009 | 23 690 260 030 $ US | −3 389 200 672 $ US |
| 2008 | 17 356 895 109 $ US | −5 579 663 206 $ US |
| 2007 | 80 582 742 763 $ US | −4 047 884 399 $ US |
| 2006 | 59 659 000 527 $ US | −3 175 919 428 $ US |
| 2005 | 67 663 961 124 $ US | −2 715 483 386 $ US |
| 2004 | 93 354 468 404 $ US | −1 870 753 812 $ US |
| 2003 | 72 560 562 736 $ US | −1 215 821 146 $ US |
| 2002 | 52 861 517 849 $ US | −755 774 800 $ US |
| 2001 | 25 985 588 613 $ US | −1 040 642 603 $ US |
| 2000 | 67 799 063 708 $ US | −919 032 737 $ US |
| 1999 | 68 865 072 147 $ US | −1 354 406 829 $ US |
| 1998 | 71 492 903 649 $ US | −961 957 641 $ US |
| 1997 | 44 200 018 348 $ US | −1 418 345 573 $ US |
| 1996 | 18 591 806 698 $ US | −553 292 937 $ US |
| 1995 | 68 922 257 802 $ US | −544 960 555 $ US |
| 1994 | 93 444 922 990 $ US | −626 545 496 $ US |
| 1993 | 95 479 406 967 $ US | −964 654 468 $ US |
| 1992 | 80 350 537 263 $ US | −740 526 497 $ US |
| 1991 | 53 732 293 939 $ US | −565 315 671 $ US |
| 1990 | 24 355 543 277 $ US | −528 394 040 $ US |
| 1989 | 41 293 261 160 $ US | −399 173 615 $ US |
| 1988 | 60 323 819 348 $ US | −305 562 698 $ US |
| 1987 | 70 124 276 208 $ US | −331 027 211 $ US |
| 1986 | 76 375 001 632 $ US | −204 161 059 $ US |
| 1985 | 44 629 778 842 $ US | −132 195 378 $ US |
| 1984 | 32 246 208 254 $ US | −120 303 327 $ US |
| 1983 | 19 079 902 169 $ US | −17 570 547 $ US |
| 1982 | 6 219 770 858 $ US | 14 379 085 $ US |
| 1981 | 7 475 883 734 $ US | −23 953 488 $ US |
| 1980 | −10 762 068 406 $ US | −30 601 660 $ US |
| 1979 | −10 178 503 568 $ US | 2 849 003 $ US |
| 1978 | 16 145 734 415 $ US | −48 691 099 $ US |
| 1977 | 10 673 368 053 $ US | −33 428 571 $ US |
| 1976 | 3 911 996 800 $ US | −9 322 034 $ US |
| 1975 | −316 462 115 $ US | 26 063 830 $ US |
| 1974 | −3 967 665 540 $ US | −100 621 118 $ US |
| 1973 | −231 313 286 $ US | 152 013 058 $ US |
| 1972 | 6 834 642 809 $ US | 116 307 445 $ US |
| 1971 | 6 099 709 614 $ US | −108 286 464 $ US |
| 1970 | 2 454 150 061 $ US | −30 396 585 $ US |
| 1969 | - | −11 766 420 $ US |
| 1968 | - | −7 844 280 $ US |
| 1967 | - | −44 144 369 $ US |
| 1966 | - | −106 455 106 $ US |
| 1965 | - | −197 502 236 $ US |
| 1964 | - | −68 635 529 $ US |
| 1963 | - | −96 650 031 $ US |
| 1962 | - | −58 830 453 $ US |
| 1961 | - | −134 469 608 $ US |
| 1960 | - | −88 245 680 $ US |
La balance commerciale du Japon affichait un déficit de 37,4 milliards de dollars (2024) et celle du Ghana un excédent de 953 millions de dollars (2024). En 1970, la balance commerciale du Japon affichait un excédent de 2,45 milliards de dollars et celle du Ghana un déficit de 30,4 millions de dollars.
Depuis 1970, la balance commerciale du Japon a été excédentaire pendant 39 des 55 années, et celle du Ghana pendant 6. Les balances commerciales du Japon et du Ghana ont été déficitaires en même temps pendant 12 de ces années, la dernière fois en 2023.
Japon vs Ghana : chiffres de la balance commerciale
|
Japon
|
Ghana
|
|
|---|---|---|
| Biens et services, $ US | −26,8 Md $US (2025) | +953 M $US (2024) |
| % du PIB | −0,6 % (2025) | +1,1 % (2024) |
| Années d'excédent depuis 2000 | 14 sur 26 | 1 sur 25 |
| Solde des biens entre les deux, chiffres propres | −327 M $US (2025) | −26,2 M $US (2025) |
| Premier excédent en biens avec | États-Unis (+49,5 Md $US, 2025) | Émirats arabes unis (+7,07 Md $US, 2025) |
| Premier déficit en biens avec | Chine (−53,0 Md $US, 2025) | Chine (−3,03 Md $US, 2025) |
Comparer la balance commerciale de 2 pays au choix
Sources :
- Banque mondiale | Économie et croissance (1960–2025, mis à jour en octobre 2026)
- TradeMap (2001–2025, mis à jour en octobre 2026)
Creative Commons Attribution (CC BY) : vous pouvez copier, partager, adapter et réutiliser ce contenu, y compris à des fins commerciales, à condition de citer statistics.wiki et d’indiquer les modifications apportées. Les sources citées ci-dessus peuvent avoir leurs propres conditions de licence.