
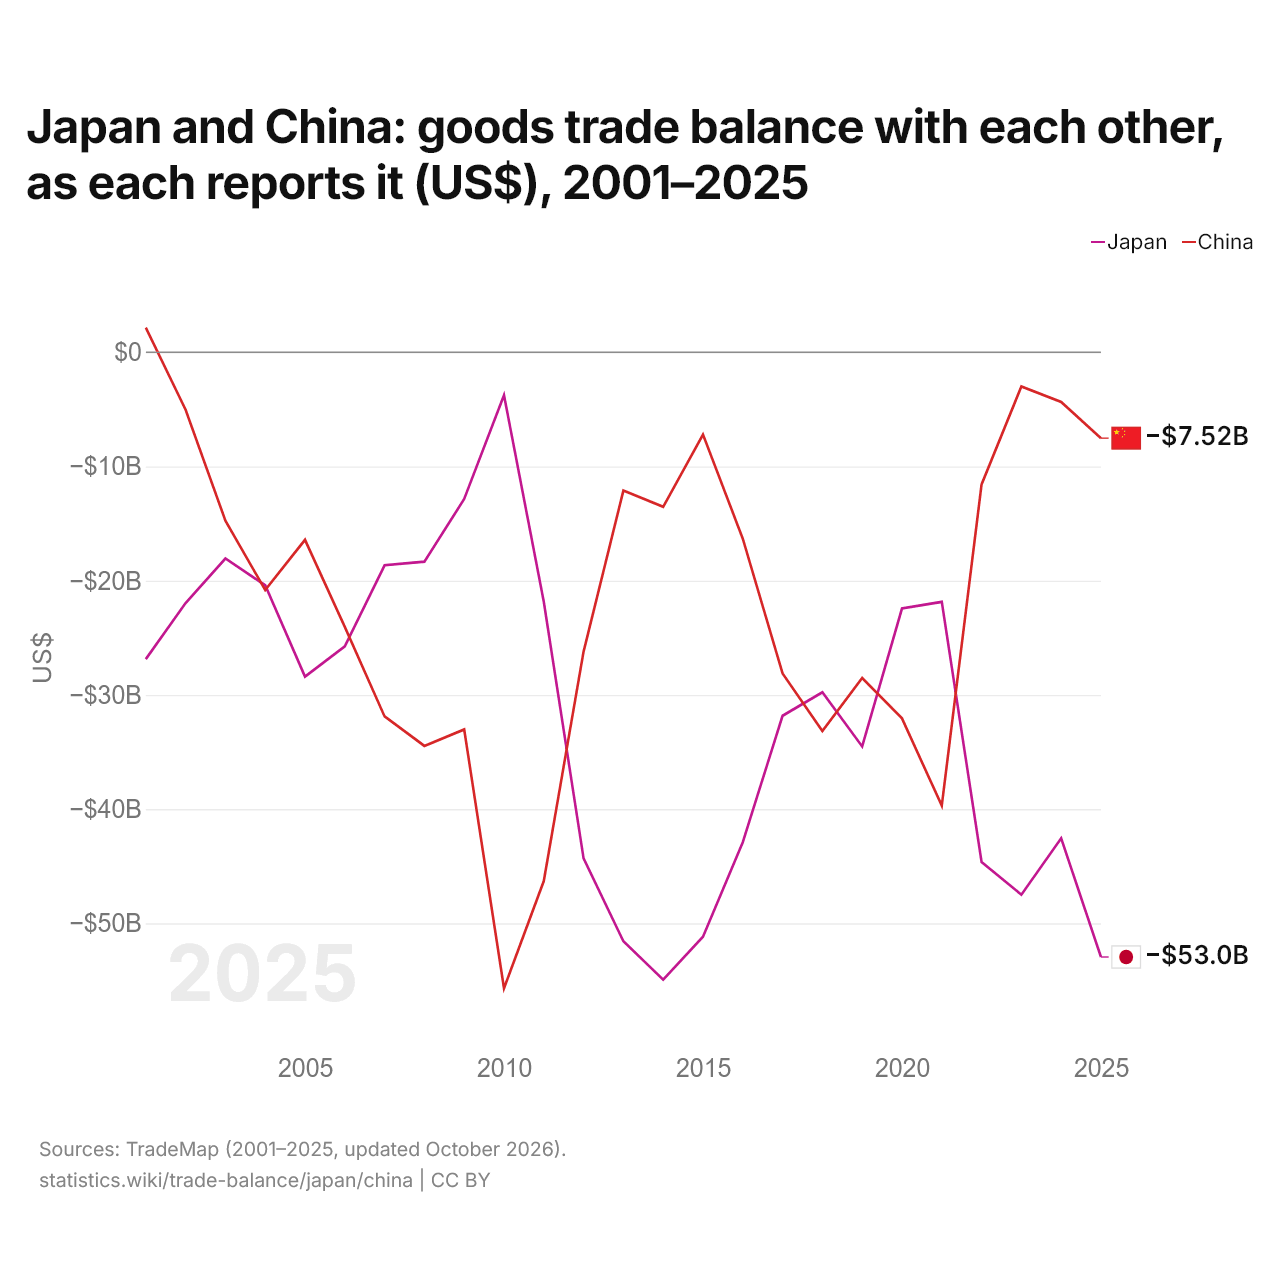
Le Japon et la Chine : solde de leur commerce de biens bilatéral, selon chacun ($ US), 2001–2025
| Année | $ US | |
|---|---|---|
| Japon | Chine | |
| 2025 | −52 950 551 000 $ US | −7 516 994 000 $ US |
| 2024 | −42 552 276 000 $ US | −4 343 897 000 $ US |
| 2023 | −47 494 457 000 $ US | −2 993 383 000 $ US |
| 2022 | −44 639 116 000 $ US | −11 569 559 000 $ US |
| 2021 | −21 855 081 000 $ US | −39 700 750 000 $ US |
| 2020 | −22 438 221 000 $ US | −32 058 554 000 $ US |
| 2019 | −34 516 584 000 $ US | −28 524 178 000 $ US |
| 2018 | −29 768 608 000 $ US | −33 166 687 000 $ US |
| 2017 | −31 827 025 000 $ US | −28 126 025 000 $ US |
| 2016 | −42 902 479 000 $ US | −16 320 775 000 $ US |
| 2015 | −51 177 191 000 $ US | −7 196 031 000 $ US |
| 2014 | −54 932 773 000 $ US | −13 529 172 000 $ US |
| 2013 | −51 576 120 000 $ US | −12 112 984 000 $ US |
| 2012 | −44 315 542 000 $ US | −26 205 755 000 $ US |
| 2011 | −21 846 804 000 $ US | −46 299 148 000 $ US |
| 2010 | −3 752 475 000 $ US | −55 692 119 000 $ US |
| 2009 | −12 846 653 000 $ US | −33 026 559 000 $ US |
| 2008 | −18 329 469 000 $ US | −34 467 586 000 $ US |
| 2007 | −18 651 710 000 $ US | −31 888 008 000 $ US |
| 2006 | −25 756 185 000 $ US | −24 049 908 000 $ US |
| 2005 | −28 403 221 000 $ US | −16 421 404 000 $ US |
| 2004 | −20 401 749 000 $ US | −20 817 685 000 $ US |
| 2003 | −18 055 140 000 $ US | −14 739 427 000 $ US |
| 2002 | −21 959 704 000 $ US | −5 032 159 000 $ US |
| 2001 | −26 870 421 000 $ US | 2 153 216 000 $ US |
En 2025, selon le Japon, son commerce de biens avec la Chine affichait un déficit de 53 milliards de dollars ; selon la Chine, son commerce de biens avec le Japon affichait un déficit de 7,52 milliards de dollars. En 2001, les chiffres étaient un déficit de 26,9 milliards de dollars pour le Japon et un excédent de 2,15 milliards de dollars pour la Chine.
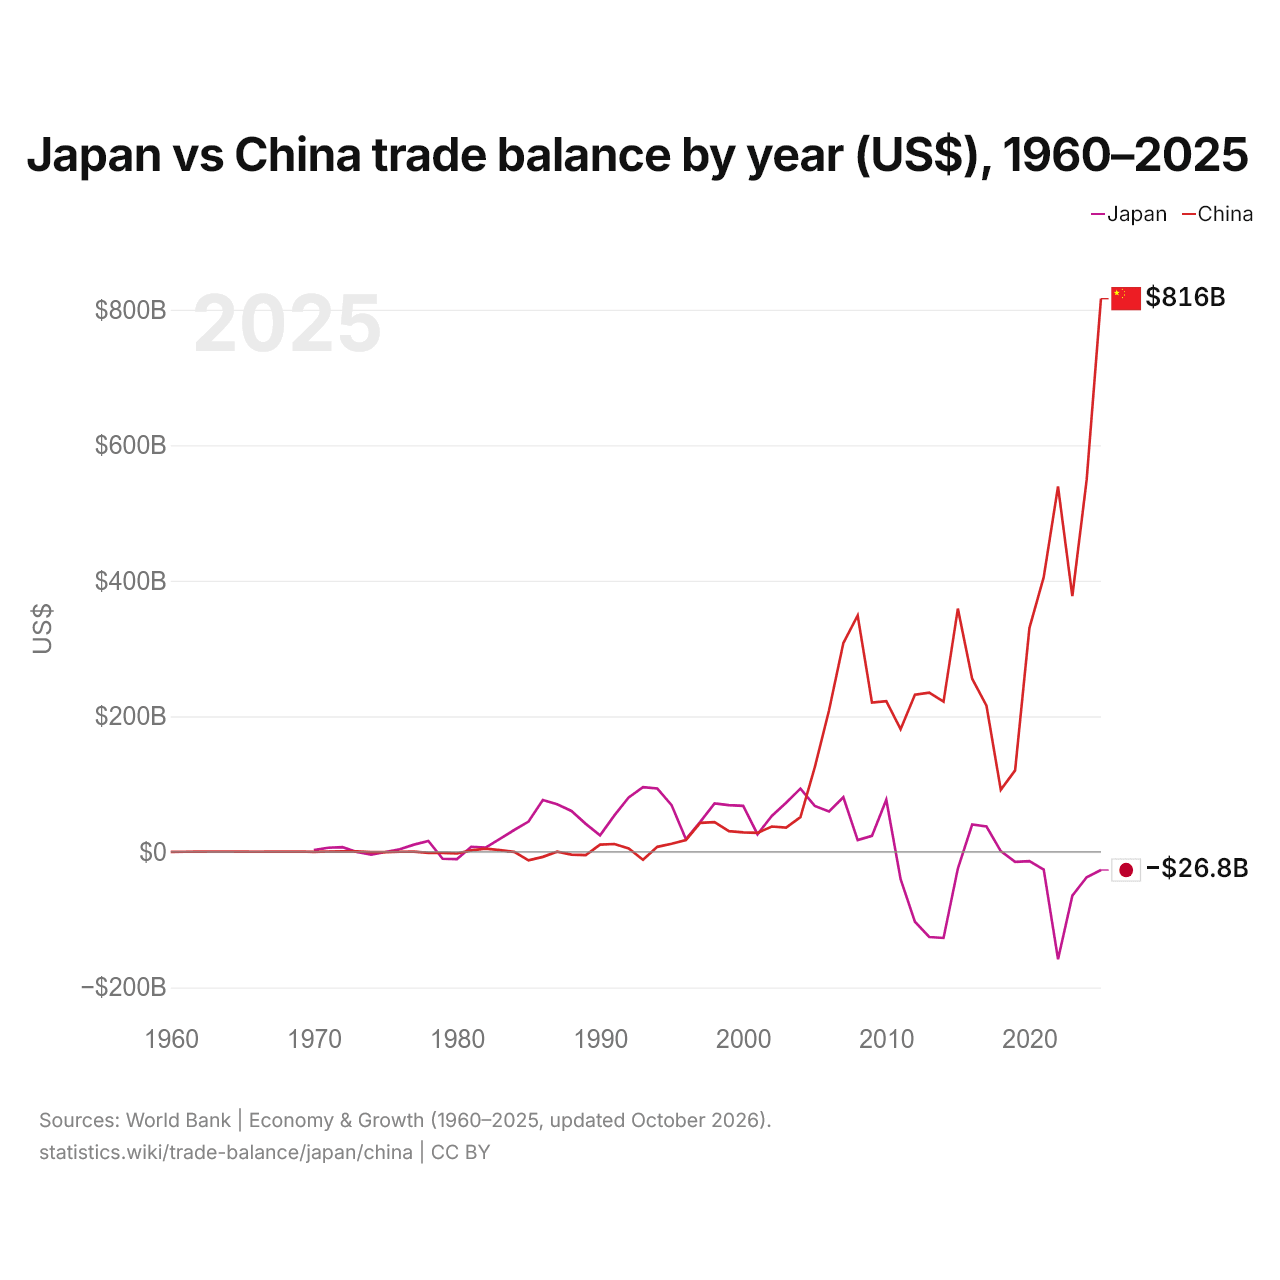
Japon vs Chine : balance commerciale par année ($ US), 1960–2025
| Année | $ US | |
|---|---|---|
 Japon |
 Chine |
|
| 2025 | −26 840 701 298 $ US | 816 189 653 994 $ US |
| 2024 | −37 421 806 079 $ US | 548 703 728 924 $ US |
| 2023 | −64 740 755 791 $ US | 377 368 486 355 $ US |
| 2022 | −158 565 740 395 $ US | 539 054 406 264 $ US |
| 2021 | −26 203 979 027 $ US | 405 394 120 058 $ US |
| 2020 | −13 587 503 404 $ US | 330 134 703 664 $ US |
| 2019 | −14 829 877 577 $ US | 120 151 888 640 $ US |
| 2018 | 964 471 415 $ US | 91 487 265 093 $ US |
| 2017 | 37 424 841 039 $ US | 215 697 133 466 $ US |
| 2016 | 40 295 828 111 $ US | 255 484 319 295 $ US |
| 2015 | −24 640 621 321 $ US | 358 836 357 206 $ US |
| 2014 | −127 067 136 943 $ US | 221 549 605 872 $ US |
| 2013 | −125 688 992 897 $ US | 234 872 118 182 $ US |
| 2012 | −103 017 334 054 $ US | 231 864 021 797 $ US |
| 2011 | −40 334 797 700 $ US | 180 895 321 770 $ US |
| 2010 | 77 030 184 880 $ US | 222 400 893 687 $ US |
| 2009 | 23 690 260 030 $ US | 220 130 401 367 $ US |
| 2008 | 17 356 895 109 $ US | 348 832 533 154 $ US |
| 2007 | 80 582 742 763 $ US | 308 036 028 783 $ US |
| 2006 | 59 659 000 527 $ US | 208 918 924 501 $ US |
| 2005 | 67 663 961 124 $ US | 124 626 797 517 $ US |
| 2004 | 93 354 468 404 $ US | 51 174 382 540 $ US |
| 2003 | 72 560 562 736 $ US | 35 821 129 066 $ US |
| 2002 | 52 861 517 849 $ US | 37 382 671 264 $ US |
| 2001 | 25 985 588 613 $ US | 28 086 220 298 $ US |
| 2000 | 67 799 063 708 $ US | 28 785 851 579 $ US |
| 1999 | 68 865 072 147 $ US | 30 640 955 367 $ US |
| 1998 | 71 492 903 649 $ US | 43 836 689 480 $ US |
| 1997 | 44 200 018 348 $ US | 42 823 220 000 $ US |
| 1996 | 18 591 806 698 $ US | 17 550 000 000 $ US |
| 1995 | 68 922 257 802 $ US | 11 958 000 000 $ US |
| 1994 | 93 444 922 990 $ US | 7 357 000 000 $ US |
| 1993 | 95 479 406 967 $ US | −11 792 000 000 $ US |
| 1992 | 80 350 537 263 $ US | 4 998 000 000 $ US |
| 1991 | 53 732 293 939 $ US | 11 601 000 000 $ US |
| 1990 | 24 355 543 277 $ US | 10 668 000 000 $ US |
| 1989 | 41 293 261 160 $ US | −4 928 000 000 $ US |
| 1988 | 60 323 819 348 $ US | −4 061 000 000 $ US |
| 1987 | 70 124 276 208 $ US | 291 000 000 $ US |
| 1986 | 76 375 001 632 $ US | −7 390 000 000 $ US |
| 1985 | 44 629 778 842 $ US | −12 501 000 000 $ US |
| 1984 | 32 246 208 254 $ US | 54 000 000 $ US |
| 1983 | 19 079 902 169 $ US | 2 571 000 000 $ US |
| 1982 | 6 219 770 858 $ US | 4 812 000 000 $ US |
| 1981 | 7 475 883 734 $ US | 2 150 220 000 $ US |
| 1980 | −10 762 068 406 $ US | −2 436 990 000 $ US |
| 1979 | −10 178 503 568 $ US | −1 572 643 000 $ US |
| 1978 | 16 145 734 415 $ US | −1 460 560 000 $ US |
| 1977 | 10 673 368 053 $ US | 210 672 000 $ US |
| 1976 | 3 911 996 800 $ US | 90 791 000 $ US |
| 1975 | −316 462 115 $ US | −380 480 000 $ US |
| 1974 | −3 967 665 540 $ US | −503 131 000 $ US |
| 1973 | −231 313 286 $ US | 701 488 000 $ US |
| 1972 | 6 834 642 809 $ US | 620 760 000 $ US |
| 1971 | 6 099 709 614 $ US | 477 289 000 $ US |
| 1970 | 2 454 150 061 $ US | 72 660 000 $ US |
| 1969 | - | 483 200 000 $ US |
| 1968 | - | 269 480 000 $ US |
| 1967 | - | 236 020 000 $ US |
| 1966 | - | 185 300 000 $ US |
| 1965 | - | 330 180 000 $ US |
| 1964 | - | 457 760 000 $ US |
| 1963 | - | 455 680 000 $ US |
| 1962 | - | 377 650 000 $ US |
| 1961 | - | 97 520 000 $ US |
| 1960 | - | −7 530 000 $ US |
En 2025, la balance commerciale du Japon affichait un déficit de 26,8 milliards de dollars et celle de la Chine un excédent de 816 milliards de dollars. En 1970, la balance commerciale du Japon affichait un excédent de 2,45 milliards de dollars et celle de la Chine un excédent de 72,7 millions de dollars.
De 1970 à 2025, la balance commerciale du Japon a été excédentaire pendant 39 des 56 années, et celle de la Chine pendant 46. Les balances commerciales du Japon et de la Chine ont été déficitaires en même temps pendant 4 de ces années, la dernière fois en 1980.
Japon vs Chine : chiffres de la balance commerciale
|
Japon
|
Chine
|
|
|---|---|---|
| Biens et services, $ US | −26,8 Md $US (2025) | +816 Md $US (2025) |
| % du PIB | −0,6 % (2025) | +4,2 % (2025) |
| Années d'excédent depuis 2000 | 14 sur 26 | 26 sur 26 |
| Solde des biens entre les deux, chiffres propres | −53,0 Md $US (2025) | −7,52 Md $US (2025) |
| Premier excédent en biens avec | États-Unis (+49,5 Md $US, 2025) | États-Unis (+280 Md $US, 2025) |
| Premier déficit en biens avec | Chine (−53,0 Md $US, 2025) | Australie (−51,6 Md $US, 2025) |
Comparer la balance commerciale de 2 pays au choix
Sources :
- Banque mondiale | Économie et croissance (1960–2025, mis à jour en octobre 2026)
- TradeMap (2001–2025, mis à jour en octobre 2026)
Creative Commons Attribution (CC BY) : vous pouvez copier, partager, adapter et réutiliser ce contenu, y compris à des fins commerciales, à condition de citer statistics.wiki et d’indiquer les modifications apportées. Les sources citées ci-dessus peuvent avoir leurs propres conditions de licence.