
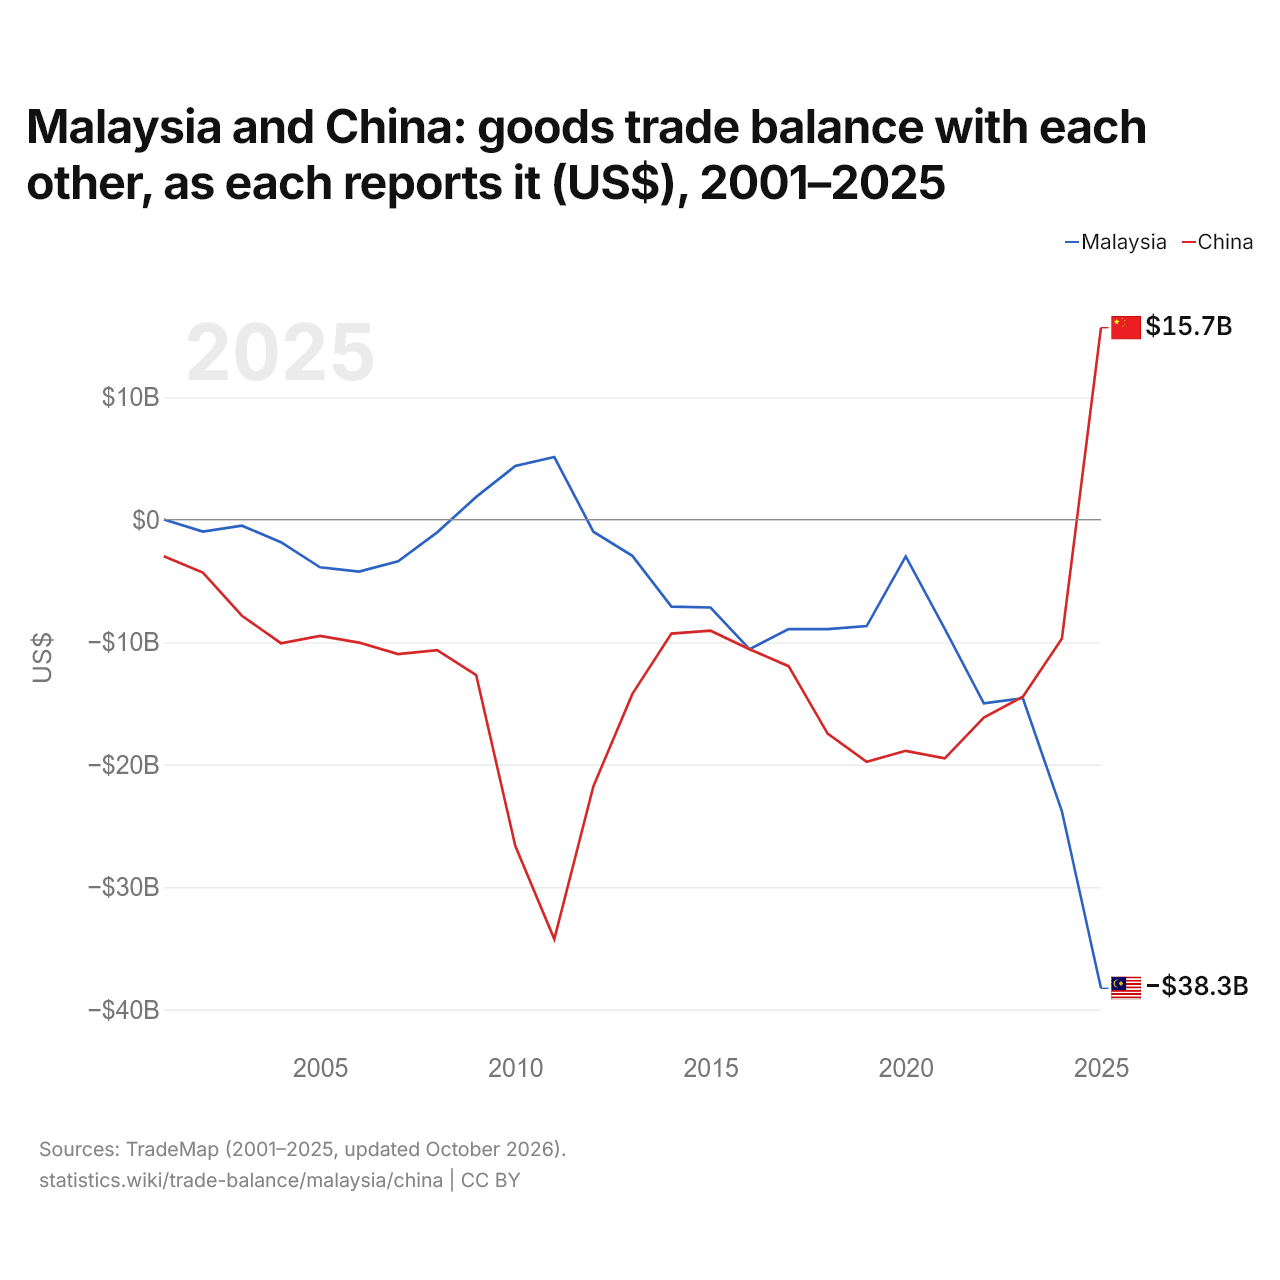
La Malaisie et la Chine : solde de leur commerce de biens bilatéral, selon chacun ($ US), 2001–2025
| Année | $ US | |
|---|---|---|
| Malaisie | Chine | |
| 2025 | −38 263 940 000 $ US | 15 673 775 000 $ US |
| 2024 | −23 812 294 000 $ US | −9 702 045 000 $ US |
| 2023 | −14 576 448 000 $ US | −14 452 691 000 $ US |
| 2022 | −14 993 471 000 $ US | −16 167 728 000 $ US |
| 2021 | −8 924 456 000 $ US | −19 494 815 000 $ US |
| 2020 | −2 995 352 000 $ US | −18 873 538 000 $ US |
| 2019 | −8 688 099 000 $ US | −19 768 195 000 $ US |
| 2018 | −8 938 613 000 $ US | −17 473 542 000 $ US |
| 2017 | −8 924 874 000 $ US | −11 962 002 000 $ US |
| 2016 | −10 577 837 000 $ US | −10 575 981 000 $ US |
| 2015 | −7 167 839 000 $ US | −9 065 321 000 $ US |
| 2014 | −7 099 626 000 $ US | −9 298 855 000 $ US |
| 2013 | −2 953 099 000 $ US | −14 222 591 000 $ US |
| 2012 | −980 142 000 $ US | −21 779 235 000 $ US |
| 2011 | 5 111 109 000 $ US | −34 250 592 000 $ US |
| 2010 | 4 377 303 000 $ US | −26 628 089 000 $ US |
| 2009 | 1 857 961 000 $ US | −12 698 752 000 $ US |
| 2008 | −1 033 990 000 $ US | −10 646 227 000 $ US |
| 2007 | −3 397 847 000 $ US | −10 979 085 000 $ US |
| 2006 | −4 245 336 000 $ US | −10 035 360 000 $ US |
| 2005 | −3 889 260 000 $ US | −9 486 858 000 $ US |
| 2004 | −1 838 889 000 $ US | −10 088 678 000 $ US |
| 2003 | −489 625 000 $ US | −7 845 519 000 $ US |
| 2002 | −974 776 000 $ US | −4 322 088 000 $ US |
| 2001 | 16 565 000 $ US | −2 982 878 000 $ US |
En 2025, selon la Malaisie, son commerce de biens avec la Chine affichait un déficit de 38,3 milliards de dollars ; selon la Chine, son commerce de biens avec la Malaisie affichait un excédent de 15,7 milliards de dollars. En 2001, les chiffres étaient un excédent de 16,6 millions de dollars pour la Malaisie et un déficit de 2,98 milliards de dollars pour la Chine.
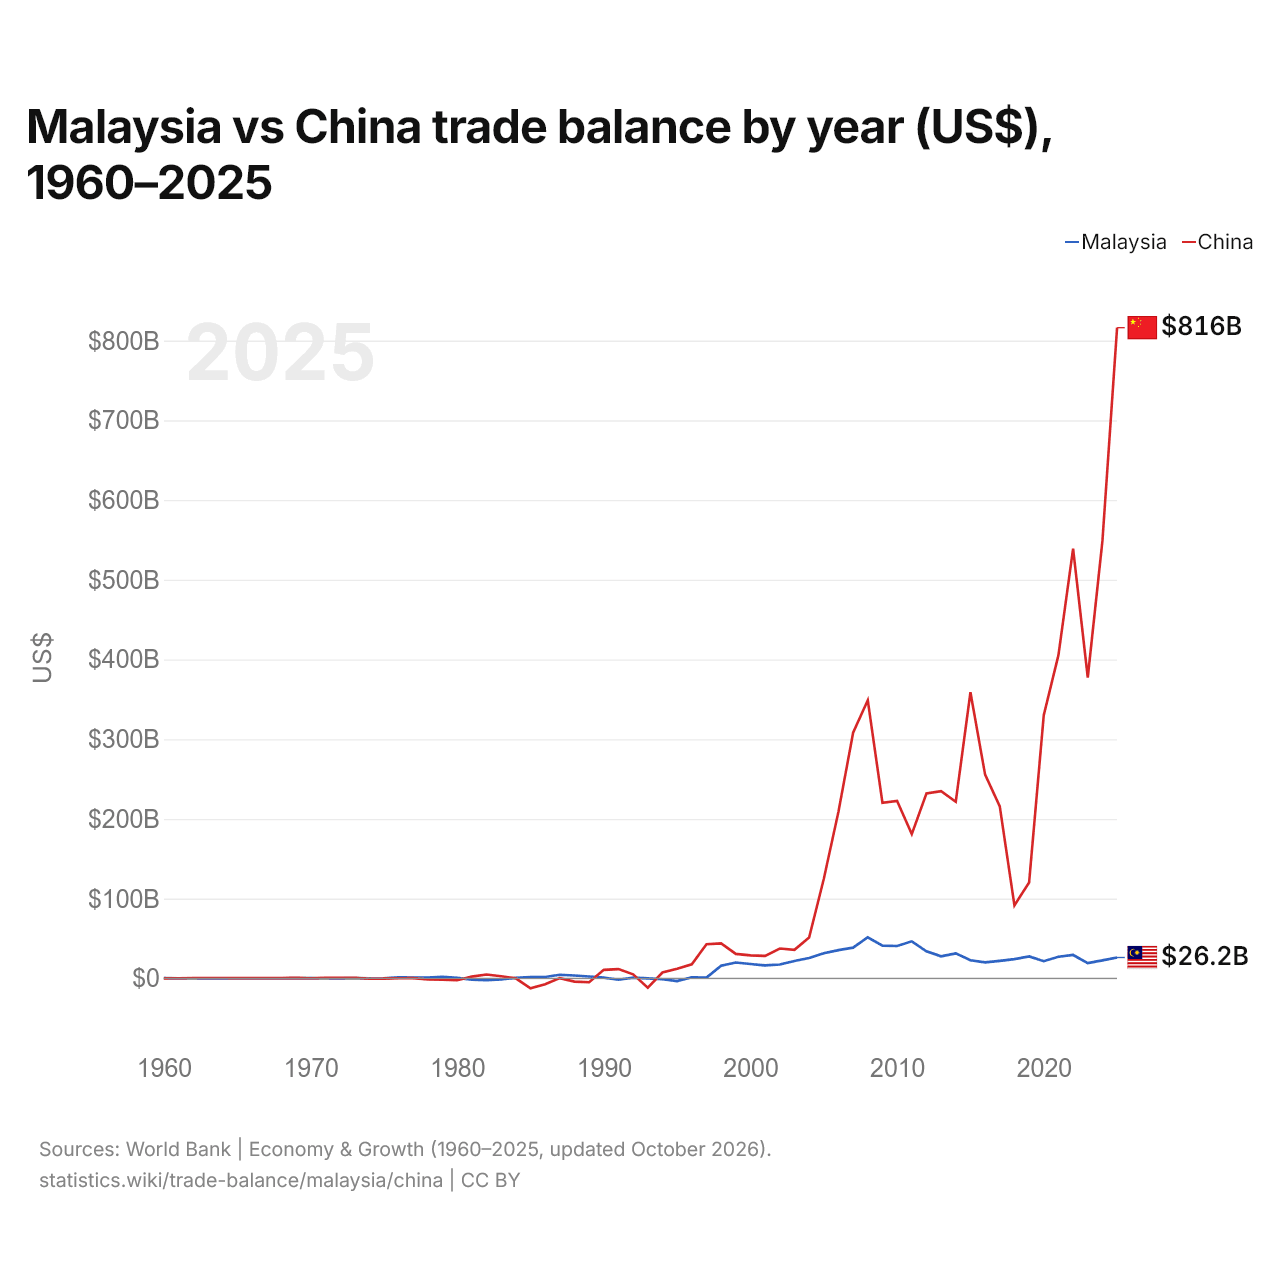
Malaisie vs Chine : balance commerciale par année ($ US), 1960–2025
| Année | $ US | |
|---|---|---|
 Malaisie |
 Chine |
|
| 2025 | 26 155 524 757 $ US | 816 189 653 994 $ US |
| 2024 | 22 460 782 733 $ US | 548 703 728 924 $ US |
| 2023 | 19 055 372 040 $ US | 377 368 486 355 $ US |
| 2022 | 29 327 053 202 $ US | 539 054 406 264 $ US |
| 2021 | 27 025 058 299 $ US | 405 394 120 058 $ US |
| 2020 | 21 488 160 292 $ US | 330 134 703 664 $ US |
| 2019 | 27 486 823 562 $ US | 120 151 888 640 $ US |
| 2018 | 24 065 106 453 $ US | 91 487 265 093 $ US |
| 2017 | 21 917 407 075 $ US | 215 697 133 466 $ US |
| 2016 | 20 039 192 525 $ US | 255 484 319 295 $ US |
| 2015 | 22 683 943 184 $ US | 358 836 357 206 $ US |
| 2014 | 31 354 839 498 $ US | 221 549 605 872 $ US |
| 2013 | 27 598 385 101 $ US | 234 872 118 182 $ US |
| 2012 | 33 828 012 876 $ US | 231 864 021 797 $ US |
| 2011 | 46 400 608 104 $ US | 180 895 321 770 $ US |
| 2010 | 40 588 161 698 $ US | 222 400 893 687 $ US |
| 2009 | 41 006 916 436 $ US | 220 130 401 367 $ US |
| 2008 | 51 542 148 543 $ US | 348 832 533 154 $ US |
| 2007 | 38 460 318 906 $ US | 308 036 028 783 $ US |
| 2006 | 35 456 849 547 $ US | 208 918 924 501 $ US |
| 2005 | 31 496 198 138 $ US | 124 626 797 517 $ US |
| 2004 | 25 414 473 684 $ US | 51 174 382 540 $ US |
| 2003 | 21 700 789 474 $ US | 35 821 129 066 $ US |
| 2002 | 17 400 263 158 $ US | 37 382 671 264 $ US |
| 2001 | 16 181 842 105 $ US | 28 086 220 298 $ US |
| 2000 | 18 019 473 684 $ US | 28 785 851 579 $ US |
| 1999 | 19 828 157 895 $ US | 30 640 955 367 $ US |
| 1998 | 15 873 420 302 $ US | 43 836 689 480 $ US |
| 1997 | 913 833 487 $ US | 42 823 220 000 $ US |
| 1996 | 1 397 169 886 $ US | 17 550 000 000 $ US |
| 1995 | −3 490 430 622 $ US | 11 958 000 000 $ US |
| 1994 | −1 194 177 717 $ US | 7 357 000 000 $ US |
| 1993 | −66 819 601 $ US | −11 792 000 000 $ US |
| 1992 | 802 607 296 $ US | 4 998 000 000 $ US |
| 1991 | −1 798 807 099 $ US | 11 601 000 000 $ US |
| 1990 | 899 856 740 $ US | 10 668 000 000 $ US |
| 1989 | 2 355 988 278 $ US | −4 928 000 000 $ US |
| 1988 | 3 600 145 564 $ US | −4 061 000 000 $ US |
| 1987 | 4 463 339 575 $ US | 291 000 000 $ US |
| 1986 | 1 690 528 007 $ US | −7 390 000 000 $ US |
| 1985 | 1 601 261 678 $ US | −12 501 000 000 $ US |
| 1984 | 647 709 846 $ US | 54 000 000 $ US |
| 1983 | −1 505 654 281 $ US | 2 571 000 000 $ US |
| 1982 | −2 335 368 110 $ US | 4 812 000 000 $ US |
| 1981 | −1 546 357 077 $ US | 2 150 220 000 $ US |
| 1980 | 612 802 801 $ US | −2 436 990 000 $ US |
| 1979 | 1 882 617 862 $ US | −1 572 643 000 $ US |
| 1978 | 910 173 477 $ US | −1 460 560 000 $ US |
| 1977 | 986 477 378 $ US | 210 672 000 $ US |
| 1976 | 1 154 402 290 $ US | 90 791 000 $ US |
| 1975 | 42 055 296 $ US | −380 480 000 $ US |
| 1974 | 22 433 941 $ US | −503 131 000 $ US |
| 1973 | 431 787 765 $ US | 701 488 000 $ US |
| 1972 | −68 095 828 $ US | 620 760 000 $ US |
| 1971 | 60 938 452 $ US | 477 289 000 $ US |
| 1970 | 163 660 240 $ US | 72 660 000 $ US |
| 1969 | 373 707 215 $ US | 483 200 000 $ US |
| 1968 | 117 273 505 $ US | 269 480 000 $ US |
| 1967 | 77 746 781 $ US | 236 020 000 $ US |
| 1966 | 124 133 515 $ US | 185 300 000 $ US |
| 1965 | 132 300 194 $ US | 330 180 000 $ US |
| 1964 | 46 386 735 $ US | 457 760 000 $ US |
| 1963 | 43 446 730 $ US | 455 680 000 $ US |
| 1962 | 58 146 752 $ US | 377 650 000 $ US |
| 1961 | 130 993 525 $ US | 97 520 000 $ US |
| 1960 | 264 600 388 $ US | −7 530 000 $ US |
En 2025, la balance commerciale de la Malaisie affichait un excédent de 26,2 milliards de dollars et celle de la Chine un excédent de 816 milliards de dollars ; l'excédent de la Chine était 31 fois plus grand. En 1960, la balance commerciale de la Malaisie affichait un excédent de 265 millions de dollars et celle de la Chine un déficit de 7,53 millions de dollars.
De 1960 à 2025, la balance commerciale de la Malaisie a été excédentaire pendant 58 des 66 années, et celle de la Chine pendant 55. Les balances commerciales de la Malaisie et de la Chine n'ont été déficitaires en même temps qu'une seule de ces années, en 1993.
Malaisie vs Chine : chiffres de la balance commerciale
|
Malaisie
|
Chine
|
|
|---|---|---|
| Biens et services, $ US | +26,2 Md $US (2025) | +816 Md $US (2025) |
| % du PIB | +5,5 % (2025) | +4,2 % (2025) |
| Années d'excédent depuis 2000 | 26 sur 26 | 26 sur 26 |
| Solde des biens entre les deux, chiffres propres | −38,3 Md $US (2025) | +15,7 Md $US (2025) |
| Premier excédent en biens avec | États-Unis (+23,5 Md $US, 2025) | États-Unis (+280 Md $US, 2025) |
| Premier déficit en biens avec | Chine (−38,3 Md $US, 2025) | Australie (−51,6 Md $US, 2025) |
Comparer la balance commerciale de 2 pays au choix
Sources :
- Banque mondiale | Économie et croissance (1960–2025, mis à jour en octobre 2026)
- TradeMap (2001–2025, mis à jour en octobre 2026)
Creative Commons Attribution (CC BY) : vous pouvez copier, partager, adapter et réutiliser ce contenu, y compris à des fins commerciales, à condition de citer statistics.wiki et d’indiquer les modifications apportées. Les sources citées ci-dessus peuvent avoir leurs propres conditions de licence.