
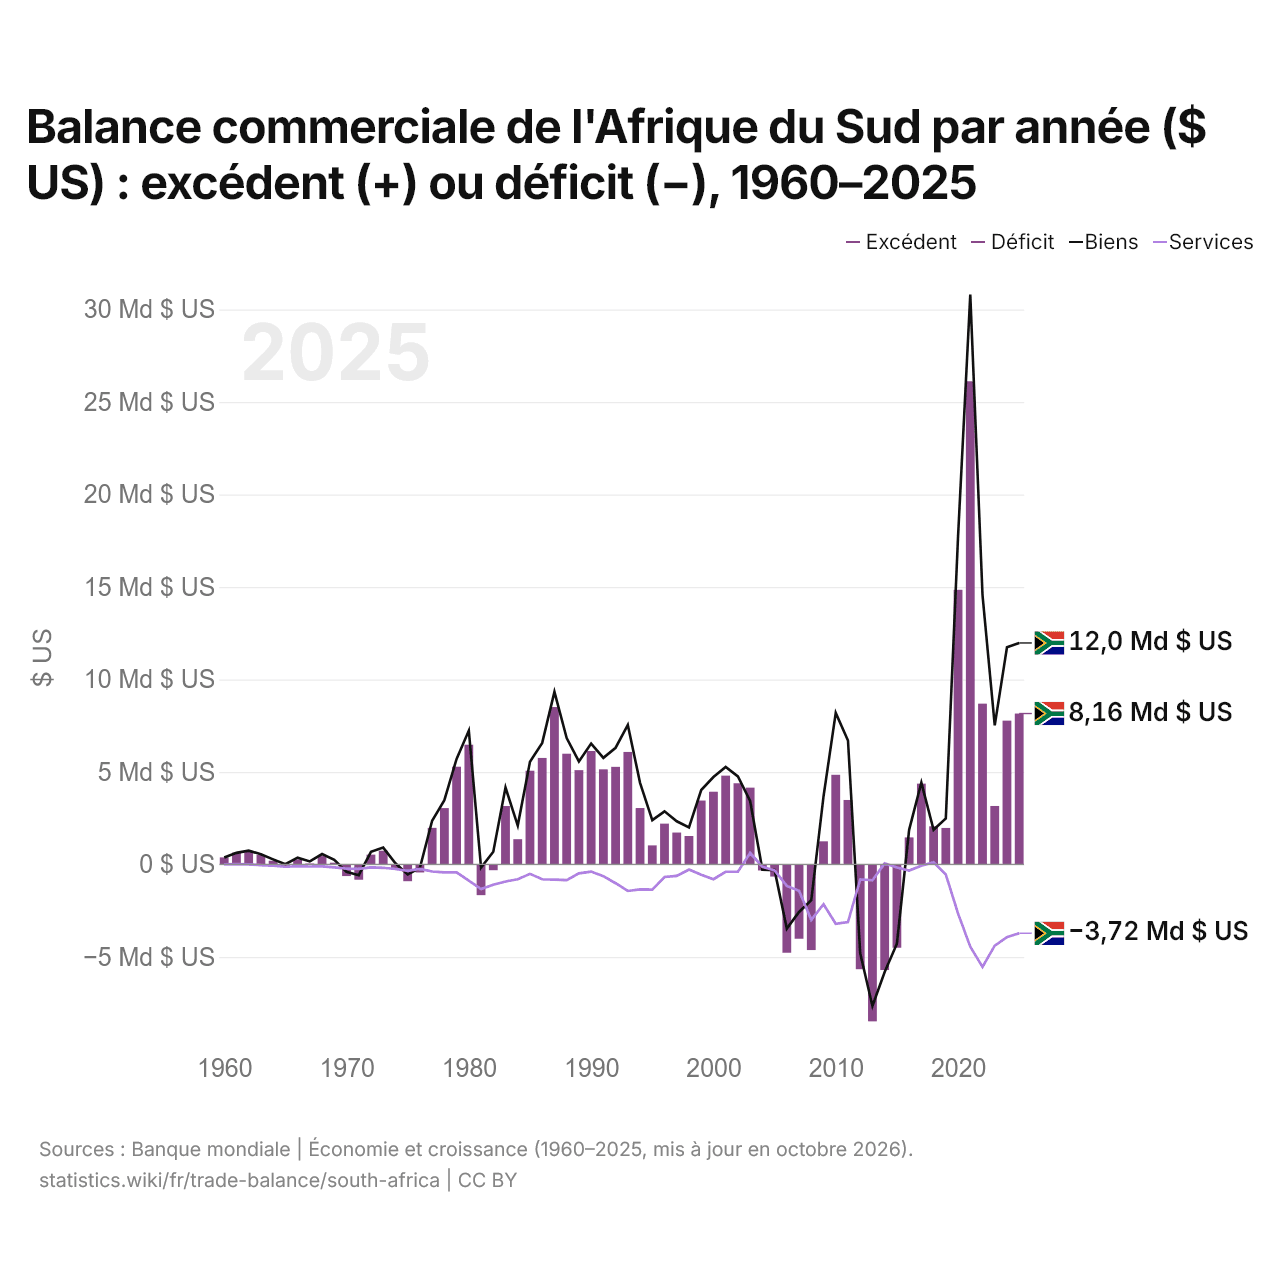
Balance commerciale de l'Afrique du Sud par année ($ US) : excédent (+) ou déficit (−), 1960–2025
| Année | $ US | ||
|---|---|---|---|
| Biens et services | Biens | Services | |
| 2025 | 8 156 197 563 $ US | 11 971 652 125 $ US | −3 721 778 404 $ US |
| 2024 | 7 770 353 743 $ US | 11 741 967 640 $ US | −3 930 465 741 $ US |
| 2023 | 3 157 373 832 $ US | 7 515 726 053 $ US | −4 393 216 861 $ US |
| 2022 | 8 688 913 284 $ US | 14 560 233 149 $ US | −5 550 318 085 $ US |
| 2021 | 26 116 878 100 $ US | 30 800 205 379 $ US | −4 448 389 333 $ US |
| 2020 | 14 844 418 855 $ US | 17 730 896 425 $ US | −2 651 662 164 $ US |
| 2019 | 1 971 031 573 $ US | 2 486 815 338 $ US | −547 952 388 $ US |
| 2018 | 2 060 869 012 $ US | 1 869 995 894 $ US | 116 409 137 $ US |
| 2017 | 4 364 612 609 $ US | 4 417 017 302 $ US | −67 934 082 $ US |
| 2016 | 1 459 108 010 $ US | 1 870 008 761 $ US | −336 116 702 $ US |
| 2015 | −4 505 144 659 $ US | −4 289 888 909 $ US | −166 416 732 $ US |
| 2014 | −5 711 637 795 $ US | −5 818 694 650 $ US | 55 371 595 $ US |
| 2013 | −8 484 620 143 $ US | −7 658 521 274 $ US | −855 229 676 $ US |
| 2012 | −5 665 968 002 $ US | −4 808 880 713 $ US | −815 667 826 $ US |
| 2011 | 3 482 071 046 $ US | 6 696 435 829 $ US | −3 119 395 956 $ US |
| 2010 | 4 844 542 605 $ US | 8 191 926 027 $ US | −3 212 415 441 $ US |
| 2009 | 1 246 330 694 $ US | 3 674 065 122 $ US | −2 153 124 974 $ US |
| 2008 | −4 631 880 776 $ US | −1 932 391 722 $ US | −2 998 127 130 $ US |
| 2007 | −4 020 941 427 $ US | −2 570 404 092 $ US | −1 428 642 202 $ US |
| 2006 | −4 775 569 076 $ US | −3 469 487 836 $ US | −1 164 641 977 $ US |
| 2005 | −659 346 396 $ US | −311 045 257 $ US | −322 296 646 $ US |
| 2004 | −328 808 196 $ US | −281 482 250 $ US | −128 886 159 $ US |
| 2003 | 4 150 567 322 $ US | 3 430 561 534 $ US | 616 005 084 $ US |
| 2002 | 4 384 888 471 $ US | 4 756 139 235 $ US | −393 786 360 $ US |
| 2001 | 4 797 436 597 $ US | 5 264 844 561 $ US | −397 039 611 $ US |
| 2000 | 3 927 186 668 $ US | 4 724 962 991 $ US | −804 578 917 $ US |
| 1999 | 3 454 792 582 $ US | 4 022 986 276 $ US | −563 246 274 $ US |
| 1998 | 1 534 110 766 $ US | 2 002 679 495 $ US | −273 014 142 $ US |
| 1997 | 1 723 321 503 $ US | 2 328 638 122 $ US | −618 431 092 $ US |
| 1996 | 2 204 054 614 $ US | 2 870 781 637 $ US | −678 542 960 $ US |
| 1995 | 1 026 444 100 $ US | 2 390 834 897 $ US | −1 363 607 533 $ US |
| 1994 | 3 045 794 213 $ US | 4 408 088 554 $ US | −1 347 411 697 $ US |
| 1993 | 6 080 039 367 $ US | 7 539 538 288 $ US | −1 437 470 260 $ US |
| 1992 | 5 274 167 658 $ US | 6 304 711 731 $ US | −1 018 253 167 $ US |
| 1991 | 5 137 769 505 $ US | 5 758 157 972 $ US | −634 351 542 $ US |
| 1990 | 6 132 598 158 $ US | 6 531 911 292 $ US | −388 726 578 $ US |
| 1989 | 5 093 650 495 $ US | 5 565 106 948 $ US | −482 552 405 $ US |
| 1988 | 5 982 490 187 $ US | 6 828 837 706 $ US | −851 785 933 $ US |
| 1987 | 8 506 247 197 $ US | 9 326 975 335 $ US | −824 135 156 $ US |
| 1986 | 5 755 718 082 $ US | 6 565 404 522 $ US | −801 892 156 $ US |
| 1985 | 5 064 892 817 $ US | 5 544 375 942 $ US | −510 249 100 $ US |
| 1984 | 1 361 778 161 $ US | 2 097 642 637 $ US | −800 106 165 $ US |
| 1983 | 3 155 013 015 $ US | 4 154 047 703 $ US | −921 850 553 $ US |
| 1982 | −314 970 492 $ US | 684 633 644 $ US | −1 099 141 086 $ US |
| 1981 | −1 663 667 886 $ US | −170 085 899 $ US | −1 333 583 589 $ US |
| 1980 | 6 468 644 153 $ US | 7 235 873 983 $ US | −877 445 403 $ US |
| 1979 | 5 282 516 036 $ US | 5 705 585 614 $ US | −426 579 476 $ US |
| 1978 | 3 044 050 761 $ US | 3 474 149 997 $ US | −428 950 000 $ US |
| 1977 | 1 974 550 494 $ US | 2 359 799 998 $ US | −385 250 000 $ US |
| 1976 | −433 550 108 $ US | −190 900 000 $ US | −242 650 000 $ US |
| 1975 | −911 416 780 $ US | −541 475 531 $ US | −353 339 346 $ US |
| 1974 | −201 625 662 $ US | 60 548 186 $ US | −251 035 881 $ US |
| 1973 | 739 236 756 $ US | 908 040 823 $ US | −184 119 423 $ US |
| 1972 | 525 545 546 $ US | 679 511 764 $ US | −161 067 756 $ US |
| 1971 | −829 118 995 $ US | −584 923 866 $ US | −244 680 439 $ US |
| 1970 | −632 799 747 $ US | −403 199 839 $ US | −229 599 908 $ US |
| 1969 | 89 599 964 $ US | 247 799 901 $ US | −158 199 937 $ US |
| 1968 | 449 399 820 $ US | 557 199 777 $ US | −107 799 957 $ US |
| 1967 | 47 599 981 $ US | 160 999 936 $ US | −113 399 955 $ US |
| 1966 | 264 599 894 $ US | 366 799 853 $ US | −102 199 959 $ US |
| 1965 | −121 799 951 $ US | 6 999 997 $ US | −128 799 949 $ US |
| 1964 | 198 799 920 $ US | 271 599 891 $ US | −72 799 971 $ US |
| 1963 | 510 999 796 $ US | 550 199 780 $ US | −39 199 984 $ US |
| 1962 | 743 399 703 $ US | 741 999 703 $ US | 1 399 999 $ US |
| 1961 | 639 799 744 $ US | 622 999 751 $ US | 16 799 993 $ US |
| 1960 | 377 999 849 $ US | 377 999 849 $ US | 0 $ US |
En 2025, la balance commerciale de l'Afrique du Sud affichait un excédent de 8,16 milliards de dollars, contre un excédent de 378 millions de dollars en 1960. Le plus grand déficit a été de 8,48 milliards de dollars, en 2013, et le plus grand excédent de 26,1 milliards de dollars, en 2021. La balance commerciale de l'Afrique du Sud est excédentaire chaque année depuis 2016. Le commerce de biens affichait un excédent de 12 milliards de dollars et celui de services un déficit de 3,72 milliards de dollars.
En 2025, le solde commercial de l'Afrique du Sud était le 2e plus élevé de 50 pays situés en Afrique, où les soldes allaient d'un déficit de 42,7 milliards de dollars en Égypte à un excédent de 13,8 milliards de dollars en Angola. De 2016 à 2025, les soldes commerciaux de l'Afrique du Sud ont totalisé un excédent de 78,6 milliards de dollars, contre un déficit de 28,2 milliards de dollars de 2006 à 2015. En 2025, les transactions courantes de l'Afrique du Sud affichaient un déficit de 0,4 % du PIB.
Commerce de biens de l'Afrique du Sud avec ses 10 principaux partenaires commerciaux, selon l'Afrique du Sud, 2025
| Pays | Exportations vers | Importations depuis | Solde | |
|---|---|---|---|---|
 Chine |
12,8 Md $US | 23,5 Md $US | −10,7 Md $US | vs Chine |
 Allemagne |
9,21 Md $US | 7,22 Md $US | +1,98 Md $US | |
 États-Unis |
8,27 Md $US | 7,21 Md $US | +1,07 Md $US | vs USA |
 Inde |
4,70 Md $US | 7,65 Md $US | −2,96 Md $US | vs Inde |
 Japon |
5,49 Md $US | 2,43 Md $US | +3,06 Md $US | |
 Royaume-Uni |
5,40 Md $US | 1,55 Md $US | +3,85 Md $US | |
 Mozambique |
5,27 Md $US | 911 M $US | +4,36 Md $US | vs Mozambique |
 Namibie |
4,15 Md $US | 1,53 Md $US | +2,62 Md $US | |
 EAU |
2,99 Md $US | 2,60 Md $US | +387 M $US | |
 Pays-Bas |
4,30 Md $US | 1,15 Md $US | +3,15 Md $US |
Balance commerciale de l'Afrique du Sud : excédent (+) ou déficit (−)
| Biens et services, $ US, 2025 | +8,16 Md $US |
|---|---|
| % du PIB, 2025 | +1,9 % |
| Années d'excédent, 2000–2025 | 17 |
| Biens, $ US, 2025 | +12,0 Md $US |
| Services, $ US, 2025 | −3,72 Md $US |
| Premier excédent en biens, 2025 | Mozambique +4,36 Md $US |
| Premier déficit en biens, 2025 | Chine −10,7 Md $US |
Comparer la balance commerciale de l'Afrique du Sud avec celle d'autres pays
Sources :
- TradeMap (2025, mis à jour en octobre 2026)
- Banque mondiale | Économie et croissance (1960–2025, mis à jour en octobre 2026)
Creative Commons Attribution (CC BY) : vous pouvez copier, partager, adapter et réutiliser ce contenu, y compris à des fins commerciales, à condition de citer statistics.wiki et d’indiquer les modifications apportées. Les sources citées ci-dessus peuvent avoir leurs propres conditions de licence.