
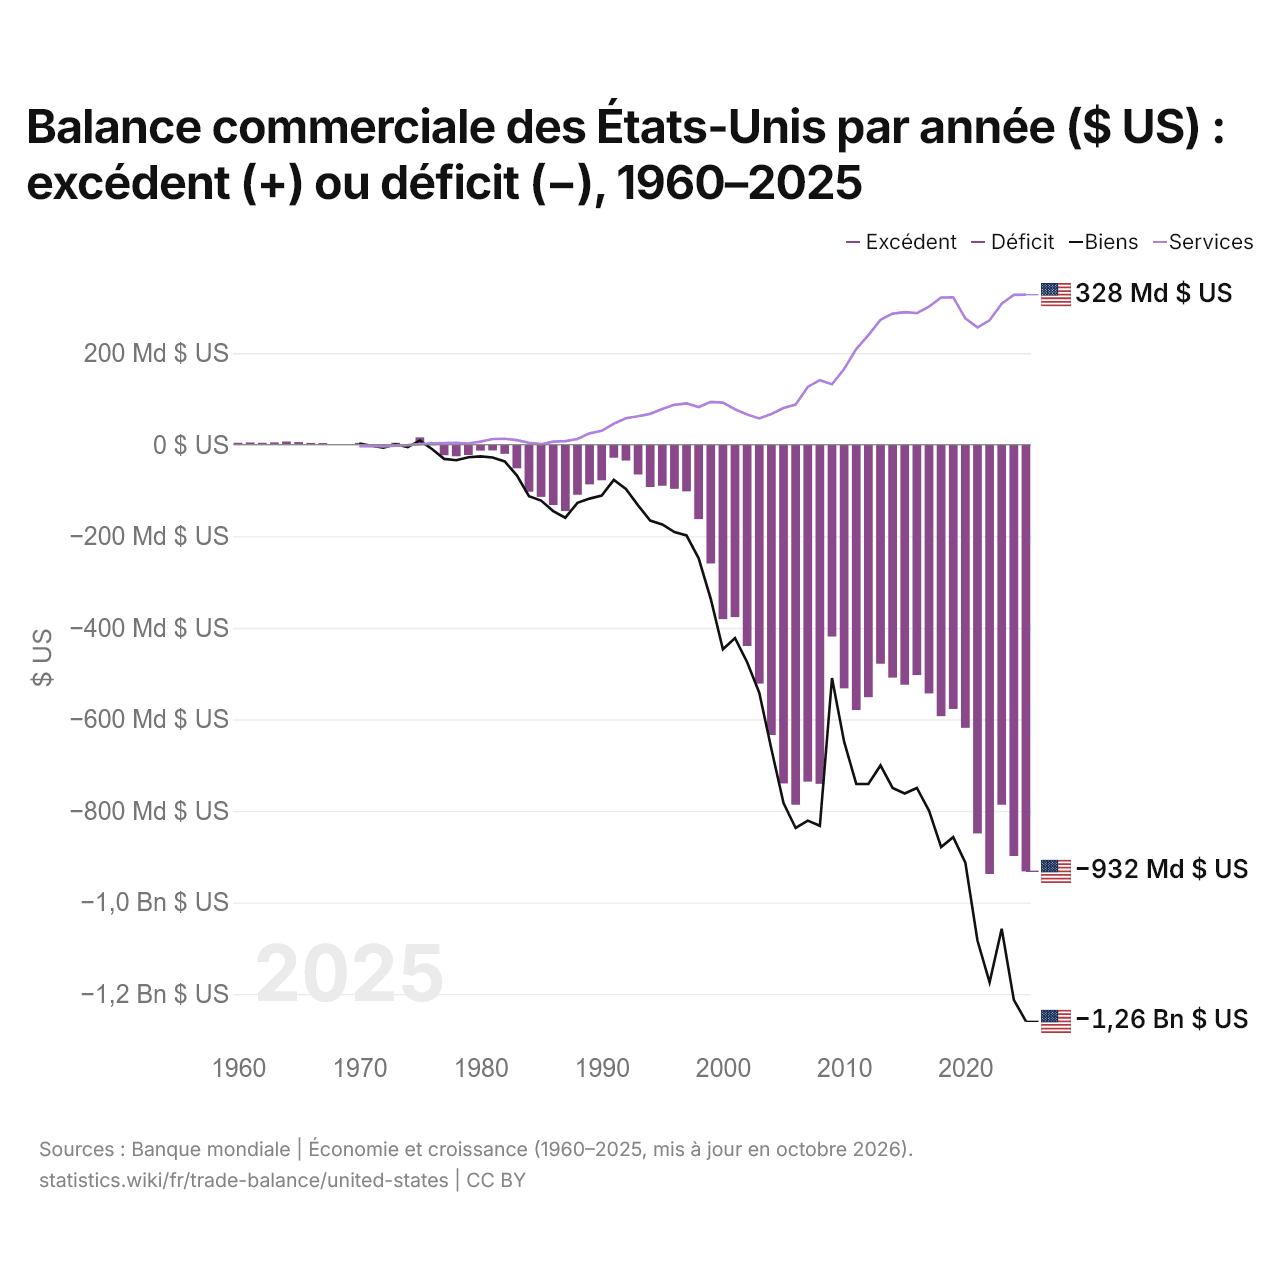
Balance commerciale des États-Unis par année ($ US) : excédent (+) ou déficit (−), 1960–2025
| Année | $ US | ||
|---|---|---|---|
| Biens et services | Biens | Services | |
| 2025 | −931 962 000 000 $ US | −1 259 620 000 000 $ US | 327 658 000 000 $ US |
| 2024 | −898 460 000 000 $ US | −1 212 788 000 000 $ US | 327 313 000 000 $ US |
| 2023 | −786 496 000 000 $ US | −1 057 509 000 000 $ US | 307 911 000 000 $ US |
| 2022 | −937 889 000 000 $ US | −1 174 566 000 000 $ US | 271 677 000 000 $ US |
| 2021 | −849 233 000 000 $ US | −1 083 187 000 000 $ US | 256 082 000 000 $ US |
| 2020 | −618 554 000 000 $ US | −912 878 000 000 $ US | 275 826 000 000 $ US |
| 2019 | −577 290 000 000 $ US | −857 259 000 000 $ US | 321 853 000 000 $ US |
| 2018 | −593 077 000 000 $ US | −878 748 000 000 $ US | 321 531 000 000 $ US |
| 2017 | −543 329 000 000 $ US | −799 340 000 000 $ US | 301 497 000 000 $ US |
| 2016 | −503 272 000 000 $ US | −749 801 000 000 $ US | 287 204 000 000 $ US |
| 2015 | −524 320 000 000 $ US | −761 866 000 000 $ US | 289 607 000 000 $ US |
| 2014 | −508 900 000 000 $ US | −749 917 000 000 $ US | 286 294 000 000 $ US |
| 2013 | −478 453 000 000 $ US | −700 538 000 000 $ US | 272 591 000 000 $ US |
| 2012 | −551 617 000 000 $ US | −741 118 000 000 $ US | 239 395 000 000 $ US |
| 2011 | −579 616 000 000 $ US | −740 997 000 000 $ US | 208 877 000 000 $ US |
| 2010 | −532 308 000 000 $ US | −648 673 000 000 $ US | 165 274 000 000 $ US |
| 2009 | −419 153 000 000 $ US | −509 696 000 000 $ US | 131 965 000 000 $ US |
| 2008 | −740 871 000 000 $ US | −832 492 000 000 $ US | 140 887 000 000 $ US |
| 2007 | −735 933 000 000 $ US | −821 193 000 000 $ US | 126 107 000 000 $ US |
| 2006 | −786 453 000 000 $ US | −837 288 000 000 $ US | 87 750 000 000 $ US |
| 2005 | −739 902 000 000 $ US | −782 805 000 000 $ US | 80 190 000 000 $ US |
| 2004 | −634 141 000 000 $ US | −664 765 000 000 $ US | 67 076 000 000 $ US |
| 2003 | −521 955 000 000 $ US | −541 644 000 000 $ US | 57 286 000 000 $ US |
| 2002 | −439 745 000 000 $ US | −475 246 000 000 $ US | 65 793 000 000 $ US |
| 2001 | −376 747 000 000 $ US | −422 368 000 000 $ US | 77 259 000 000 $ US |
| 2000 | −381 073 000 000 $ US | −446 783 000 000 $ US | 91 772 000 000 $ US |
| 1999 | −259 550 000 000 $ US | −337 067 000 000 $ US | 93 539 000 000 $ US |
| 1998 | −162 711 000 000 $ US | −248 221 000 000 $ US | 82 091 000 000 $ US |
| 1997 | −101 971 000 000 $ US | −198 428 000 000 $ US | 90 140 000 000 $ US |
| 1996 | −96 377 000 000 $ US | −191 000 000 000 $ US | 86 965 000 000 $ US |
| 1995 | −89 762 000 000 $ US | −174 170 000 000 $ US | 77 783 000 000 $ US |
| 1994 | −92 487 000 000 $ US | −165 831 000 000 $ US | 67 320 000 000 $ US |
| 1993 | −65 174 000 000 $ US | −132 451 000 000 $ US | 62 140 000 000 $ US |
| 1992 | −34 738 000 000 $ US | −96 897 000 000 $ US | 57 689 900 000 $ US |
| 1991 | −28 613 000 000 $ US | −76 940 000 000 $ US | 45 760 000 000 $ US |
| 1990 | −77 855 000 000 $ US | −111 042 000 000 $ US | 30 190 000 000 $ US |
| 1989 | −86 741 000 000 $ US | −117 756 000 000 $ US | 24 630 000 000 $ US |
| 1988 | −109 392 000 000 $ US | −126 960 000 000 $ US | 12 300 000 000 $ US |
| 1987 | −144 770 000 000 $ US | −159 551 000 000 $ US | 7 876 000 000 $ US |
| 1986 | −131 869 000 000 $ US | −145 068 000 000 $ US | 6 541 000 000 $ US |
| 1985 | −114 018 000 000 $ US | −122 165 000 000 $ US | 1 063 000 000 $ US |
| 1984 | −102 727 000 000 $ US | −112 481 000 000 $ US | 4 204 000 000 $ US |
| 1983 | −51 642 000 000 $ US | −67 095 000 000 $ US | 9 960 000 000 $ US |
| 1982 | −19 974 000 000 $ US | −36 487 000 000 $ US | 12 950 000 000 $ US |
| 1981 | −12 519 000 000 $ US | −28 050 000 000 $ US | 12 370 000 000 $ US |
| 1980 | −13 056 000 000 $ US | −25 533 000 000 $ US | 6 580 000 000 $ US |
| 1979 | −22 545 000 000 $ US | −27 568 000 000 $ US | 2 601 300 000 $ US |
| 1978 | −25 367 000 000 $ US | −33 927 000 000 $ US | 3 760 000 000 $ US |
| 1977 | −23 094 000 000 $ US | −31 100 000 000 $ US | 3 460 000 000 $ US |
| 1976 | −1 631 000 000 $ US | −9 490 000 000 $ US | 2 670 000 000 $ US |
| 1975 | 15 976 000 000 $ US | 8 910 000 000 $ US | 1 060 000 000 $ US |
| 1974 | −815 000 000 $ US | −5 510 000 000 $ US | −890 000 000 $ US |
| 1973 | 4 110 000 000 $ US | 910 000 000 $ US | −2 050 000 000 $ US |
| 1972 | −3 373 000 000 $ US | −6 420 000 000 $ US | −3 700 000 000 $ US |
| 1971 | 621 000 000 $ US | −2 270 000 000 $ US | −2 770 000 000 $ US |
| 1970 | 3 949 000 000 $ US | 2 590 000 000 $ US | −3 200 000 000 $ US |
| 1969 | 1 429 548 641 $ US | - | - |
| 1968 | 1 347 972 646 $ US | - | - |
| 1967 | 3 550 386 094 $ US | - | - |
| 1966 | 3 858 020 910 $ US | - | - |
| 1965 | 5 604 920 537 $ US | - | - |
| 1964 | 6 900 003 028 $ US | - | - |
| 1963 | 4 928 769 439 $ US | - | - |
| 1962 | 4 093 606 558 $ US | - | - |
| 1961 | 4 907 882 243 $ US | - | - |
| 1960 | 4 200 885 010 $ US | - | - |
En 2025, la balance commerciale des États-Unis affichait un déficit de 932 milliards de dollars, contre un excédent de 4,2 milliards de dollars en 1960. Le plus grand déficit a été de 938 milliards de dollars, en 2022, et le plus grand excédent de 16 milliards de dollars, en 1975. La balance commerciale des États-Unis est déficitaire chaque année depuis 1976. Le commerce de biens affichait un déficit de 1,26 billion de dollars et celui de services un excédent de 328 milliards de dollars.
En 2025, le déficit commercial des États-Unis était le plus élevé des deux pays situés en Amérique du Nord, devant le Canada (déficit de 19,6 milliards de dollars). De 2016 à 2025, les soldes commerciaux des États-Unis ont totalisé un déficit de 7,24 billions de dollars, contre un déficit de 5,86 billions de dollars de 2006 à 2015. En 2025, les transactions courantes des États-Unis affichaient un déficit de 3,8 % du PIB.
Commerce de biens des États-Unis avec leurs 10 principaux partenaires commerciaux, selon les États-Unis, 2025
| Pays | Exportations vers | Importations depuis | Solde | |
|---|---|---|---|---|
 Mexique |
338 Md $US | 539 Md $US | −201 Md $US | vs Mexique |
 Canada |
330 Md $US | 393 Md $US | −63,2 Md $US | vs Canada |
 Chine |
106 Md $US | 327 Md $US | −221 Md $US | vs Chine |
 Allemagne |
83,1 Md $US | 159 Md $US | −76,1 Md $US | vs Allemagne |
 Japon |
82,1 Md $US | 150 Md $US | −67,7 Md $US | vs Japon |
 Vietnam |
15,7 Md $US | 201 Md $US | −186 Md $US | |
 Corée du Sud |
68,8 Md $US | 129 Md $US | −60,2 Md $US | |
 Suisse |
71,7 Md $US | 107 Md $US | −34,8 Md $US | vs Suisse |
 Royaume-Uni |
97,0 Md $US | 66,0 Md $US | +31,0 Md $US | vs R.-U. |
 Irlande |
19,3 Md $US | 134 Md $US | −115 Md $US | vs Irlande |
Balance commerciale des États-Unis : excédent (+) ou déficit (−)
Comparer la balance commerciale des États-Unis avec celle d'autres pays
Sources :
- TradeMap (2025, mis à jour en octobre 2026)
- Banque mondiale | Économie et croissance (1960–2025, mis à jour en octobre 2026)
Creative Commons Attribution (CC BY) : vous pouvez copier, partager, adapter et réutiliser ce contenu, y compris à des fins commerciales, à condition de citer statistics.wiki et d’indiquer les modifications apportées. Les sources citées ci-dessus peuvent avoir leurs propres conditions de licence.