
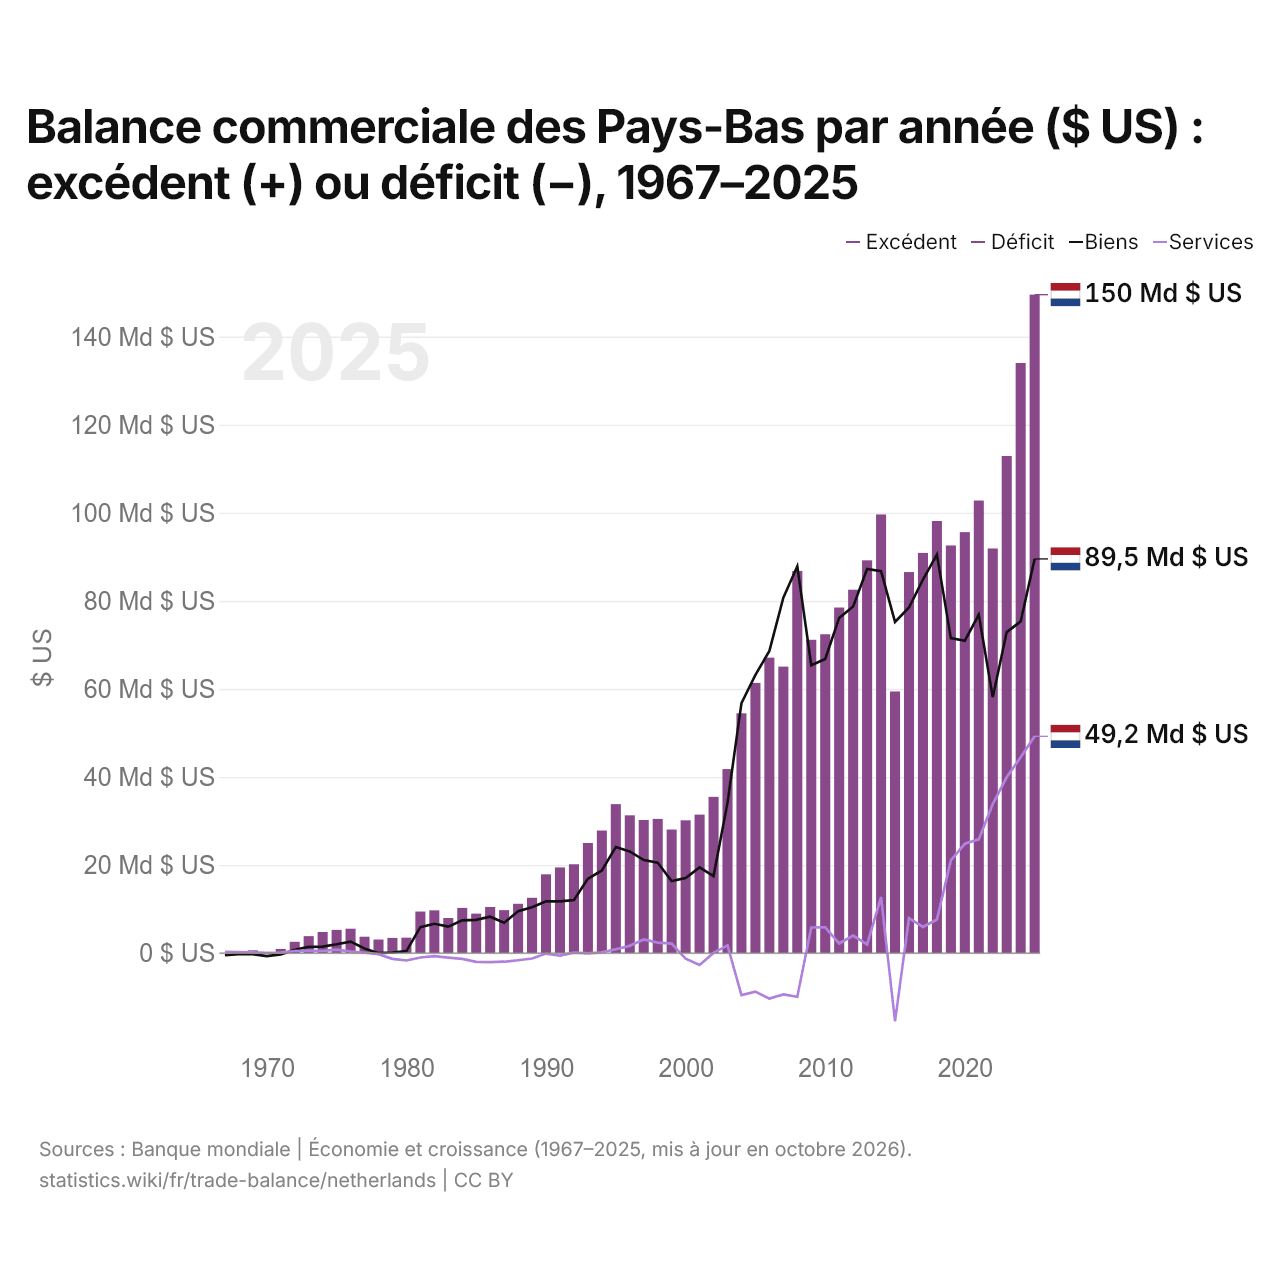
Balance commerciale des Pays-Bas par année ($ US) : excédent (+) ou déficit (−), 1967–2025
| Année | $ US | ||
|---|---|---|---|
| Biens et services | Biens | Services | |
| 2025 | 149 519 368 722 $ US | 89 508 816 553 $ US | 49 218 557 573 $ US |
| 2024 | 134 007 361 075 $ US | 75 310 635 895 $ US | 44 471 847 992 $ US |
| 2023 | 112 885 525 975 $ US | 72 895 933 332 $ US | 39 955 342 845 $ US |
| 2022 | 91 883 758 920 $ US | 58 094 684 984 $ US | 33 849 689 586 $ US |
| 2021 | 102 760 026 360 $ US | 76 865 707 527 $ US | 25 817 526 901 $ US |
| 2020 | 95 585 823 574 $ US | 70 935 071 924 $ US | 24 816 218 047 $ US |
| 2019 | 92 567 108 267 $ US | 71 512 342 643 $ US | 21 063 640 903 $ US |
| 2018 | 98 121 967 356 $ US | 90 498 213 735 $ US | 7 613 125 640 $ US |
| 2017 | 90 871 553 835 $ US | 84 828 035 137 $ US | 5 929 936 079 $ US |
| 2016 | 86 519 974 912 $ US | 78 466 922 651 $ US | 7 942 369 755 $ US |
| 2015 | 59 405 539 190 $ US | 75 193 772 396 $ US | −15 502 657 649 $ US |
| 2014 | 99 609 660 307 $ US | 86 720 583 307 $ US | 12 707 238 247 $ US |
| 2013 | 89 195 079 396 $ US | 87 218 850 538 $ US | 1 969 923 188 $ US |
| 2012 | 82 521 976 395 $ US | 78 708 158 881 $ US | 3 954 757 003 $ US |
| 2011 | 78 468 693 473 $ US | 76 108 708 138 $ US | 2 164 534 643 $ US |
| 2010 | 72 400 038 600 $ US | 66 804 826 312 $ US | 5 865 804 939 $ US |
| 2009 | 71 142 272 210 $ US | 65 356 329 008 $ US | 5 811 462 945 $ US |
| 2008 | 86 778 984 923 $ US | 87 835 387 787 $ US | −9 932 816 833 $ US |
| 2007 | 65 052 481 087 $ US | 80 715 212 652 $ US | −9 374 709 884 $ US |
| 2006 | 67 090 411 938 $ US | 68 605 423 159 $ US | −10 336 131 380 $ US |
| 2005 | 61 353 555 872 $ US | 63 163 253 915 $ US | −8 756 580 296 $ US |
| 2004 | 54 443 116 593 $ US | 56 773 339 345 $ US | −9 542 456 708 $ US |
| 2003 | 41 785 064 886 $ US | 34 121 659 506 $ US | 1 756 264 495 $ US |
| 2002 | 35 473 198 312 $ US | 17 473 991 813 $ US | 45 834 624 $ US |
| 2001 | 31 443 761 454 $ US | 19 442 346 132 $ US | −2 715 440 928 $ US |
| 2000 | 30 149 484 438 $ US | 17 039 393 630 $ US | −1 261 278 417 $ US |
| 1999 | 28 049 104 555 $ US | 16 371 713 455 $ US | 2 137 147 355 $ US |
| 1998 | 30 467 673 850 $ US | 20 538 658 233 $ US | 2 367 013 626 $ US |
| 1997 | 30 213 462 842 $ US | 21 128 203 992 $ US | 3 084 357 648 $ US |
| 1996 | 31 287 581 699 $ US | 23 081 870 295 $ US | 1 643 792 202 $ US |
| 1995 | 33 823 771 617 $ US | 24 086 268 976 $ US | 873 003 289 $ US |
| 1994 | 27 817 382 250 $ US | 18 748 657 917 $ US | 156 185 839 $ US |
| 1993 | 24 988 427 860 $ US | 16 878 141 476 $ US | −54 937 049 $ US |
| 1992 | 20 174 407 268 $ US | 12 046 810 511 $ US | 84 409 163 $ US |
| 1991 | 19 451 513 437 $ US | 11 740 518 315 $ US | −575 812 611 $ US |
| 1990 | 17 883 441 849 $ US | 11 762 777 692 $ US | −110 940 568 $ US |
| 1989 | 12 556 469 916 $ US | 10 393 384 192 $ US | −1 236 928 479 $ US |
| 1988 | 11 195 472 182 $ US | 9 513 421 951 $ US | −1 628 842 599 $ US |
| 1987 | 9 754 287 424 $ US | 6 873 062 681 $ US | −1 960 883 578 $ US |
| 1986 | 10 457 692 031 $ US | 8 268 069 697 $ US | −2 071 722 987 $ US |
| 1985 | 8 962 418 392 $ US | 7 540 249 403 $ US | −1 987 747 624 $ US |
| 1984 | 10 259 458 104 $ US | 7 422 619 506 $ US | −1 334 908 221 $ US |
| 1983 | 7 966 659 717 $ US | 5 995 161 370 $ US | −1 040 024 807 $ US |
| 1982 | 9 708 016 011 $ US | 6 655 514 875 $ US | −704 973 584 $ US |
| 1981 | 9 423 038 947 $ US | 5 901 879 083 $ US | −1 002 919 606 $ US |
| 1980 | 3 500 606 296 $ US | 445 872 800 $ US | −1 688 172 660 $ US |
| 1979 | 3 439 706 690 $ US | 134 357 498 $ US | −1 314 036 813 $ US |
| 1978 | 3 075 533 714 $ US | −24 792 005 $ US | −275 308 589 $ US |
| 1977 | 3 708 195 205 $ US | 1 047 777 807 $ US | 73 881 606 $ US |
| 1976 | 5 533 782 297 $ US | 2 607 015 005 $ US | 340 046 393 $ US |
| 1975 | 5 259 495 469 $ US | 1 992 351 370 $ US | 761 579 974 $ US |
| 1974 | 4 786 280 843 $ US | 1 477 331 260 $ US | 471 270 234 $ US |
| 1973 | 3 843 968 154 $ US | 1 399 608 166 $ US | 567 595 600 $ US |
| 1972 | 2 565 120 846 $ US | 763 969 287 $ US | 460 757 381 $ US |
| 1971 | 940 433 584 $ US | −308 664 138 $ US | 135 292 814 $ US |
| 1970 | 195 855 604 $ US | −685 635 359 $ US | 78 176 796 $ US |
| 1969 | 611 798 612 $ US | −256 906 077 $ US | 138 674 033 $ US |
| 1968 | - | −262 154 696 $ US | 213 535 911 $ US |
| 1967 | - | −494 751 381 $ US | 264 088 398 $ US |
En 2025, la balance commerciale des Pays-Bas affichait un excédent de 150 milliards de dollars, contre un excédent de 612 millions de dollars en 1969. La balance commerciale des Pays-Bas est excédentaire chaque année depuis 1969.
En 2025, le solde commercial des Pays-Bas était le 2e plus élevé de 41 pays situés en Europe, où les soldes allaient d'un déficit de 56,8 milliards de dollars en Ukraine à un excédent de 290 milliards de dollars en Irlande. De 2016 à 2025, les soldes commerciaux des Pays-Bas ont totalisé un excédent de 1,05 billion de dollars, contre un excédent de 772 milliards de dollars de 2006 à 2015. En 2025, les transactions courantes des Pays-Bas affichaient un excédent de 7,6 % du PIB.
Commerce de biens des Pays-Bas avec leurs 10 principaux partenaires commerciaux, selon les Pays-Bas, 2025
| Pays | Exportations vers | Importations depuis | Solde | |
|---|---|---|---|---|
 Allemagne |
164 Md $US | 111 Md $US | +52,4 Md $US | vs Allemagne |
 Belgique |
84,8 Md $US | 62,8 Md $US | +21,9 Md $US | vs Belgique |
 États-Unis |
36,3 Md $US | 64,7 Md $US | −28,4 Md $US | vs USA |
 France |
55,8 Md $US | 23,9 Md $US | +31,9 Md $US | vs France |
 Chine |
21,1 Md $US | 54,8 Md $US | −33,7 Md $US | |
 Royaume-Uni |
46,7 Md $US | 28,2 Md $US | +18,5 Md $US | vs R.-U. |
 Italie |
32,4 Md $US | 16,8 Md $US | +15,6 Md $US | vs Italie |
 Pologne |
24,0 Md $US | 15,7 Md $US | +8,32 Md $US | vs Pologne |
 Espagne |
26,2 Md $US | 12,2 Md $US | +14,0 Md $US | vs Espagne |
 Suède |
14,4 Md $US | 9,77 Md $US | +4,68 Md $US | vs Suède |
Balance commerciale des Pays-Bas : excédent (+) ou déficit (−)
Comparer la balance commerciale des Pays-Bas avec celle d'autres pays
Sources :
- TradeMap (2025, mis à jour en octobre 2026)
- Banque mondiale | Économie et croissance (1967–2025, mis à jour en octobre 2026)
Creative Commons Attribution (CC BY) : vous pouvez copier, partager, adapter et réutiliser ce contenu, y compris à des fins commerciales, à condition de citer statistics.wiki et d’indiquer les modifications apportées. Les sources citées ci-dessus peuvent avoir leurs propres conditions de licence.