
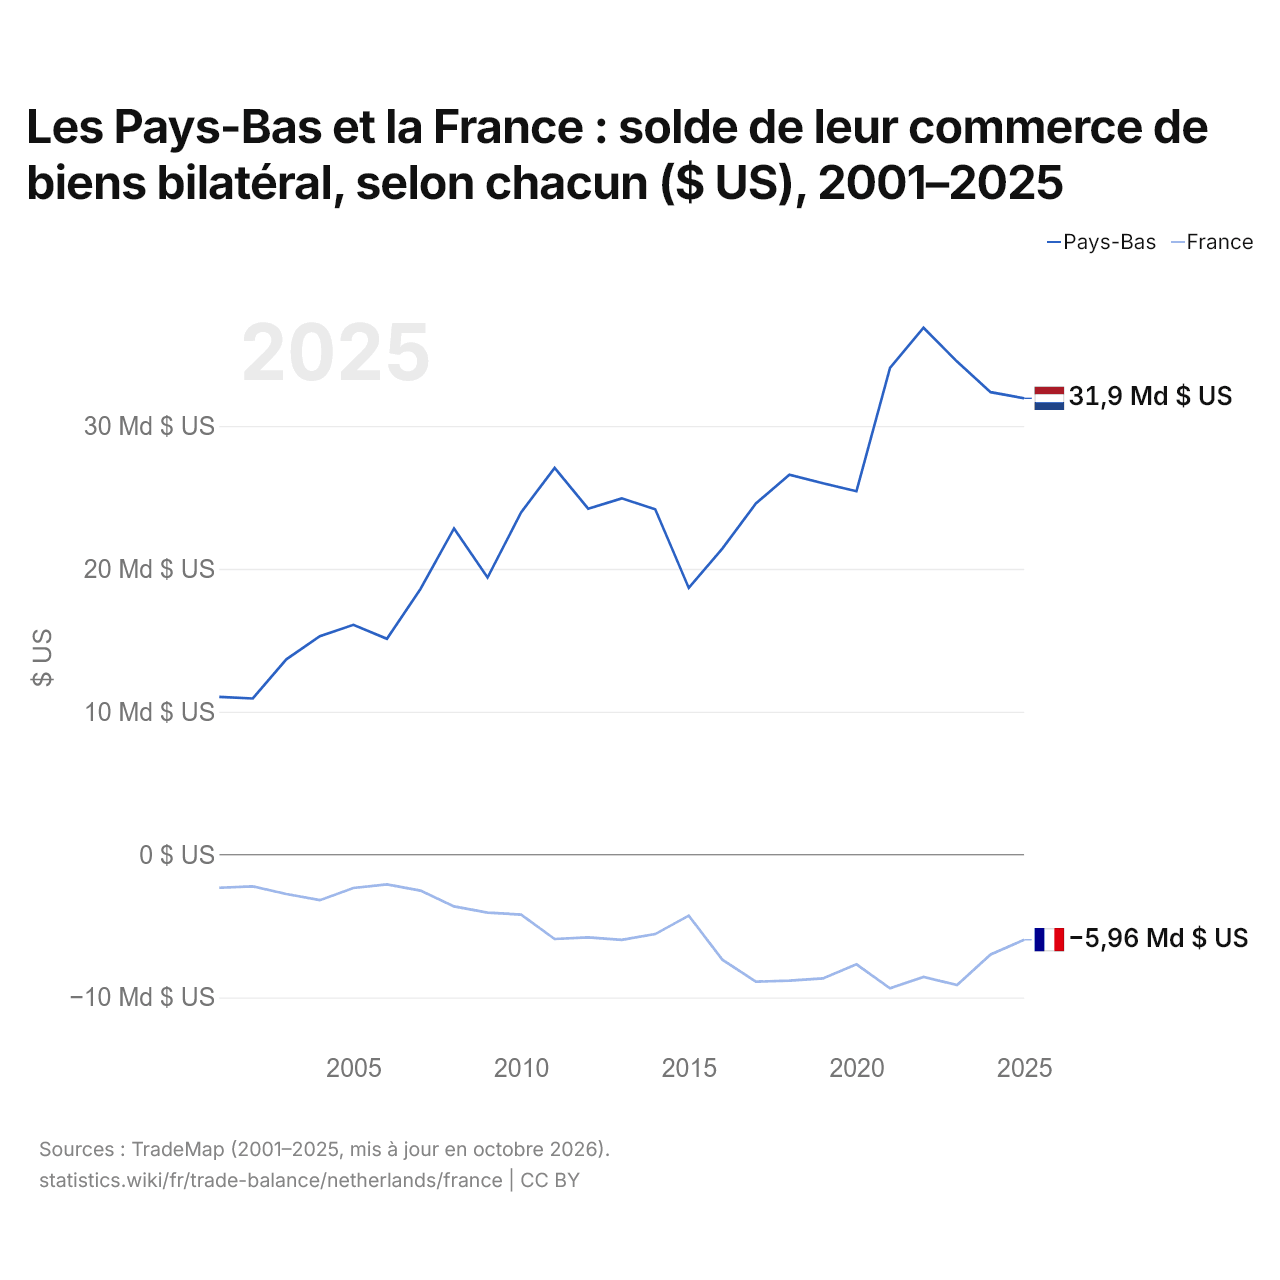
Les Pays-Bas et la France : solde de leur commerce de biens bilatéral, selon chacun ($ US), 2001–2025
| Année | $ US | |
|---|---|---|
| Pays-Bas | France | |
| 2025 | 31 937 045 000 $ US | −5 957 603 000 $ US |
| 2024 | 32 369 452 000 $ US | −6 986 669 000 $ US |
| 2023 | 34 506 451 000 $ US | −9 131 603 000 $ US |
| 2022 | 36 879 127 000 $ US | −8 555 921 000 $ US |
| 2021 | 34 067 422 000 $ US | −9 356 172 000 $ US |
| 2020 | 25 434 173 000 $ US | −7 678 671 000 $ US |
| 2019 | 25 990 120 000 $ US | −8 665 889 000 $ US |
| 2018 | 26 582 522 000 $ US | −8 820 118 000 $ US |
| 2017 | 24 571 709 000 $ US | −8 890 553 000 $ US |
| 2016 | 21 422 098 000 $ US | −7 350 710 000 $ US |
| 2015 | 18 665 757 000 $ US | −4 270 152 000 $ US |
| 2014 | 24 170 241 000 $ US | −5 560 821 000 $ US |
| 2013 | 24 935 373 000 $ US | −5 964 575 000 $ US |
| 2012 | 24 210 888 000 $ US | −5 796 977 000 $ US |
| 2011 | 27 072 976 000 $ US | −5 905 583 000 $ US |
| 2010 | 23 952 209 000 $ US | −4 196 541 000 $ US |
| 2009 | 19 393 125 000 $ US | −4 056 496 000 $ US |
| 2008 | 22 831 760 000 $ US | −3 625 098 000 $ US |
| 2007 | 18 596 434 000 $ US | −2 517 991 000 $ US |
| 2006 | 15 100 966 000 $ US | −2 083 506 000 $ US |
| 2005 | 16 083 505 000 $ US | −2 333 175 000 $ US |
| 2004 | 15 288 263 000 $ US | −3 186 370 000 $ US |
| 2003 | 13 669 956 000 $ US | −2 759 846 000 $ US |
| 2002 | 10 928 788 000 $ US | −2 228 065 000 $ US |
| 2001 | 11 042 720 000 $ US | −2 318 872 000 $ US |
En 2025, selon les Pays-Bas, leur commerce de biens avec la France affichait un excédent de 31,9 milliards de dollars ; selon la France, son commerce de biens avec les Pays-Bas affichait un déficit de 5,96 milliards de dollars. En 2001, les chiffres étaient un excédent de 11 milliards de dollars pour les Pays-Bas et un déficit de 2,32 milliards de dollars pour la France.
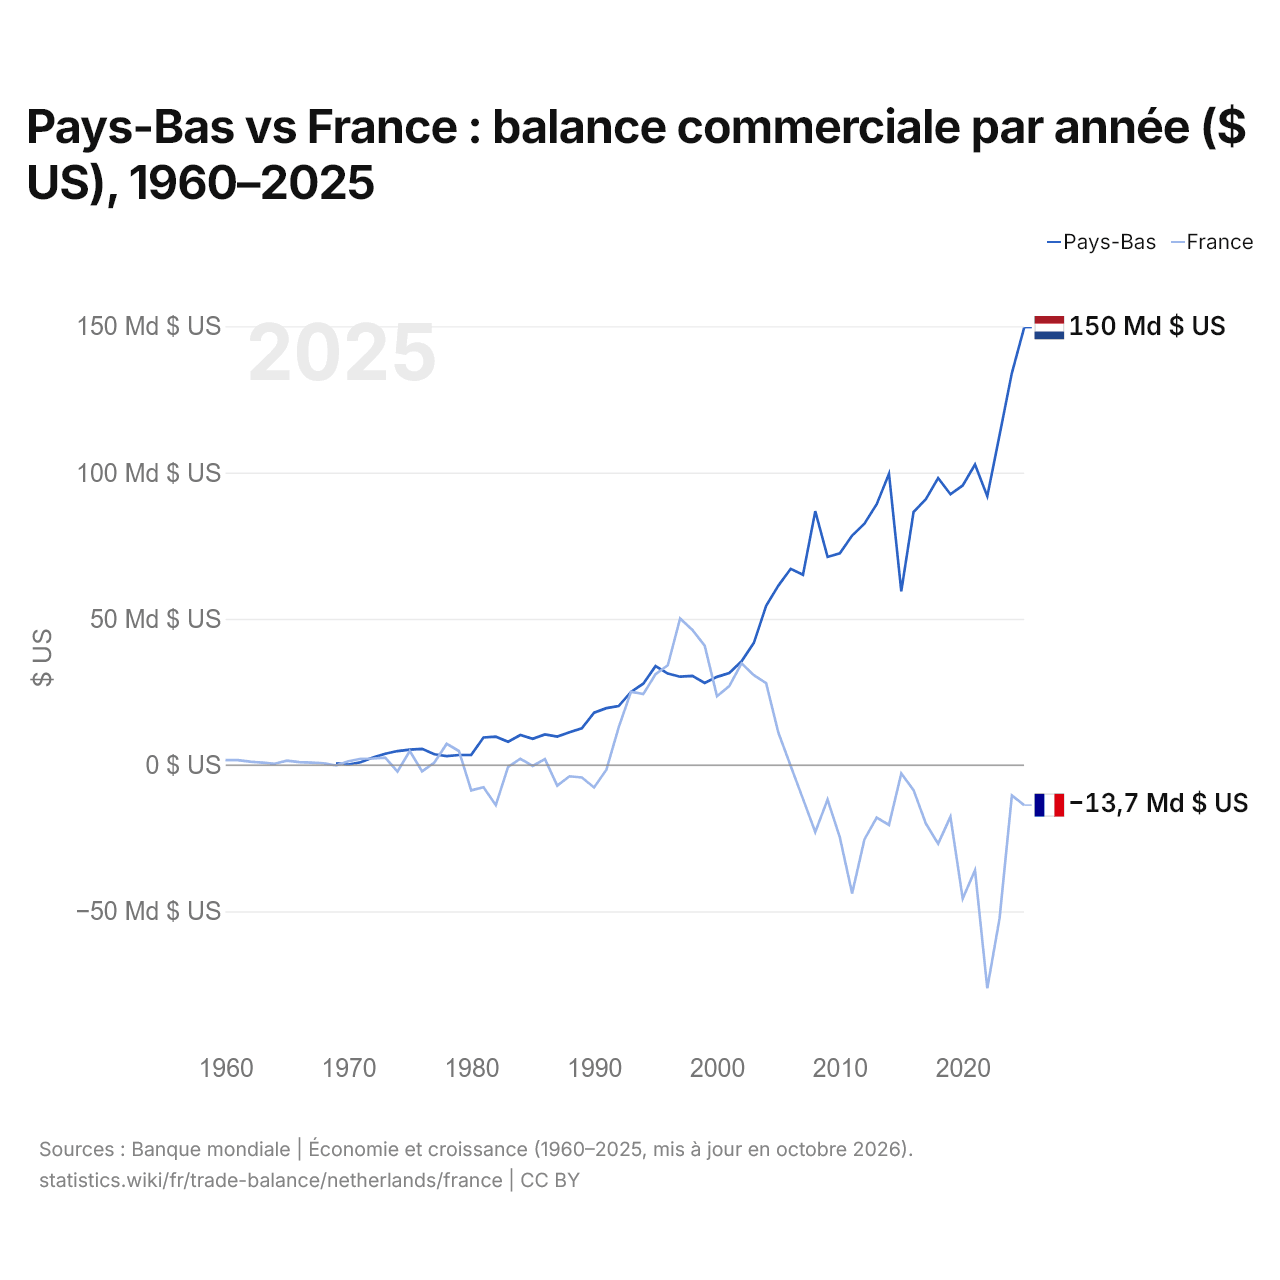
Pays-Bas vs France : balance commerciale par année ($ US), 1960–2025
| Année | $ US | |
|---|---|---|
 Pays-Bas |
 France |
|
| 2025 | 149 519 368 722 $ US | −13 691 892 676 $ US |
| 2024 | 134 007 361 075 $ US | −10 387 713 597 $ US |
| 2023 | 112 885 525 975 $ US | −52 372 867 874 $ US |
| 2022 | 91 883 758 920 $ US | −76 323 175 109 $ US |
| 2021 | 102 760 026 360 $ US | −35 964 530 801 $ US |
| 2020 | 95 585 823 574 $ US | −45 662 030 726 $ US |
| 2019 | 92 567 108 267 $ US | −17 694 749 944 $ US |
| 2018 | 98 121 967 356 $ US | −26 878 288 452 $ US |
| 2017 | 90 871 553 835 $ US | −19 990 725 131 $ US |
| 2016 | 86 519 974 912 $ US | −8 555 918 301 $ US |
| 2015 | 59 405 539 190 $ US | −2 874 747 900 $ US |
| 2014 | 99 609 660 307 $ US | −20 476 182 589 $ US |
| 2013 | 89 195 079 396 $ US | −17 928 929 470 $ US |
| 2012 | 82 521 976 395 $ US | −25 424 169 112 $ US |
| 2011 | 78 468 693 473 $ US | −43 858 143 696 $ US |
| 2010 | 72 400 038 600 $ US | −24 731 111 845 $ US |
| 2009 | 71 142 272 210 $ US | −11 805 159 462 $ US |
| 2008 | 86 778 984 923 $ US | −22 878 042 543 $ US |
| 2007 | 65 052 481 087 $ US | −11 565 875 316 $ US |
| 2006 | 67 090 411 938 $ US | −314 778 625 $ US |
| 2005 | 61 353 555 872 $ US | 11 054 488 524 $ US |
| 2004 | 54 443 116 593 $ US | 27 985 189 929 $ US |
| 2003 | 41 785 064 886 $ US | 30 738 831 193 $ US |
| 2002 | 35 473 198 312 $ US | 34 756 831 657 $ US |
| 2001 | 31 443 761 454 $ US | 26 968 658 956 $ US |
| 2000 | 30 149 484 438 $ US | 23 545 285 267 $ US |
| 1999 | 28 049 104 555 $ US | 40 790 461 990 $ US |
| 1998 | 30 467 673 850 $ US | 46 166 110 740 $ US |
| 1997 | 30 213 462 842 $ US | 50 108 338 953 $ US |
| 1996 | 31 287 581 699 $ US | 34 112 706 757 $ US |
| 1995 | 33 823 771 617 $ US | 31 069 260 087 $ US |
| 1994 | 27 817 382 250 $ US | 24 247 400 756 $ US |
| 1993 | 24 988 427 860 $ US | 25 065 323 141 $ US |
| 1992 | 20 174 407 268 $ US | 12 888 475 836 $ US |
| 1991 | 19 451 513 437 $ US | −1 575 747 006 $ US |
| 1990 | 17 883 441 849 $ US | −7 657 631 611 $ US |
| 1989 | 12 556 469 916 $ US | −4 238 741 518 $ US |
| 1988 | 11 195 472 182 $ US | −3 842 638 476 $ US |
| 1987 | 9 754 287 424 $ US | −7 038 415 366 $ US |
| 1986 | 10 457 692 031 $ US | 2 015 437 068 $ US |
| 1985 | 8 962 418 392 $ US | −286 173 164 $ US |
| 1984 | 10 259 458 104 $ US | 2 161 975 531 $ US |
| 1983 | 7 966 659 717 $ US | −632 756 692 $ US |
| 1982 | 9 708 016 011 $ US | −13 723 325 681 $ US |
| 1981 | 9 423 038 947 $ US | −7 579 843 090 $ US |
| 1980 | 3 500 606 296 $ US | −8 643 123 254 $ US |
| 1979 | 3 439 706 690 $ US | 4 816 373 728 $ US |
| 1978 | 3 075 533 714 $ US | 7 241 133 721 $ US |
| 1977 | 3 708 195 205 $ US | 868 280 289 $ US |
| 1976 | 5 533 782 297 $ US | −2 147 364 108 $ US |
| 1975 | 5 259 495 469 $ US | 4 812 605 171 $ US |
| 1974 | 4 786 280 843 $ US | −2 215 630 115 $ US |
| 1973 | 3 843 968 154 $ US | 2 527 401 296 $ US |
| 1972 | 2 565 120 846 $ US | 2 245 383 615 $ US |
| 1971 | 940 433 584 $ US | 2 159 464 899 $ US |
| 1970 | 195 855 604 $ US | 1 297 980 394 $ US |
| 1969 | 611 798 612 $ US | −146 618 606 $ US |
| 1968 | - | 612 901 162 $ US |
| 1967 | - | 840 231 291 $ US |
| 1966 | - | 1 011 891 447 $ US |
| 1965 | - | 1 521 823 088 $ US |
| 1964 | - | 442 835 372 $ US |
| 1963 | - | 841 559 930 $ US |
| 1962 | - | 1 154 587 274 $ US |
| 1961 | - | 1 666 644 737 $ US |
| 1960 | - | 1 710 489 823 $ US |
En 2025, la balance commerciale des Pays-Bas affichait un excédent de 150 milliards de dollars et celle de la France un déficit de 13,7 milliards de dollars. En 1969, la balance commerciale des Pays-Bas affichait un excédent de 612 millions de dollars et celle de la France un déficit de 147 millions de dollars.
De 1969 à 2025, la balance commerciale des Pays-Bas a été excédentaire chacune des 57 années, et celle de la France pendant 24. Les balances commerciales des Pays-Bas et de la France n'ont jamais été déficitaires la même année.
Pays-Bas vs France : chiffres de la balance commerciale
|
Pays-Bas
|
France
|
|
|---|---|---|
| Biens et services, $ US | +150 Md $US (2025) | −13,7 Md $US (2025) |
| % du PIB | +11,2 % (2025) | −0,4 % (2025) |
| Années d'excédent depuis 2000 | 26 sur 26 | 6 sur 26 |
| Solde des biens entre les deux, chiffres propres | +31,9 Md $US (2025) | −5,96 Md $US (2025) |
| Premier excédent en biens avec | Allemagne (+52,4 Md $US, 2025) | Royaume-Uni (+15,2 Md $US, 2025) |
| Premier déficit en biens avec | Chine (−33,7 Md $US, 2025) | Chine (−56,4 Md $US, 2025) |
Comparer la balance commerciale de 2 pays au choix
Sources :
- Banque mondiale | Économie et croissance (1960–2025, mis à jour en octobre 2026)
- TradeMap (2001–2025, mis à jour en octobre 2026)
Creative Commons Attribution (CC BY) : vous pouvez copier, partager, adapter et réutiliser ce contenu, y compris à des fins commerciales, à condition de citer statistics.wiki et d’indiquer les modifications apportées. Les sources citées ci-dessus peuvent avoir leurs propres conditions de licence.