
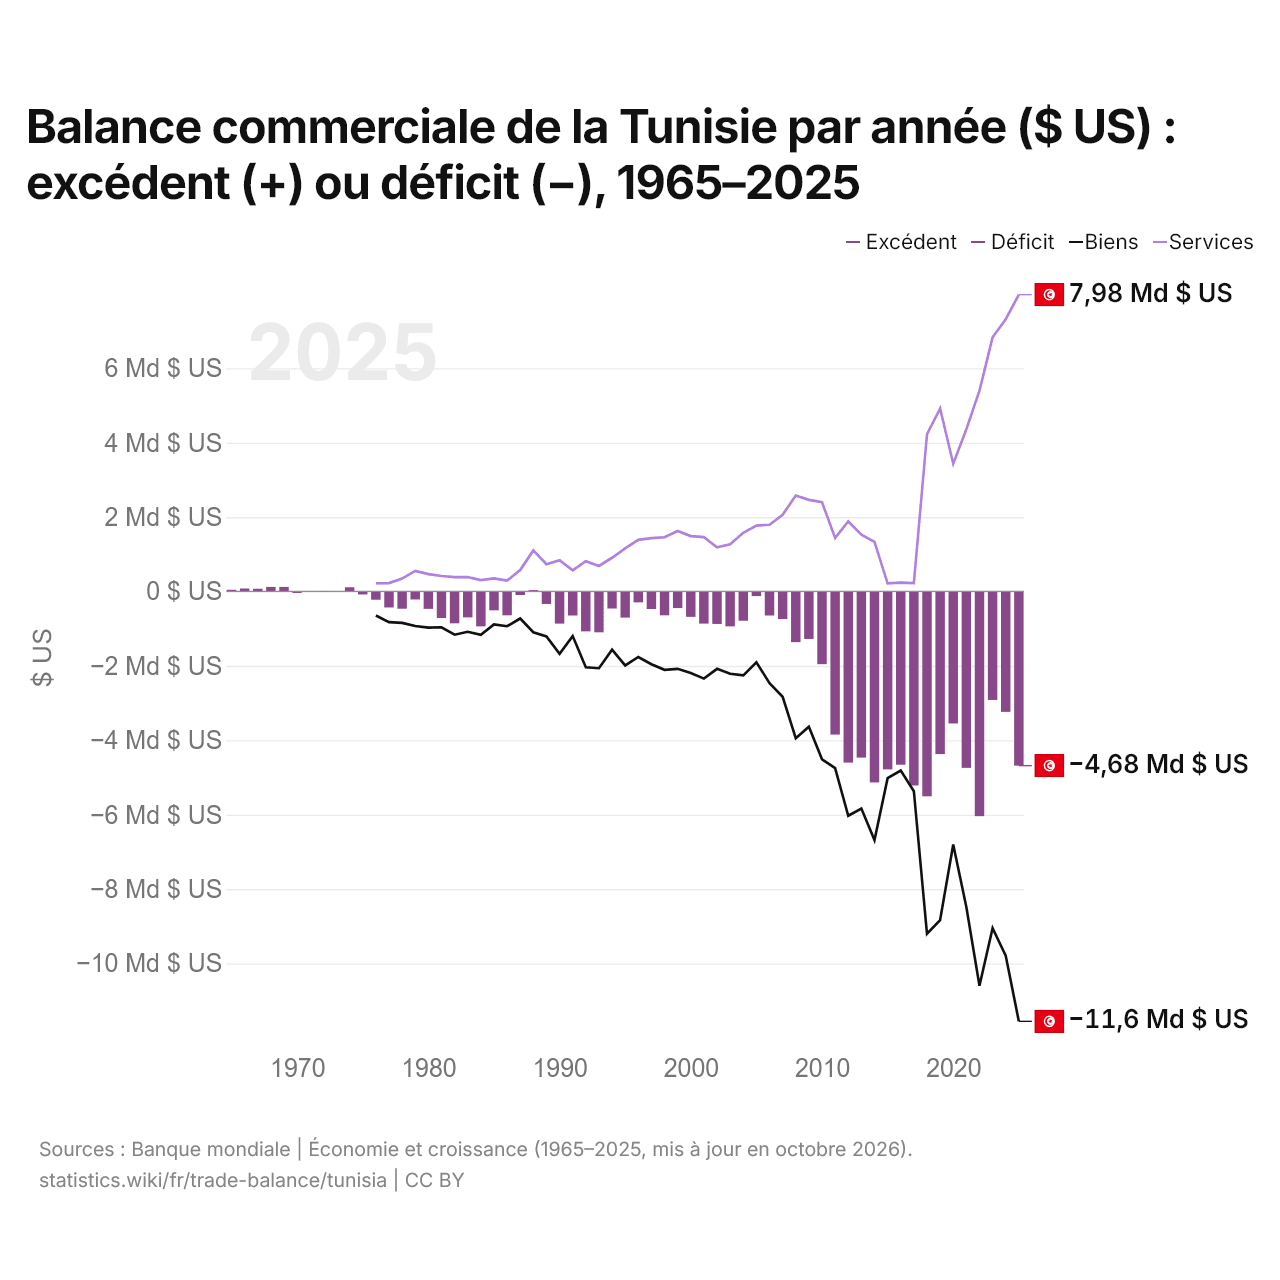
Balance commerciale de la Tunisie par année ($ US) : excédent (+) ou déficit (−), 1965–2025
| Année | $ US | ||
|---|---|---|---|
| Biens et services | Biens | Services | |
| 2025 | −4 682 306 614 $ US | −11 555 824 104 $ US | 7 977 743 150 $ US |
| 2024 | −3 236 480 072 $ US | −9 792 813 071 $ US | 7 318 275 835 $ US |
| 2023 | −2 916 456 198 $ US | −9 052 594 480 $ US | 6 831 689 512 $ US |
| 2022 | −6 040 340 250 $ US | −10 598 412 183 $ US | 5 399 445 951 $ US |
| 2021 | −4 741 691 349 $ US | −8 483 945 975 $ US | 4 360 479 758 $ US |
| 2020 | −3 547 948 021 $ US | −6 800 762 218 $ US | 3 432 332 868 $ US |
| 2019 | −4 371 577 064 $ US | −8 834 891 229 $ US | 4 919 067 408 $ US |
| 2018 | −5 506 699 052 $ US | −9 200 340 626 $ US | 4 224 134 368 $ US |
| 2017 | −5 214 627 442 $ US | −5 368 920 301 $ US | 224 020 170 $ US |
| 2016 | −4 658 727 310 $ US | −4 813 519 343 $ US | 238 450 676 $ US |
| 2015 | −4 783 432 103 $ US | −5 018 696 234 $ US | 217 880 584 $ US |
| 2014 | −5 133 844 817 $ US | −6 684 023 738 $ US | 1 333 470 776 $ US |
| 2013 | −4 467 155 549 $ US | −5 835 503 875 $ US | 1 526 413 246 $ US |
| 2012 | −4 601 047 256 $ US | −6 030 571 903 $ US | 1 880 732 232 $ US |
| 2011 | −3 848 456 900 $ US | −4 746 682 136 $ US | 1 440 491 553 $ US |
| 2010 | −1 955 235 015 $ US | −4 512 016 208 $ US | 2 397 373 201 $ US |
| 2009 | −1 276 406 658 $ US | −3 636 000 074 $ US | 2 461 868 879 $ US |
| 2008 | −1 362 829 934 $ US | −3 945 163 232 $ US | 2 578 680 752 $ US |
| 2007 | −740 542 456 $ US | −2 831 604 482 $ US | 2 062 186 612 $ US |
| 2006 | −647 621 194 $ US | −2 464 040 871 $ US | 1 791 251 103 $ US |
| 2005 | −124 784 864 $ US | −1 903 219 176 $ US | 1 770 341 443 $ US |
| 2004 | −788 700 142 $ US | −2 255 218 927 $ US | 1 577 721 871 $ US |
| 2003 | −939 805 566 $ US | −2 211 169 680 $ US | 1 266 630 016 $ US |
| 2002 | −873 019 055 $ US | −2 079 855 575 $ US | 1 187 283 129 $ US |
| 2001 | −864 661 680 $ US | −2 343 067 152 $ US | 1 461 028 524 $ US |
| 2000 | −682 652 371 $ US | −2 193 066 719 $ US | 1 488 308 751 $ US |
| 1999 | −446 711 206 $ US | −2 079 706 632 $ US | 1 624 481 022 $ US |
| 1998 | −640 980 043 $ US | −2 106 742 190 $ US | 1 456 014 402 $ US |
| 1997 | −471 467 789 $ US | −1 954 954 072 $ US | 1 431 402 542 $ US |
| 1996 | −294 121 273 $ US | −1 760 823 224 $ US | 1 387 906 754 $ US |
| 1995 | −704 240 245 $ US | −1 988 897 700 $ US | 1 156 753 899 $ US |
| 1994 | −459 589 898 $ US | −1 566 895 824 $ US | 905 537 271 $ US |
| 1993 | −1 098 589 080 $ US | −2 064 276 167 $ US | 684 439 057 $ US |
| 1992 | −1 073 908 368 $ US | −2 037 462 782 $ US | 814 080 579 $ US |
| 1991 | −647 826 087 $ US | −1 199 410 569 $ US | 568 881 839 $ US |
| 1990 | −866 136 364 $ US | −1 678 178 368 $ US | 842 504 744 $ US |
| 1989 | −334 976 262 $ US | −1 207 178 816 $ US | 729 995 567 $ US |
| 1988 | 36 371 945 $ US | −1 096 986 977 $ US | 1 103 981 581 $ US |
| 1987 | −95 937 789 $ US | −727 678 639 $ US | 576 833 150 $ US |
| 1986 | −642 042 041 $ US | −934 474 489 $ US | 289 661 904 $ US |
| 1985 | −507 132 449 $ US | −885 564 637 $ US | 352 308 530 $ US |
| 1984 | −938 168 178 $ US | −1 166 273 333 $ US | 303 797 469 $ US |
| 1983 | −697 735 747 $ US | −1 084 319 601 $ US | 387 467 466 $ US |
| 1982 | −856 460 359 $ US | −1 163 051 531 $ US | 385 990 901 $ US |
| 1981 | −713 643 470 $ US | −961 919 791 $ US | 415 144 331 $ US |
| 1980 | −469 004 693 $ US | −970 480 201 $ US | 466 719 486 $ US |
| 1979 | −214 780 225 $ US | −929 975 092 $ US | 553 556 603 $ US |
| 1978 | −463 991 965 $ US | −845 806 512 $ US | 346 011 755 $ US |
| 1977 | −430 769 231 $ US | −825 271 013 $ US | 223 802 308 $ US |
| 1976 | −222 261 093 $ US | −646 026 472 $ US | 219 229 200 $ US |
| 1975 | −81 040 702 $ US | - | - |
| 1974 | 112 025 438 $ US | - | - |
| 1973 | −9 724 950 $ US | - | - |
| 1972 | 13 624 464 $ US | - | - |
| 1971 | −5 545 813 $ US | - | - |
| 1970 | −39 619 048 $ US | - | - |
| 1969 | 122 095 238 $ US | - | - |
| 1968 | 122 476 190 $ US | - | - |
| 1967 | 72 571 429 $ US | - | - |
| 1966 | 78 666 667 $ US | - | - |
| 1965 | 46 095 238 $ US | - | - |
En 2025, la balance commerciale de la Tunisie affichait un déficit de 4,68 milliards de dollars, contre un excédent de 46,1 millions de dollars en 1965. Le plus grand déficit a été de 6,04 milliards de dollars, en 2022, et le plus grand excédent de 122 millions de dollars, en 1968. La balance commerciale de la Tunisie est déficitaire chaque année depuis 1989.
En 2025, le solde commercial de la Tunisie était le 43e plus élevé de 50 pays situés en Afrique, où les soldes allaient d'un déficit de 42,7 milliards de dollars en Égypte à un excédent de 13,8 milliards de dollars en Angola. De 2016 à 2025, les soldes commerciaux de la Tunisie ont totalisé un déficit de 44,9 milliards de dollars, contre un déficit de 28,8 milliards de dollars de 2006 à 2015. En 2025, les transactions courantes de la Tunisie affichaient un déficit de 2,3 % du PIB.
Commerce de biens de la Tunisie avec ses 10 principaux partenaires commerciaux, selon la Tunisie
| Pays | Exportations vers | Importations depuis | Solde | |
|---|---|---|---|---|
 France |
4,33 Md $US | 2,67 Md $US | +1,66 Md $US | vs France |
 Italie |
3,75 Md $US | 3,10 Md $US | +644 M $US | vs Italie |
 Allemagne |
2,66 Md $US | 1,90 Md $US | +762 M $US | |
 Chine |
24,3 M $US | 2,94 Md $US | −2,91 Md $US | |
 Algérie |
545 M $US | 1,94 Md $US | −1,40 Md $US | vs Algérie |
 Espagne |
1,05 Md $US | 957 M $US | +97,5 M $US | vs Espagne |
 Russie |
20,0 M $US | 1,64 Md $US | −1,62 Md $US | |
 Turquie |
272 M $US | 1,22 Md $US | −949 M $US | vs Turquie |
 États-Unis |
649 M $US | 617 M $US | +32,2 M $US | |
 Libye |
790 M $US | 47,8 M $US | +743 M $US | vs Libye |
Balance commerciale de la Tunisie : excédent (+) ou déficit (−)
Comparer la balance commerciale de la Tunisie avec celle d'autres pays
Sources :
- TradeMap (2024, mis à jour en octobre 2026)
- Banque mondiale | Économie et croissance (1965–2025, mis à jour en octobre 2026)
Creative Commons Attribution (CC BY) : vous pouvez copier, partager, adapter et réutiliser ce contenu, y compris à des fins commerciales, à condition de citer statistics.wiki et d’indiquer les modifications apportées. Les sources citées ci-dessus peuvent avoir leurs propres conditions de licence.