
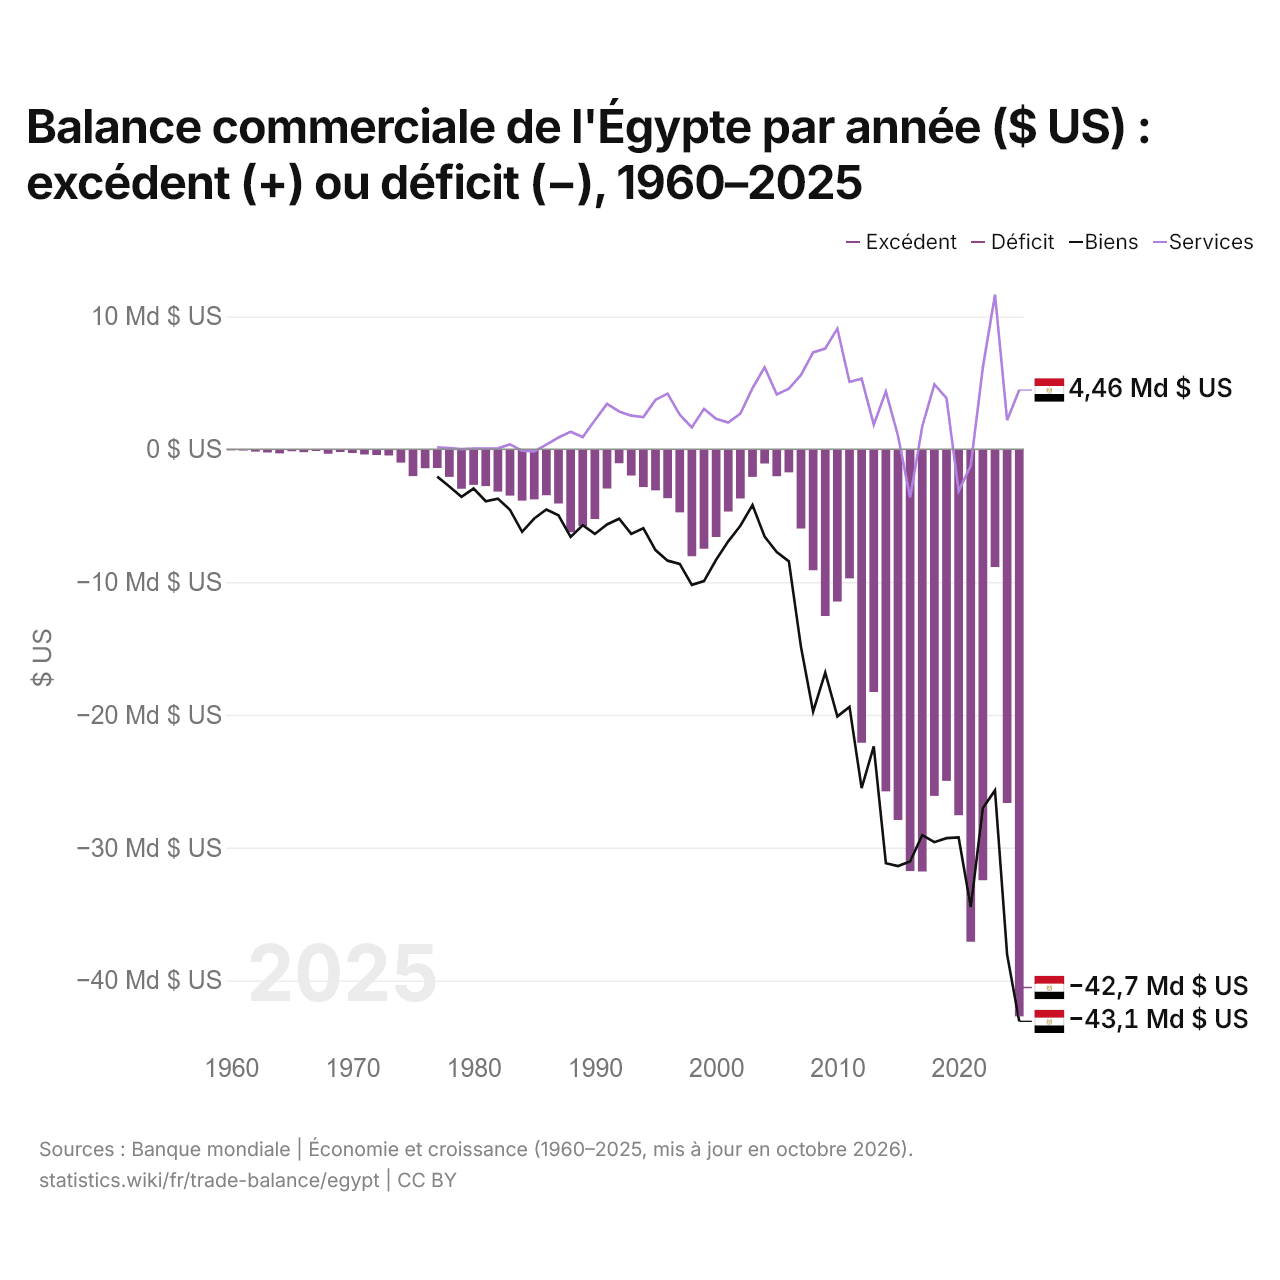
Balance commerciale de l'Égypte par année ($ US) : excédent (+) ou déficit (−), 1960–2025
| Année | $ US | ||
|---|---|---|---|
| Biens et services | Biens | Services | |
| 2025 | −42 713 939 257 $ US | −43 084 312 500 $ US | 4 462 612 500 $ US |
| 2024 | −26 643 864 063 $ US | −38 060 200 000 $ US | 2 190 400 000 $ US |
| 2023 | −8 861 688 958 $ US | −25 690 637 500 $ US | 11 643 337 500 $ US |
| 2022 | −32 462 006 079 $ US | −27 023 625 000 $ US | 6 175 319 000 $ US |
| 2021 | −37 093 690 249 $ US | −34 470 624 000 $ US | −1 228 941 000 $ US |
| 2020 | −27 560 823 456 $ US | −29 233 930 500 $ US | −3 146 762 500 $ US |
| 2019 | −24 971 526 196 $ US | −29 285 480 500 $ US | 3 857 287 500 $ US |
| 2018 | −26 105 796 286 $ US | −29 589 580 500 $ US | 4 880 987 500 $ US |
| 2017 | −31 800 271 739 $ US | −29 064 700 000 $ US | 1 715 300 000 $ US |
| 2016 | −31 766 871 166 $ US | −31 047 800 000 $ US | −3 629 300 000 $ US |
| 2015 | −27 924 528 302 $ US | −31 389 000 000 $ US | 1 019 600 000 $ US |
| 2014 | −25 767 575 323 $ US | −31 177 700 000 $ US | 4 348 000 000 $ US |
| 2013 | −18 279 069 767 $ US | −22 384 400 000 $ US | 1 853 800 000 $ US |
| 2012 | −22 100 000 000 $ US | −25 515 900 000 $ US | 5 316 400 000 $ US |
| 2011 | −9 724 612 737 $ US | −19 398 100 000 $ US | 5 070 000 000 $ US |
| 2010 | −11 470 054 446 $ US | −20 120 300 000 $ US | 9 089 300 000 $ US |
| 2009 | −12 558 983 666 $ US | −16 817 600 000 $ US | 7 584 600 000 $ US |
| 2008 | −9 109 090 909 $ US | −19 758 900 000 $ US | 7 297 000 000 $ US |
| 2007 | −5 971 978 984 $ US | −14 899 700 000 $ US | 5 601 000 000 $ US |
| 2006 | −1 739 130 435 $ US | −8 437 900 000 $ US | 4 565 300 000 $ US |
| 2005 | −2 031 302 031 $ US | −7 745 000 000 $ US | 4 134 500 000 $ US |
| 2004 | −1 071 428 571 $ US | −6 575 675 000 $ US | 6 176 575 000 $ US |
| 2003 | −2 076 923 077 $ US | −4 201 262 500 $ US | 4 599 162 500 $ US |
| 2002 | −3 707 865 169 $ US | −5 761 725 000 $ US | 2 691 225 000 $ US |
| 2001 | −4 690 026 954 $ US | −6 934 700 000 $ US | 2 005 800 000 $ US |
| 2000 | −6 605 019 815 $ US | −8 321 000 000 $ US | 2 290 000 000 $ US |
| 1999 | −7 490 415 807 $ US | −9 928 300 000 $ US | 3 042 200 000 $ US |
| 1998 | −8 057 851 240 $ US | −10 214 000 000 $ US | 1 649 000 000 $ US |
| 1997 | −4 749 262 537 $ US | −8 631 500 000 $ US | 2 610 100 000 $ US |
| 1996 | −3 685 141 509 $ US | −8 390 000 000 $ US | 4 187 000 000 $ US |
| 1995 | −3 096 431 731 $ US | −7 597 000 000 $ US | 3 717 000 000 $ US |
| 1994 | −2 846 975 089 $ US | −5 953 000 000 $ US | 2 425 000 000 $ US |
| 1993 | −1 980 792 317 $ US | −6 378 000 000 $ US | 2 528 000 000 $ US |
| 1992 | −1 053 170 042 $ US | −5 231 000 000 $ US | 2 849 000 000 $ US |
| 1991 | −2 957 793 287 $ US | −5 667 000 000 $ US | 3 419 000 000 $ US |
| 1990 | −5 248 990 579 $ US | −6 378 500 000 $ US | 2 183 000 000 $ US |
| 1989 | −5 782 734 407 $ US | −5 721 727 273 $ US | 919 909 091 $ US |
| 1988 | −6 246 450 880 $ US | −6 608 142 857 $ US | 1 325 285 714 $ US |
| 1987 | −4 084 838 963 $ US | −4 979 714 286 $ US | 885 000 000 $ US |
| 1986 | −3 461 178 672 $ US | −4 537 714 286 $ US | 345 714 286 $ US |
| 1985 | −3 769 238 823 $ US | −5 214 857 143 $ US | −166 428 571 $ US |
| 1984 | −3 870 135 455 $ US | −6 216 285 718 $ US | −106 285 714 $ US |
| 1983 | −3 492 433 062 $ US | −4 557 857 149 $ US | 365 571 429 $ US |
| 1982 | −3 190 147 783 $ US | −3 714 714 291 $ US | 72 714 286 $ US |
| 1981 | −2 775 135 135 $ US | −3 919 142 863 $ US | 49 714 286 $ US |
| 1980 | −2 677 048 662 $ US | −2 960 285 719 $ US | 49 428 571 $ US |
| 1979 | −2 969 571 429 $ US | −3 578 285 719 $ US | 15 142 857 $ US |
| 1978 | −2 078 532 444 $ US | −2 803 695 334 $ US | 84 844 303 $ US |
| 1977 | −1 408 349 412 $ US | −2 064 374 342 $ US | 152 821 968 $ US |
| 1976 | −1 431 578 947 $ US | - | - |
| 1975 | −2 021 481 806 $ US | - | - |
| 1974 | −1 008 726 366 $ US | - | - |
| 1973 | −467 155 129 $ US | - | - |
| 1972 | −433 815 926 $ US | - | - |
| 1971 | −390 971 691 $ US | - | - |
| 1970 | −283 597 086 $ US | - | - |
| 1969 | −200 968 523 $ US | - | - |
| 1968 | −335 981 308 $ US | - | - |
| 1967 | −128 261 831 $ US | - | - |
| 1966 | −219 080 509 $ US | - | - |
| 1965 | −148 536 479 $ US | - | - |
| 1964 | −304 979 726 $ US | - | - |
| 1963 | −244 029 780 $ US | - | - |
| 1962 | −180 227 398 $ US | - | - |
| 1961 | −94 187 375 $ US | - | - |
| 1960 | −82 413 954 $ US | - | - |
En 2025, la balance commerciale de l'Égypte affichait un déficit de 42,7 milliards de dollars, contre un déficit de 82,4 millions de dollars en 1960. La balance commerciale de l'Égypte est déficitaire chaque année depuis 1960.
En 2025, le déficit commercial de l'Égypte était le plus élevé de 50 pays situés en Afrique, devant le Maroc (déficit de 16,7 milliards de dollars). De 2016 à 2025, les soldes commerciaux de l'Égypte ont totalisé un déficit de 290 milliards de dollars, contre un déficit de 145 milliards de dollars de 2006 à 2015. En 2025, les transactions courantes de l'Égypte affichaient un déficit de 3,8 % du PIB.
Commerce de biens de l'Égypte avec ses 10 principaux partenaires commerciaux, selon l'Égypte, 2025
| Pays | Exportations vers | Importations depuis | Solde | |
|---|---|---|---|---|
 Chine |
491 M $US | 18,8 Md $US | −18,3 Md $US | |
 États-Unis |
2,71 Md $US | 12,8 Md $US | −10,1 Md $US | |
 Arabie saoudite |
2,98 Md $US | 9,45 Md $US | −6,47 Md $US | vs Arabie saoudite |
 EAU |
7,03 Md $US | 2,64 Md $US | +4,39 Md $US | vs EAU |
 Turquie |
3,30 Md $US | 3,66 Md $US | −362 M $US | vs Turquie |
 Italie |
4,04 Md $US | 2,90 Md $US | +1,15 Md $US | vs Italie |
 Russie |
811 M $US | 5,19 Md $US | −4,38 Md $US | |
 Allemagne |
1,25 Md $US | 4,35 Md $US | −3,10 Md $US | vs Allemagne |
 Brésil |
1,12 Md $US | 4,34 Md $US | −3,22 Md $US | |
 Inde |
642 M $US | 3,63 Md $US | −2,99 Md $US | vs Inde |
Balance commerciale de l'Égypte : excédent (+) ou déficit (−)
| Biens et services, $ US, 2025 | −42,7 Md $US |
|---|---|
| % du PIB, 2025 | −11,7 % |
| Années d'excédent, 2000–2025 | 0 |
| Biens, $ US, 2025 | −43,1 Md $US |
| Services, $ US, 2025 | +4,46 Md $US |
| Premier excédent en biens, 2025 | Émirats arabes unis +4,39 Md $US |
| Premier déficit en biens, 2025 | Chine −18,3 Md $US |
Comparer la balance commerciale de l'Égypte avec celle d'autres pays
Sources :
- TradeMap (2025, mis à jour en octobre 2026)
- Banque mondiale | Économie et croissance (1960–2025, mis à jour en octobre 2026)
Creative Commons Attribution (CC BY) : vous pouvez copier, partager, adapter et réutiliser ce contenu, y compris à des fins commerciales, à condition de citer statistics.wiki et d’indiquer les modifications apportées. Les sources citées ci-dessus peuvent avoir leurs propres conditions de licence.