
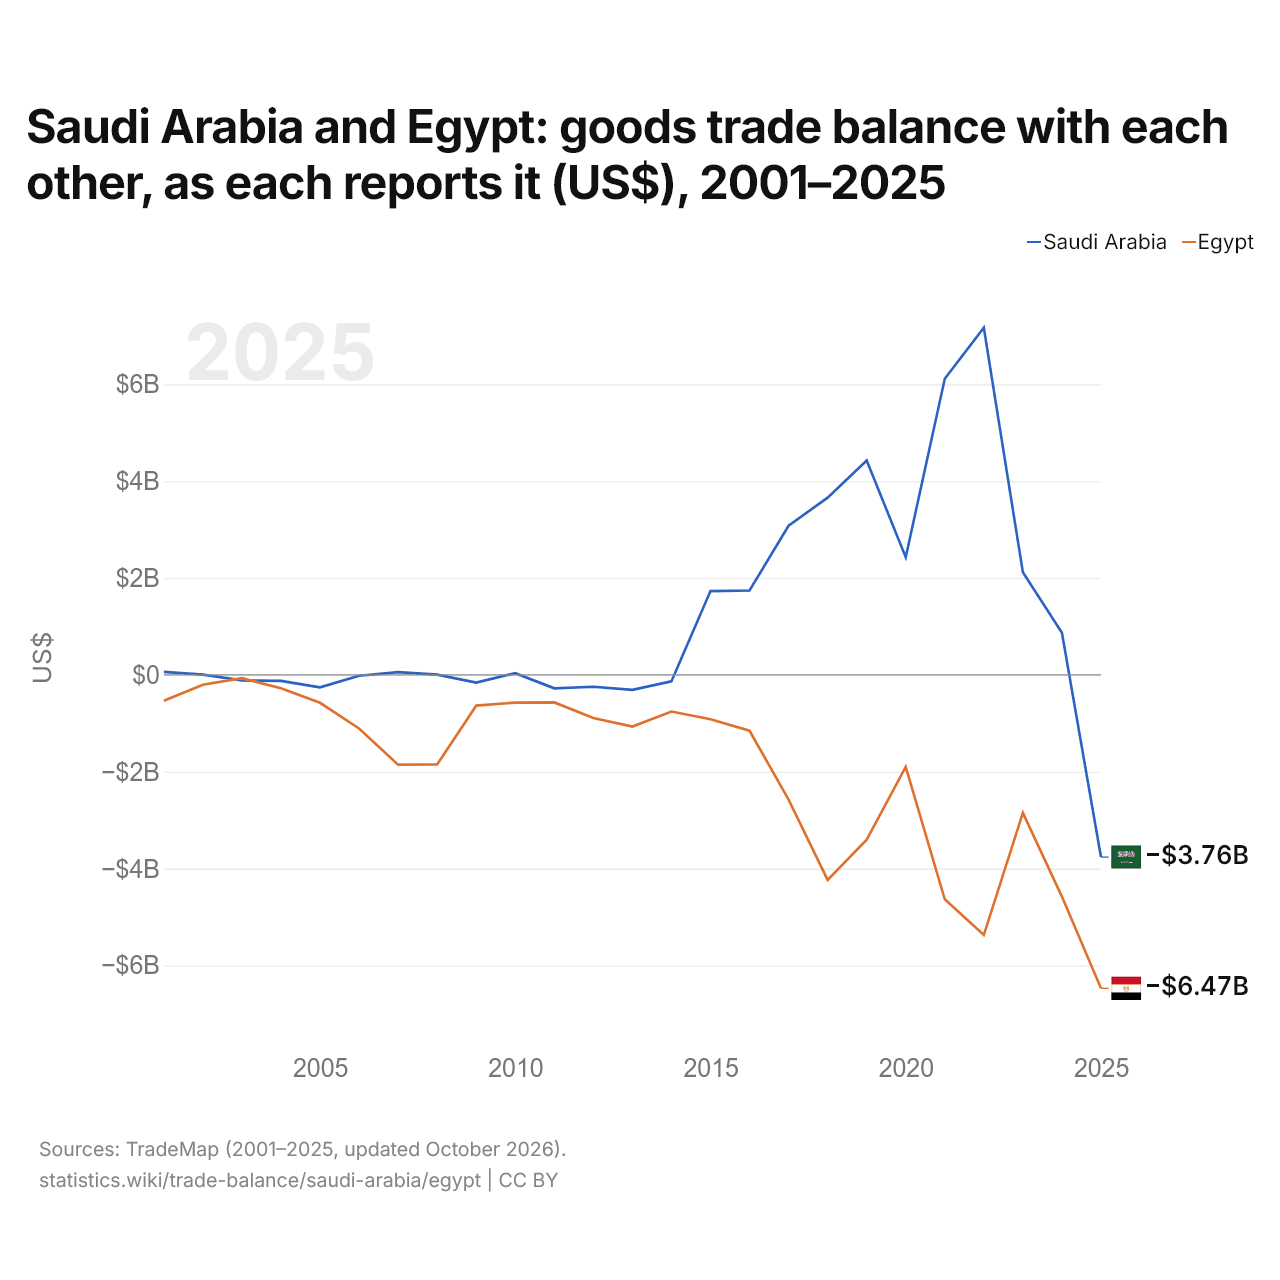
L'Arabie saoudite et l'Égypte : solde de leur commerce de biens bilatéral, selon chacun ($ US), 2001–2025
| Année | $ US | |
|---|---|---|
| Arabie saoudite | Égypte | |
| 2025 | −3 761 370 000 $ US | −6 471 400 000 $ US |
| 2024 | 870 043 000 $ US | −4 577 405 000 $ US |
| 2023 | 2 118 607 000 $ US | −2 849 141 000 $ US |
| 2022 | 7 168 854 000 $ US | −5 369 900 000 $ US |
| 2021 | 6 114 270 000 $ US | −4 634 712 000 $ US |
| 2020 | 2 430 504 000 $ US | −1 901 176 000 $ US |
| 2019 | 4 425 997 000 $ US | −3 400 884 000 $ US |
| 2018 | 3 660 145 000 $ US | −4 234 639 000 $ US |
| 2017 | 3 079 363 000 $ US | −2 576 967 000 $ US |
| 2016 | 1 742 696 000 $ US | −1 153 029 000 $ US |
| 2015 | 1 730 793 000 $ US | −914 963 000 $ US |
| 2014 | −130 626 000 $ US | −756 709 000 $ US |
| 2013 | −307 560 000 $ US | −1 067 286 000 $ US |
| 2012 | −244 955 000 $ US | −889 563 000 $ US |
| 2011 | −277 407 000 $ US | −568 701 000 $ US |
| 2010 | 34 576 000 $ US | −571 146 000 $ US |
| 2009 | −160 455 000 $ US | −634 658 000 $ US |
| 2008 | 5 664 000 $ US | −1 848 865 000 $ US |
| 2007 | 57 280 000 $ US | −1 854 370 000 $ US |
| 2006 | −16 778 000 $ US | −1 106 632 000 $ US |
| 2005 | −256 204 000 $ US | −576 252 000 $ US |
| 2004 | −122 641 000 $ US | −275 955 000 $ US |
| 2003 | −114 119 000 $ US | −67 750 000 $ US |
| 2002 | 4 422 000 $ US | −202 043 000 $ US |
| 2001 | 61 069 000 $ US | −531 792 000 $ US |
En 2025, selon l'Arabie saoudite, son commerce de biens avec l'Égypte affichait un déficit de 3,76 milliards de dollars ; selon l'Égypte, son commerce de biens avec l'Arabie saoudite affichait un déficit de 6,47 milliards de dollars. En 2001, les chiffres étaient un excédent de 61,1 millions de dollars pour l'Arabie saoudite et un déficit de 532 millions de dollars pour l'Égypte.
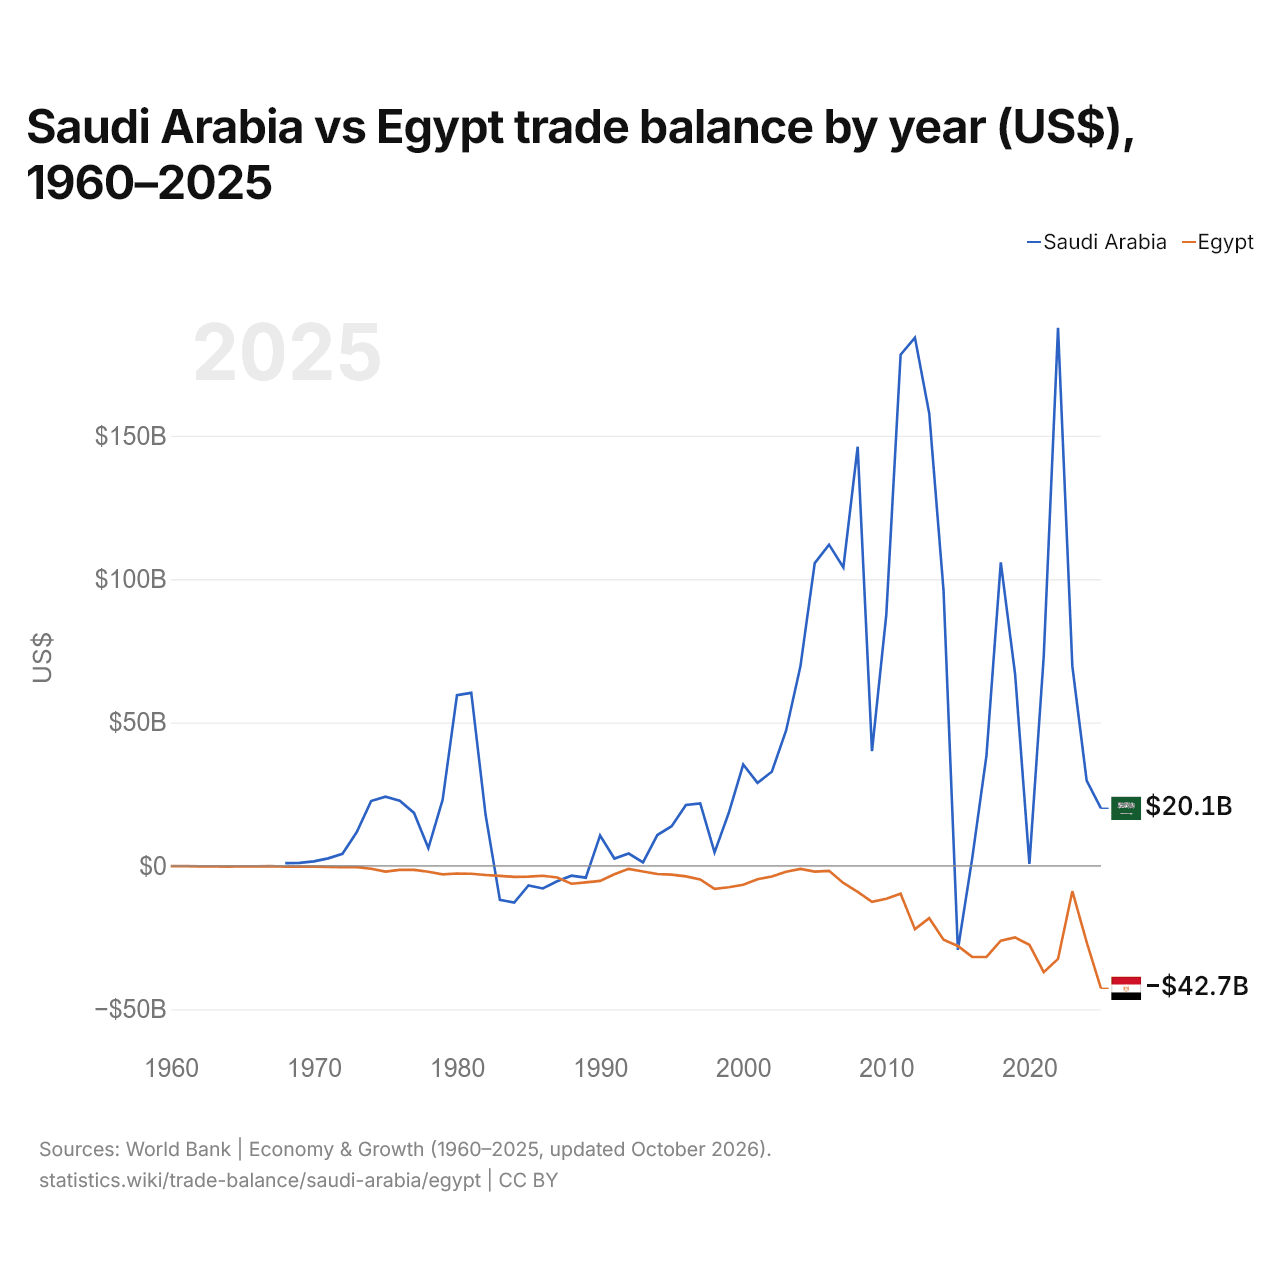
Arabie saoudite vs Égypte : balance commerciale par année ($ US), 1960–2025
| Année | $ US | |
|---|---|---|
 Arabie saoudite |
 Égypte |
|
| 2025 | 20 067 466 667 $ US | −42 713 939 257 $ US |
| 2024 | 29 736 533 333 $ US | −26 643 864 063 $ US |
| 2023 | 69 635 466 667 $ US | −8 861 688 958 $ US |
| 2022 | 187 668 533 333 $ US | −32 462 006 079 $ US |
| 2021 | 72 986 133 333 $ US | −37 093 690 249 $ US |
| 2020 | 664 000 000 $ US | −27 560 823 456 $ US |
| 2019 | 66 885 333 333 $ US | −24 971 526 196 $ US |
| 2018 | 105 847 466 667 $ US | −26 105 796 286 $ US |
| 2017 | 38 494 666 667 $ US | −31 800 271 739 $ US |
| 2016 | 2 512 533 333 $ US | −31 766 871 166 $ US |
| 2015 | −29 296 800 000 $ US | −27 924 528 302 $ US |
| 2014 | 95 966 400 000 $ US | −25 767 575 323 $ US |
| 2013 | 157 750 133 333 $ US | −18 279 069 767 $ US |
| 2012 | 184 213 333 333 $ US | −22 100 000 000 $ US |
| 2011 | 178 246 400 000 $ US | −9 724 612 737 $ US |
| 2010 | 87 628 266 667 $ US | −11 470 054 446 $ US |
| 2009 | 39 987 200 000 $ US | −12 558 983 666 $ US |
| 2008 | 146 168 800 000 $ US | −9 109 090 909 $ US |
| 2007 | 104 039 226 151 $ US | −5 971 978 984 $ US |
| 2006 | 112 011 748 999 $ US | −1 739 130 435 $ US |
| 2005 | 105 591 257 239 $ US | −2 031 302 031 $ US |
| 2004 | 69 570 133 333 $ US | −1 071 428 571 $ US |
| 2003 | 47 212 533 333 $ US | −2 076 923 077 $ US |
| 2002 | 32 810 933 333 $ US | −3 707 865 169 $ US |
| 2001 | 28 922 133 333 $ US | −4 690 026 954 $ US |
| 2000 | 35 333 333 333 $ US | −6 605 019 815 $ US |
| 1999 | 18 576 266 667 $ US | −7 490 415 807 $ US |
| 1998 | 4 662 133 333 $ US | −8 057 851 240 $ US |
| 1997 | 21 789 586 115 $ US | −4 749 262 537 $ US |
| 1996 | 21 247 797 063 $ US | −3 685 141 509 $ US |
| 1995 | 13 809 612 817 $ US | −3 096 431 731 $ US |
| 1994 | 10 720 160 214 $ US | −2 846 975 089 $ US |
| 1993 | 1 194 926 569 $ US | −1 980 792 317 $ US |
| 1992 | 4 279 305 741 $ US | −1 053 170 042 $ US |
| 1991 | 2 535 380 507 $ US | −2 957 793 287 $ US |
| 1990 | 10 541 522 029 $ US | −5 248 990 579 $ US |
| 1989 | −4 130 040 053 $ US | −5 782 734 407 $ US |
| 1988 | −3 423 497 997 $ US | −6 246 450 880 $ US |
| 1987 | −5 373 831 776 $ US | −4 084 838 963 $ US |
| 1986 | −7 899 000 810 $ US | −3 461 178 672 $ US |
| 1985 | −6 827 443 401 $ US | −3 769 238 823 $ US |
| 1984 | −12 800 510 783 $ US | −3 870 135 455 $ US |
| 1983 | −11 894 066 570 $ US | −3 492 433 062 $ US |
| 1982 | 17 796 370 134 $ US | −3 190 147 783 $ US |
| 1981 | 60 310 278 645 $ US | −2 775 135 135 $ US |
| 1980 | 59 490 035 596 $ US | −2 677 048 662 $ US |
| 1979 | 23 056 756 397 $ US | −2 969 571 429 $ US |
| 1978 | 6 195 798 165 $ US | −2 078 532 444 $ US |
| 1977 | 18 443 064 170 $ US | −1 408 349 412 $ US |
| 1976 | 22 707 932 011 $ US | −1 431 578 947 $ US |
| 1975 | 24 135 407 771 $ US | −2 021 481 806 $ US |
| 1974 | 22 585 633 803 $ US | −1 008 726 366 $ US |
| 1973 | 11 776 865 468 $ US | −467 155 129 $ US |
| 1972 | 4 185 774 158 $ US | −433 815 926 $ US |
| 1971 | 2 591 362 408 $ US | −390 971 691 $ US |
| 1970 | 1 572 222 222 $ US | −283 597 086 $ US |
| 1969 | 1 042 836 022 $ US | −200 968 523 $ US |
| 1968 | 963 960 711 $ US | −335 981 308 $ US |
| 1967 | - | −128 261 831 $ US |
| 1966 | - | −219 080 509 $ US |
| 1965 | - | −148 536 479 $ US |
| 1964 | - | −304 979 726 $ US |
| 1963 | - | −244 029 780 $ US |
| 1962 | - | −180 227 398 $ US |
| 1961 | - | −94 187 375 $ US |
| 1960 | - | −82 413 954 $ US |
En 2025, la balance commerciale de l'Arabie saoudite affichait un excédent de 20,1 milliards de dollars et celle de l'Égypte un déficit de 42,7 milliards de dollars. En 1968, la balance commerciale de l'Arabie saoudite affichait un excédent de 964 millions de dollars et celle de l'Égypte un déficit de 336 millions de dollars.
De 1968 à 2025, la balance commerciale de l'Arabie saoudite a été excédentaire pendant 50 des 58 années, et celle de l'Égypte pendant aucune. Les balances commerciales de l'Arabie saoudite et de l'Égypte ont été déficitaires en même temps pendant 8 de ces années, la dernière fois en 2015.
Arabie saoudite vs Égypte : chiffres de la balance commerciale
|
Arabie saoudite
|
Égypte
|
|
|---|---|---|
| Biens et services, $ US | +20,1 Md $US (2025) | −42,7 Md $US (2025) |
| % du PIB | +1,6 % (2025) | −11,7 % (2025) |
| Années d'excédent depuis 2000 | 25 sur 26 | 0 sur 26 |
| Solde des biens entre les deux, chiffres propres | −3,76 Md $US (2025) | −6,47 Md $US (2025) |
| Premier excédent en biens avec | Émirats arabes unis (+14,2 Md $US, 2025) | Émirats arabes unis (+4,39 Md $US, 2025) |
| Premier déficit en biens avec | Chine (−61,7 Md $US, 2025) | Chine (−18,3 Md $US, 2025) |
Comparer la balance commerciale de 2 pays au choix
Sources :
- Banque mondiale | Économie et croissance (1960–2025, mis à jour en octobre 2026)
- TradeMap (2001–2025, mis à jour en octobre 2026)
Creative Commons Attribution (CC BY) : vous pouvez copier, partager, adapter et réutiliser ce contenu, y compris à des fins commerciales, à condition de citer statistics.wiki et d’indiquer les modifications apportées. Les sources citées ci-dessus peuvent avoir leurs propres conditions de licence.