
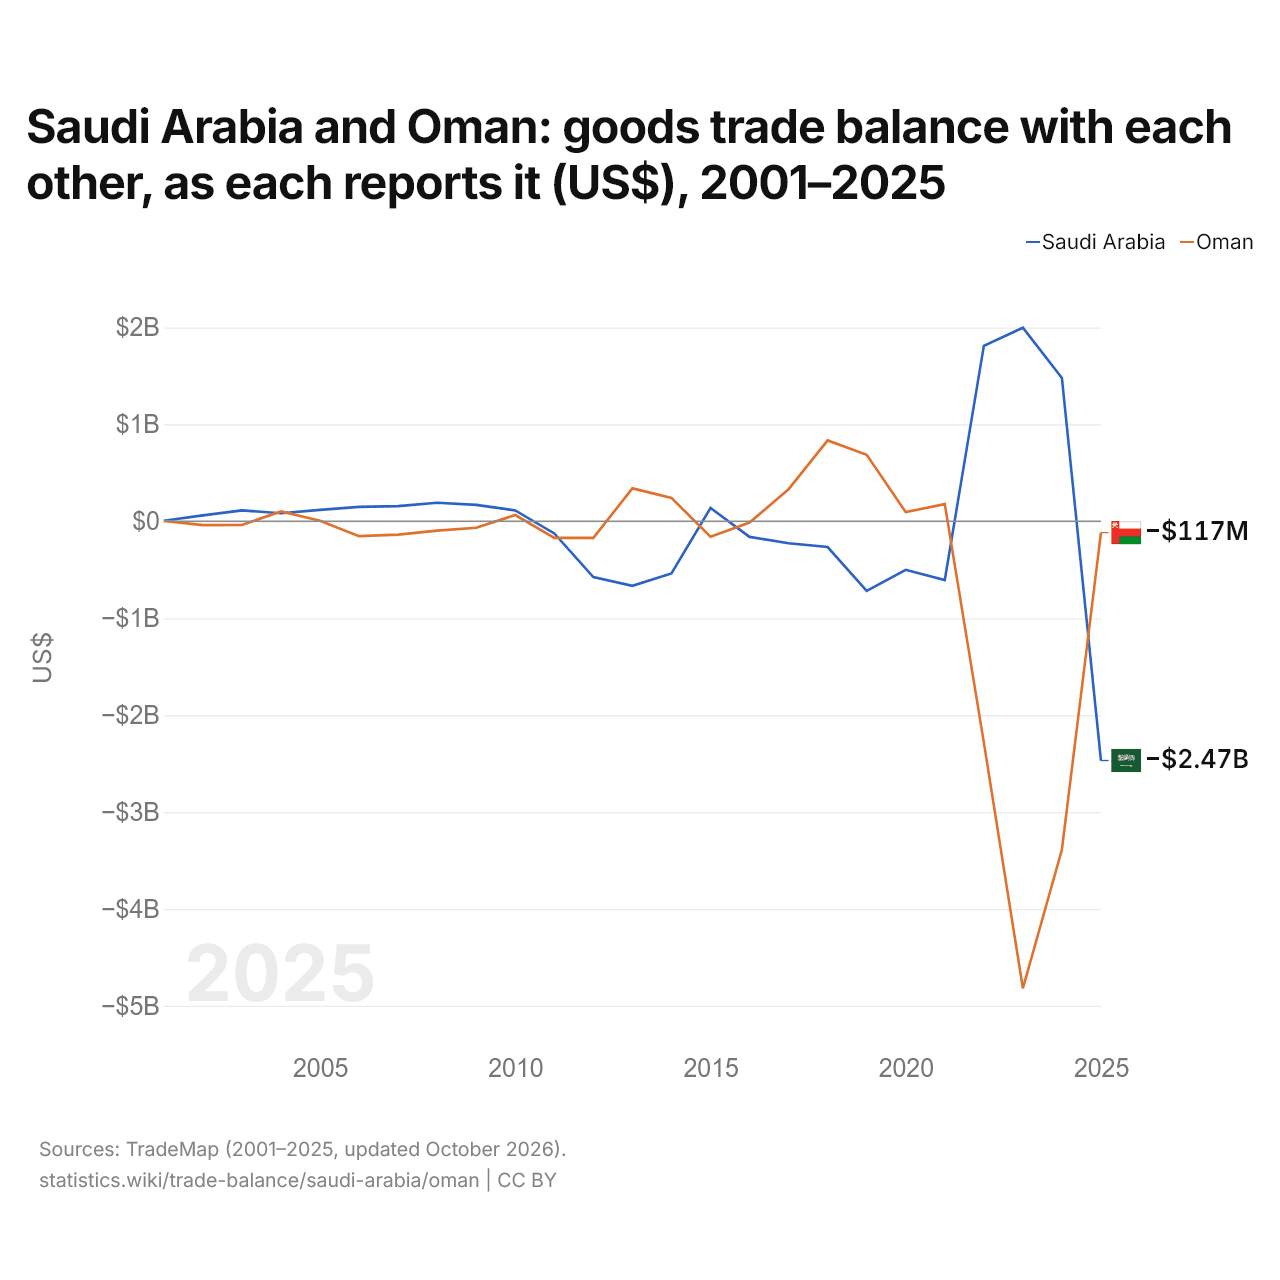
L'Arabie saoudite et Oman : solde de leur commerce de biens bilatéral, selon chacun ($ US), 2001–2025
| Année | $ US | |
|---|---|---|
| Arabie saoudite | Oman | |
| 2025 | −2 468 990 000 $ US | −117 425 000 $ US |
| 2024 | 1 478 278 000 $ US | −3 387 548 000 $ US |
| 2023 | 1 997 587 000 $ US | −4 819 554 000 $ US |
| 2022 | 1 810 399 000 $ US | −2 281 686 000 $ US |
| 2021 | −606 510 000 $ US | 177 170 000 $ US |
| 2020 | −500 902 000 $ US | 94 173 000 $ US |
| 2019 | −718 200 000 $ US | 686 148 000 $ US |
| 2018 | −265 965 000 $ US | 834 691 000 $ US |
| 2017 | −226 638 000 $ US | 331 022 000 $ US |
| 2016 | −161 730 000 $ US | −13 778 000 $ US |
| 2015 | 136 769 000 $ US | −159 097 000 $ US |
| 2014 | −538 510 000 $ US | 241 312 000 $ US |
| 2013 | −666 463 000 $ US | 339 673 000 $ US |
| 2012 | −575 828 000 $ US | −171 534 000 $ US |
| 2011 | −125 755 000 $ US | −171 023 000 $ US |
| 2010 | 111 559 000 $ US | 64 345 000 $ US |
| 2009 | 168 767 000 $ US | −66 814 000 $ US |
| 2008 | 191 208 000 $ US | −95 987 000 $ US |
| 2007 | 156 209 000 $ US | −137 711 000 $ US |
| 2006 | 149 127 000 $ US | −153 725 000 $ US |
| 2005 | 116 910 000 $ US | 5 073 000 $ US |
| 2004 | 83 161 000 $ US | 101 896 000 $ US |
| 2003 | 112 996 000 $ US | −38 189 000 $ US |
| 2002 | 60 484 000 $ US | −39 518 000 $ US |
| 2001 | 5 608 000 $ US | 3 698 000 $ US |
En 2025, selon l'Arabie saoudite, son commerce de biens avec Oman affichait un déficit de 2,47 milliards de dollars ; selon Oman, son commerce de biens avec l'Arabie saoudite affichait un déficit de 117 millions de dollars. En 2001, les chiffres étaient un excédent de 5,61 millions de dollars pour l'Arabie saoudite et un excédent de 3,7 millions de dollars pour Oman.
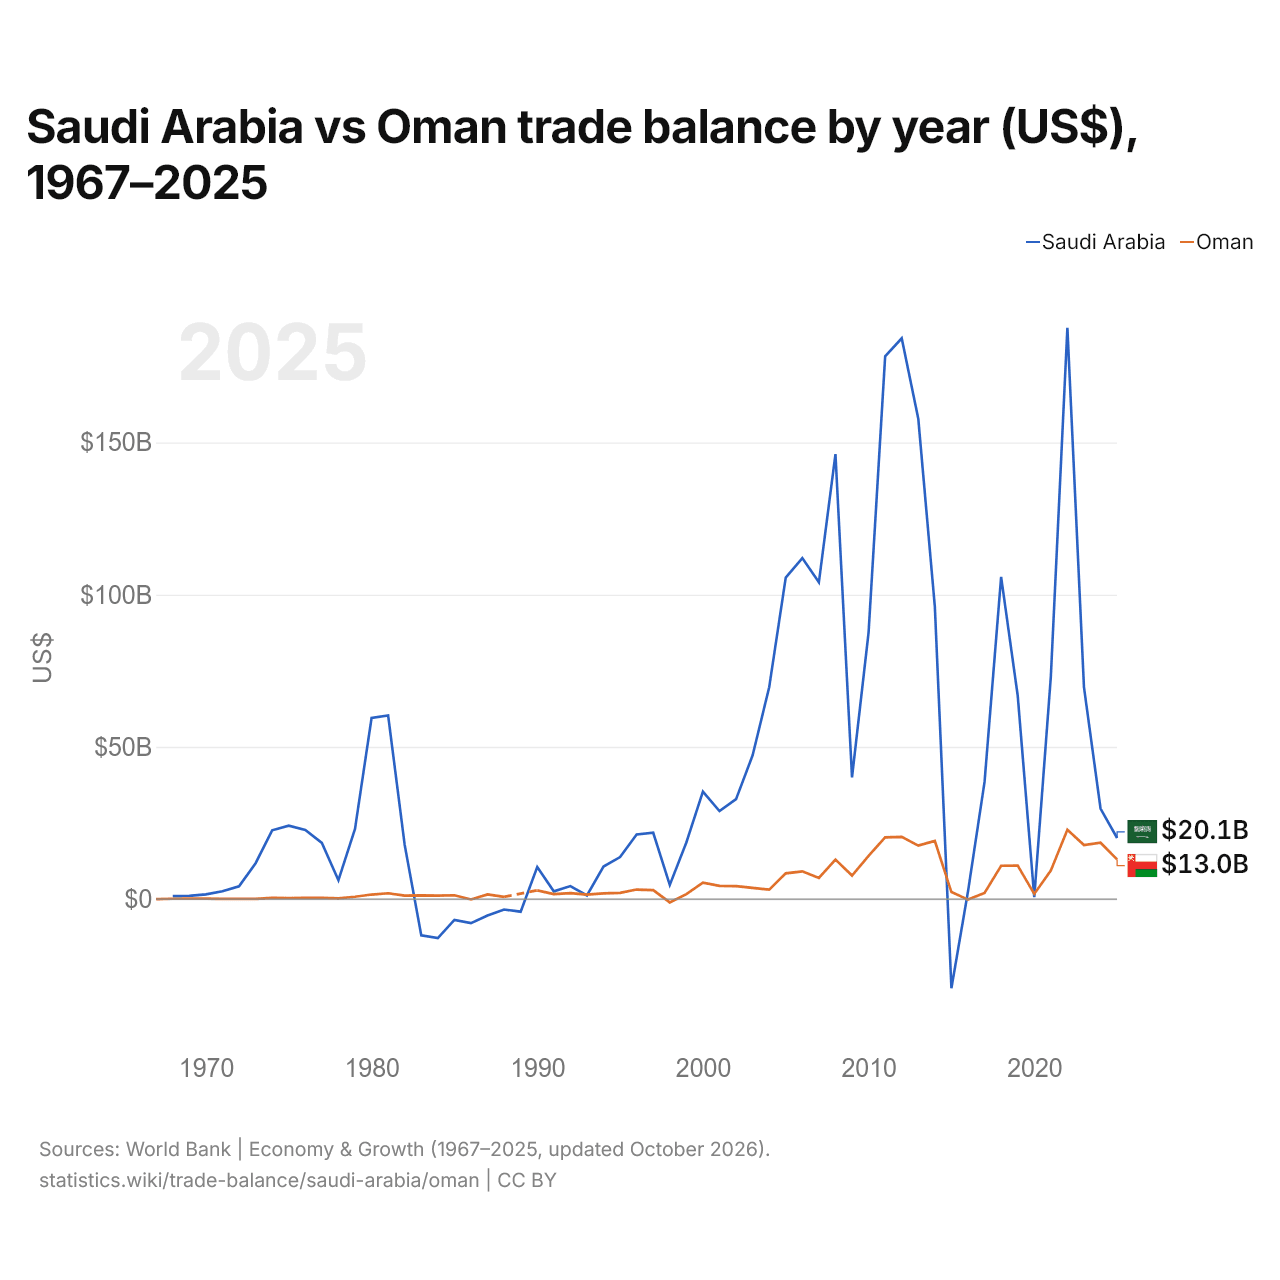
Arabie saoudite vs Oman : balance commerciale par année ($ US), 1967–2025
| Année | $ US | |
|---|---|---|
 Arabie saoudite |
 Oman |
|
| 2025 | 20 067 466 667 $ US | 13 042 219 713 $ US |
| 2024 | 29 736 533 333 $ US | 18 526 657 997 $ US |
| 2023 | 69 635 466 667 $ US | 17 754 486 346 $ US |
| 2022 | 187 668 533 333 $ US | 22 801 040 312 $ US |
| 2021 | 72 986 133 333 $ US | 9 352 405 722 $ US |
| 2020 | 664 000 000 $ US | 1 695 708 713 $ US |
| 2019 | 66 885 333 333 $ US | 11 014 304 291 $ US |
| 2018 | 105 847 466 667 $ US | 10 949 284 785 $ US |
| 2017 | 38 494 666 667 $ US | 2 005 201 560 $ US |
| 2016 | 2 512 533 333 $ US | −169 050 715 $ US |
| 2015 | −29 296 800 000 $ US | 2 304 291 287 $ US |
| 2014 | 95 966 400 000 $ US | 19 097 529 259 $ US |
| 2013 | 157 750 133 333 $ US | 17 555 266 580 $ US |
| 2012 | 184 213 333 333 $ US | 20 426 527 958 $ US |
| 2011 | 178 246 400 000 $ US | 20 299 089 727 $ US |
| 2010 | 87 628 266 667 $ US | 14 171 651 495 $ US |
| 2009 | 39 987 200 000 $ US | 7 737 321 196 $ US |
| 2008 | 146 168 800 000 $ US | 12 972 691 808 $ US |
| 2007 | 104 039 226 151 $ US | 6 938 881 664 $ US |
| 2006 | 112 011 748 999 $ US | 9 120 936 281 $ US |
| 2005 | 105 591 257 239 $ US | 8 460 338 101 $ US |
| 2004 | 69 570 133 333 $ US | 3 097 529 259 $ US |
| 2003 | 47 212 533 333 $ US | 3 669 700 910 $ US |
| 2002 | 32 810 933 333 $ US | 4 267 880 364 $ US |
| 2001 | 28 922 133 333 $ US | 4 351 105 332 $ US |
| 2000 | 35 333 333 333 $ US | 5 420 026 008 $ US |
| 1999 | 18 576 266 667 $ US | 1 635 890 767 $ US |
| 1998 | 4 662 133 333 $ US | −1 094 928 479 $ US |
| 1997 | 21 789 586 115 $ US | 2 928 478 544 $ US |
| 1996 | 21 247 797 063 $ US | 3 139 141 743 $ US |
| 1995 | 13 809 612 817 $ US | 2 065 019 506 $ US |
| 1994 | 10 720 160 214 $ US | 1 880 364 109 $ US |
| 1993 | 1 194 926 569 $ US | 1 495 448 635 $ US |
| 1992 | 4 279 305 741 $ US | 1 950 585 176 $ US |
| 1991 | 2 535 380 507 $ US | 1 661 898 570 $ US |
| 1990 | 10 541 522 029 $ US | 2 881 664 499 $ US |
| 1989 | −4 130 040 053 $ US | - |
| 1988 | −3 423 497 997 $ US | 725 617 685 $ US |
| 1987 | −5 373 831 776 $ US | 1 547 464 499 $ US |
| 1986 | −7 899 000 810 $ US | −123 042 185 $ US |
| 1985 | −6 827 443 401 $ US | 1 265 218 373 $ US |
| 1984 | −12 800 510 783 $ US | 1 120 450 091 $ US |
| 1983 | −11 894 066 570 $ US | 1 236 247 829 $ US |
| 1982 | 17 796 370 134 $ US | 1 162 999 421 $ US |
| 1981 | 60 310 278 645 $ US | 1 930 804 574 $ US |
| 1980 | 59 490 035 596 $ US | 1 495 656 630 $ US |
| 1979 | 23 056 756 397 $ US | 759 698 900 $ US |
| 1978 | 6 195 798 165 $ US | 262 883 903 $ US |
| 1977 | 18 443 064 170 $ US | 390 851 477 $ US |
| 1976 | 22 707 932 011 $ US | 418 934 279 $ US |
| 1975 | 24 135 407 771 $ US | 353 502 316 $ US |
| 1974 | 22 585 633 803 $ US | 427 331 210 $ US |
| 1973 | 11 776 865 468 $ US | 61 024 992 $ US |
| 1972 | 4 185 774 158 $ US | 57 325 554 $ US |
| 1971 | 2 591 362 408 $ US | 101 299 326 $ US |
| 1970 | 1 572 222 222 $ US | 138 479 889 $ US |
| 1969 | 1 042 836 022 $ US | 150 479 880 $ US |
| 1968 | 963 960 711 $ US | 104 639 916 $ US |
| 1967 | - | 12 151 239 $ US |
En 2025, la balance commerciale de l'Arabie saoudite affichait un excédent de 20,1 milliards de dollars et celle d'Oman un excédent de 13 milliards de dollars ; l'excédent de l'Arabie saoudite était 1,5 fois plus grand. En 1968, la balance commerciale de l'Arabie saoudite affichait un excédent de 964 millions de dollars et celle d'Oman un excédent de 105 millions de dollars.
Sur les années de 1968 à 2025 que les deux pays ont communiquées, la balance commerciale de l'Arabie saoudite a été excédentaire pendant 50 des 57 années, et celle d'Oman pendant 54. Les balances commerciales de l'Arabie saoudite et d'Oman n'ont été déficitaires en même temps qu'une seule de ces années, en 1986.
Arabie saoudite vs Oman : chiffres de la balance commerciale
|
Arabie saoudite
|
Oman
|
|
|---|---|---|
| Biens et services, $ US | +20,1 Md $US (2025) | +13,0 Md $US (2025) |
| % du PIB | +1,6 % (2025) | +11,9 % (2025) |
| Années d'excédent depuis 2000 | 25 sur 26 | 25 sur 26 |
| Solde des biens entre les deux, chiffres propres | −2,47 Md $US (2025) | −117 M $US (2025) |
| Premier excédent en biens avec | Émirats arabes unis (+14,2 Md $US, 2025) | Corée du Sud (+708 M $US, 2025) |
| Premier déficit en biens avec | Chine (−61,7 Md $US, 2025) | Chine (−5,89 Md $US, 2025) |
Comparer la balance commerciale de 2 pays au choix
Sources :
- Banque mondiale | Économie et croissance (1967–2025, mis à jour en octobre 2026)
- TradeMap (2001–2025, mis à jour en octobre 2026)
Creative Commons Attribution (CC BY) : vous pouvez copier, partager, adapter et réutiliser ce contenu, y compris à des fins commerciales, à condition de citer statistics.wiki et d’indiquer les modifications apportées. Les sources citées ci-dessus peuvent avoir leurs propres conditions de licence.