
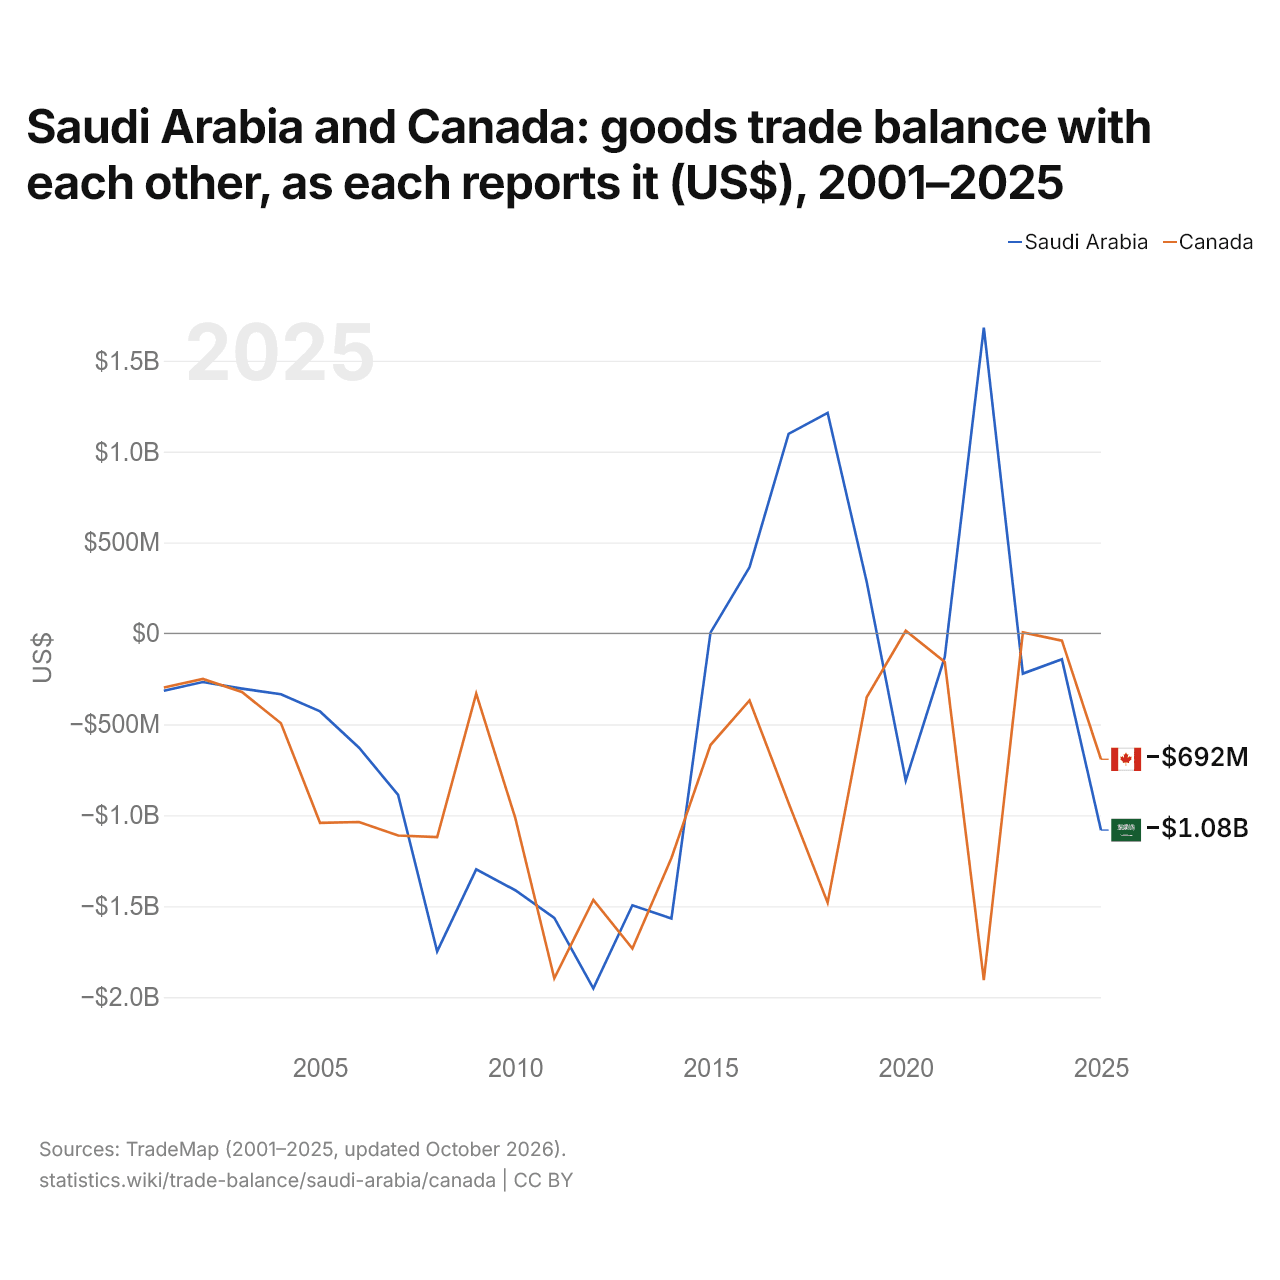
L'Arabie saoudite et le Canada : solde de leur commerce de biens bilatéral, selon chacun ($ US), 2001–2025
| Année | $ US | |
|---|---|---|
| Arabie saoudite | Canada | |
| 2025 | −1 081 824 000 $ US | −692 293 000 $ US |
| 2024 | −142 563 000 $ US | −39 588 000 $ US |
| 2023 | −220 994 000 $ US | 5 369 000 $ US |
| 2022 | 1 681 292 000 $ US | −1 906 944 000 $ US |
| 2021 | −128 888 000 $ US | −157 691 000 $ US |
| 2020 | −808 769 000 $ US | 14 584 000 $ US |
| 2019 | 284 235 000 $ US | −351 696 000 $ US |
| 2018 | 1 212 716 000 $ US | −1 480 974 000 $ US |
| 2017 | 1 097 447 000 $ US | −932 238 000 $ US |
| 2016 | 364 029 000 $ US | −368 452 000 $ US |
| 2015 | 4 368 000 $ US | −613 915 000 $ US |
| 2014 | −1 568 071 000 $ US | −1 234 859 000 $ US |
| 2013 | −1 495 227 000 $ US | −1 733 532 000 $ US |
| 2012 | −1 951 922 000 $ US | −1 465 093 000 $ US |
| 2011 | −1 564 231 000 $ US | −1 896 812 000 $ US |
| 2010 | −1 412 353 000 $ US | −1 014 982 000 $ US |
| 2009 | −1 298 088 000 $ US | −331 542 000 $ US |
| 2008 | −1 749 180 000 $ US | −1 120 491 000 $ US |
| 2007 | −888 746 000 $ US | −1 111 763 000 $ US |
| 2006 | −628 411 000 $ US | −1 037 420 000 $ US |
| 2005 | −428 901 000 $ US | −1 041 742 000 $ US |
| 2004 | −334 955 000 $ US | −494 097 000 $ US |
| 2003 | −303 470 000 $ US | −322 249 000 $ US |
| 2002 | −267 524 000 $ US | −250 271 000 $ US |
| 2001 | −315 428 000 $ US | −297 565 000 $ US |
En 2025, selon l'Arabie saoudite, son commerce de biens avec le Canada affichait un déficit de 1,08 milliard de dollars ; selon le Canada, son commerce de biens avec l'Arabie saoudite affichait un déficit de 692 millions de dollars. En 2001, les chiffres étaient un déficit de 315 millions de dollars pour l'Arabie saoudite et un déficit de 298 millions de dollars pour le Canada.
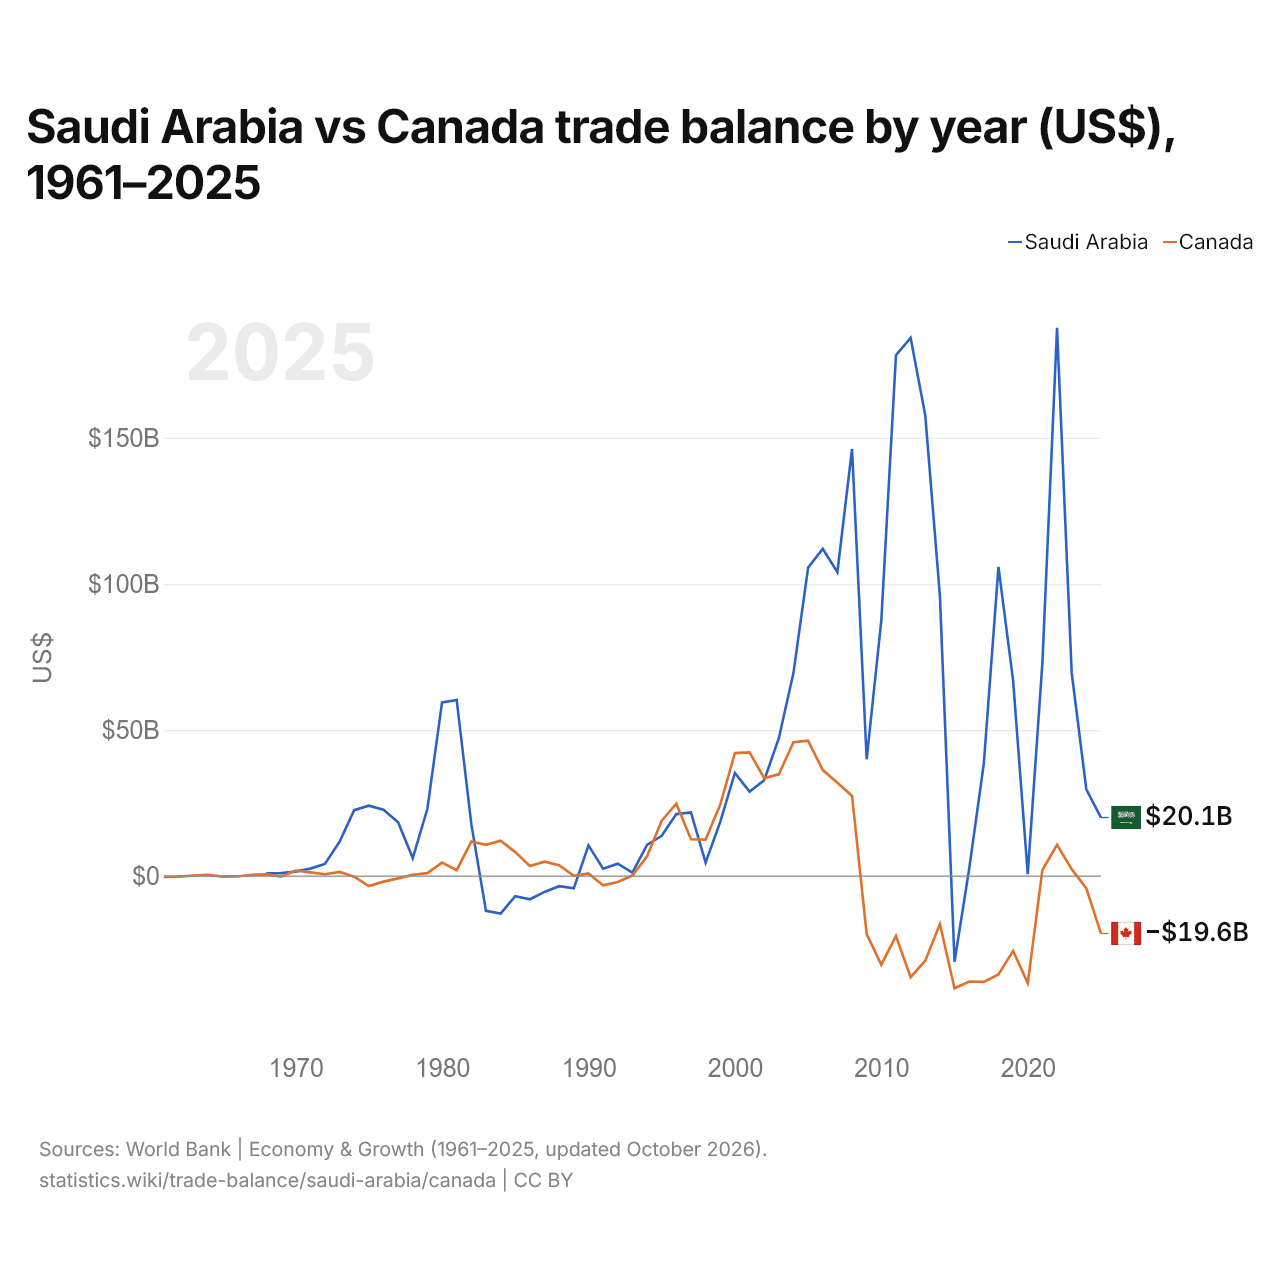
Arabie saoudite vs Canada : balance commerciale par année ($ US), 1961–2025
| Année | $ US | |
|---|---|---|
 Arabie saoudite |
 Canada |
|
| 2025 | 20 067 466 667 $ US | −19 620 119 427 $ US |
| 2024 | 29 736 533 333 $ US | −4 160 338 387 $ US |
| 2023 | 69 635 466 667 $ US | 2 389 050 564 $ US |
| 2022 | 187 668 533 333 $ US | 10 766 354 419 $ US |
| 2021 | 72 986 133 333 $ US | 2 089 519 311 $ US |
| 2020 | 664 000 000 $ US | −36 581 964 914 $ US |
| 2019 | 66 885 333 333 $ US | −25 564 644 017 $ US |
| 2018 | 105 847 466 667 $ US | −33 628 018 589 $ US |
| 2017 | 38 494 666 667 $ US | −36 155 870 206 $ US |
| 2016 | 2 512 533 333 $ US | −36 038 362 646 $ US |
| 2015 | −29 296 800 000 $ US | −38 367 633 198 $ US |
| 2014 | 95 966 400 000 $ US | −16 351 253 124 $ US |
| 2013 | 157 750 133 333 $ US | −28 939 829 822 $ US |
| 2012 | 184 213 333 333 $ US | −34 546 946 169 $ US |
| 2011 | 178 246 400 000 $ US | −20 478 981 976 $ US |
| 2010 | 87 628 266 667 $ US | −30 298 625 514 $ US |
| 2009 | 39 987 200 000 $ US | −19 832 035 692 $ US |
| 2008 | 146 168 800 000 $ US | 27 432 052 484 $ US |
| 2007 | 104 039 226 151 $ US | 31 956 987 245 $ US |
| 2006 | 112 011 748 999 $ US | 36 316 114 245 $ US |
| 2005 | 105 591 257 239 $ US | 46 388 017 825 $ US |
| 2004 | 69 570 133 333 $ US | 45 822 444 274 $ US |
| 2003 | 47 212 533 333 $ US | 34 853 329 527 $ US |
| 2002 | 32 810 933 333 $ US | 33 546 804 308 $ US |
| 2001 | 28 922 133 333 $ US | 42 385 717 975 $ US |
| 2000 | 35 333 333 333 $ US | 42 102 888 694 $ US |
| 1999 | 18 576 266 667 $ US | 24 472 639 160 $ US |
| 1998 | 4 662 133 333 $ US | 12 535 220 762 $ US |
| 1997 | 21 789 586 115 $ US | 12 636 862 632 $ US |
| 1996 | 21 247 797 063 $ US | 24 825 815 915 $ US |
| 1995 | 13 809 612 817 $ US | 18 993 004 955 $ US |
| 1994 | 10 720 160 214 $ US | 6 794 815 466 $ US |
| 1993 | 1 194 926 569 $ US | 199 209 364 $ US |
| 1992 | 4 279 305 741 $ US | −2 019 525 110 $ US |
| 1991 | 2 535 380 507 $ US | −3 165 750 196 $ US |
| 1990 | 10 541 522 029 $ US | 918 752 143 $ US |
| 1989 | −4 130 040 053 $ US | 147 804 054 $ US |
| 1988 | −3 423 497 997 $ US | 3 769 399 529 $ US |
| 1987 | −5 373 831 776 $ US | 4 939 668 175 $ US |
| 1986 | −7 899 000 810 $ US | 3 449 442 245 $ US |
| 1985 | −6 827 443 401 $ US | 8 246 063 713 $ US |
| 1984 | −12 800 510 783 $ US | 12 115 666 744 $ US |
| 1983 | −11 894 066 570 $ US | 10 738 396 624 $ US |
| 1982 | 17 796 370 134 $ US | 11 860 257 761 $ US |
| 1981 | 60 310 278 645 $ US | 2 048 544 499 $ US |
| 1980 | 59 490 035 596 $ US | 4 663 017 448 $ US |
| 1979 | 23 056 756 397 $ US | 1 021 854 192 $ US |
| 1978 | 6 195 798 165 $ US | 476 900 149 $ US |
| 1977 | 18 443 064 170 $ US | −752 233 192 $ US |
| 1976 | 22 707 932 011 $ US | −1 865 111 562 $ US |
| 1975 | 24 135 407 771 $ US | −3 376 917 027 $ US |
| 1974 | 22 585 633 803 $ US | −156 441 718 $ US |
| 1973 | 11 776 865 468 $ US | 1 435 856 414 $ US |
| 1972 | 4 185 774 158 $ US | 656 631 983 $ US |
| 1971 | 2 591 362 408 $ US | 1 299 267 182 $ US |
| 1970 | 1 572 222 222 $ US | 1 937 027 467 $ US |
| 1969 | 1 042 836 022 $ US | −156 950 159 $ US |
| 1968 | 963 960 711 $ US | 661 732 320 $ US |
| 1967 | - | 496 890 701 $ US |
| 1966 | - | −112 316 059 $ US |
| 1965 | - | −169 761 486 $ US |
| 1964 | - | 479 321 480 $ US |
| 1963 | - | 240 146 569 $ US |
| 1962 | - | −155 319 174 $ US |
| 1961 | - | −264 543 212 $ US |
En 2025, la balance commerciale de l'Arabie saoudite affichait un excédent de 20,1 milliards de dollars et celle du Canada un déficit de 19,6 milliards de dollars. En 1968, la balance commerciale de l'Arabie saoudite affichait un excédent de 964 millions de dollars et celle du Canada un excédent de 662 millions de dollars.
De 1968 à 2025, la balance commerciale de l'Arabie saoudite a été excédentaire pendant 50 des 58 années, et celle du Canada pendant 37. Les balances commerciales de l'Arabie saoudite et du Canada n'ont été déficitaires en même temps qu'une seule de ces années, en 2015.
Arabie saoudite vs Canada : chiffres de la balance commerciale
|
Arabie saoudite
|
Canada
|
|
|---|---|---|
| Biens et services, $ US | +20,1 Md $US (2025) | −19,6 Md $US (2025) |
| % du PIB | +1,6 % (2025) | −0,8 % (2025) |
| Années d'excédent depuis 2000 | 25 sur 26 | 12 sur 26 |
| Solde des biens entre les deux, chiffres propres | −1,08 Md $US (2025) | −692 M $US (2025) |
| Premier excédent en biens avec | Émirats arabes unis (+14,2 Md $US, 2025) | États-Unis (+145 Md $US, 2025) |
| Premier déficit en biens avec | Chine (−61,7 Md $US, 2025) | Chine (−40,4 Md $US, 2025) |
Comparer la balance commerciale de 2 pays au choix
Sources :
- Banque mondiale | Économie et croissance (1961–2025, mis à jour en octobre 2026)
- TradeMap (2001–2025, mis à jour en octobre 2026)
Creative Commons Attribution (CC BY) : vous pouvez copier, partager, adapter et réutiliser ce contenu, y compris à des fins commerciales, à condition de citer statistics.wiki et d’indiquer les modifications apportées. Les sources citées ci-dessus peuvent avoir leurs propres conditions de licence.