
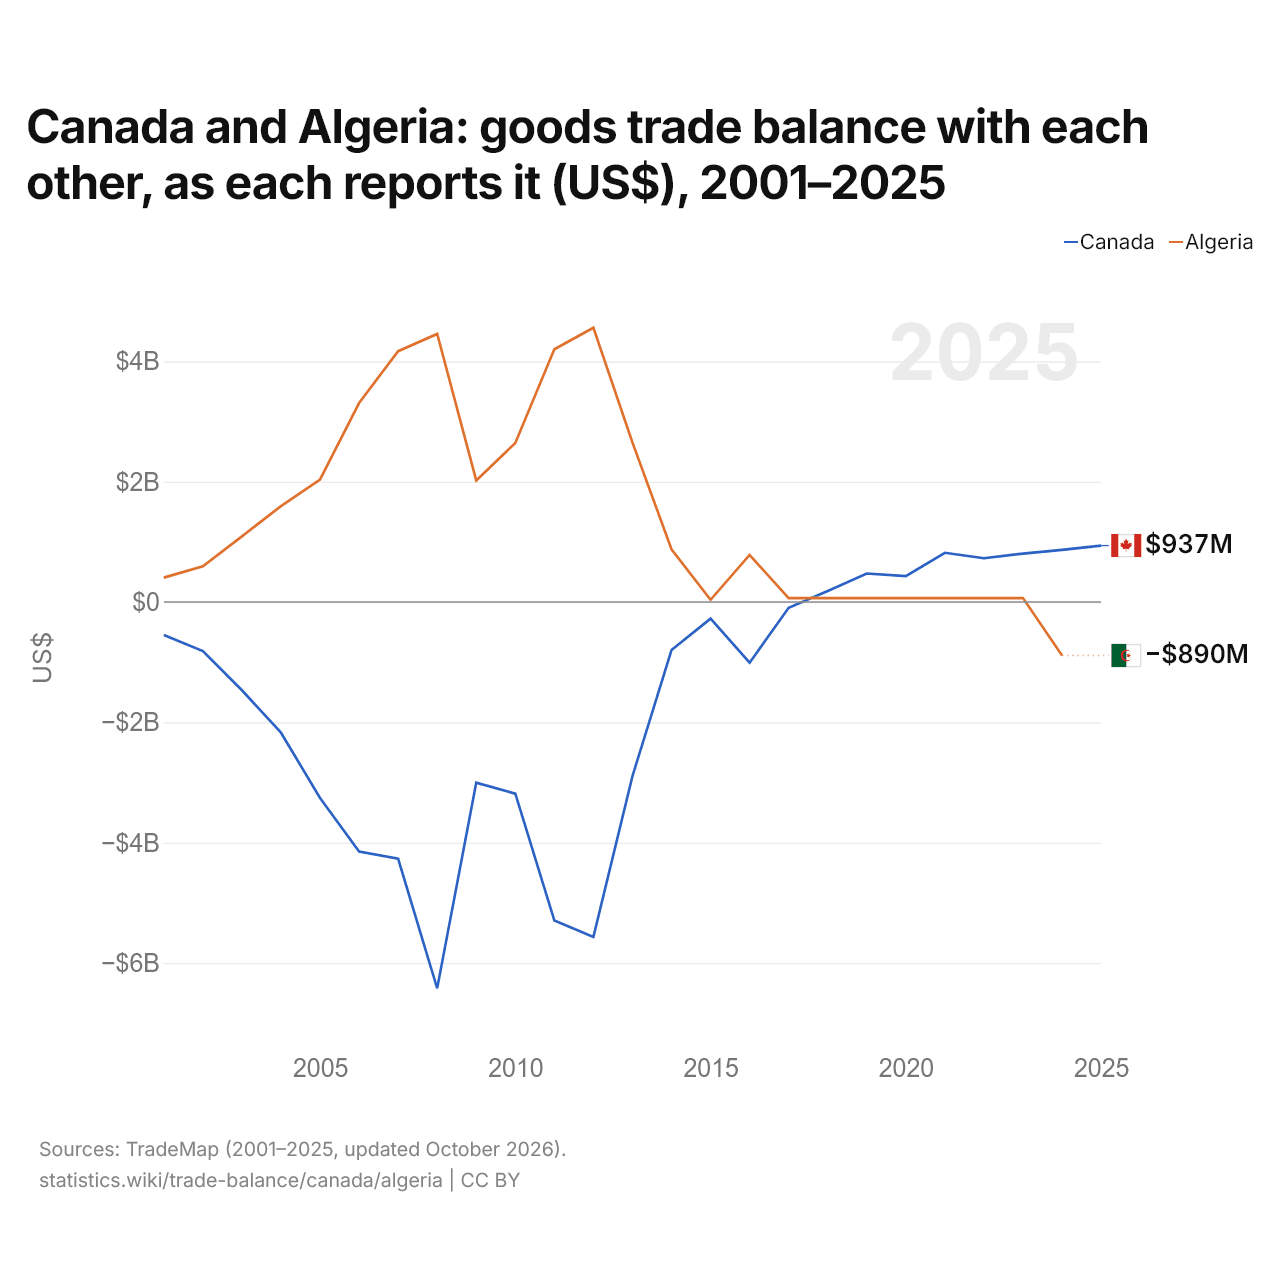
Le Canada et l'Algérie : solde de leur commerce de biens bilatéral, selon chacun ($ US), 2001–2025
| Année | $ US | |
|---|---|---|
| Canada | Algérie | |
| 2025 | 937 134 000 $ US | - |
| 2024 | 865 000 000 $ US | −890 312 000 $ US |
| 2023 | 803 982 000 $ US | 64 605 000 $ US |
| 2022 | 726 265 000 $ US | 64 605 000 $ US |
| 2021 | 817 268 000 $ US | 64 605 000 $ US |
| 2020 | 428 905 000 $ US | 64 605 000 $ US |
| 2019 | 472 991 000 $ US | 64 605 000 $ US |
| 2018 | 183 776 000 $ US | 64 605 000 $ US |
| 2017 | −96 715 000 $ US | 64 605 000 $ US |
| 2016 | −1 010 469 000 $ US | 781 173 000 $ US |
| 2015 | −275 952 000 $ US | 36 403 000 $ US |
| 2014 | −798 039 000 $ US | 875 673 000 $ US |
| 2013 | −2 894 525 000 $ US | 2 651 610 000 $ US |
| 2012 | −5 566 311 000 $ US | 4 558 504 000 $ US |
| 2011 | −5 292 187 000 $ US | 4 200 357 000 $ US |
| 2010 | −3 185 045 000 $ US | 2 641 094 000 $ US |
| 2009 | −3 003 750 000 $ US | 2 020 057 000 $ US |
| 2008 | −6 421 035 000 $ US | 4 454 709 000 $ US |
| 2007 | −4 268 123 000 $ US | 4 168 563 000 $ US |
| 2006 | −4 149 361 000 $ US | 3 306 552 000 $ US |
| 2005 | −3 257 475 000 $ US | 2 035 459 000 $ US |
| 2004 | −2 172 325 000 $ US | 1 593 173 000 $ US |
| 2003 | −1 467 258 000 $ US | 1 091 370 000 $ US |
| 2002 | −816 627 000 $ US | 592 349 000 $ US |
| 2001 | −548 152 000 $ US | 404 054 000 $ US |
Selon le Canada, son commerce de biens avec l'Algérie affichait un excédent de 865 millions de dollars ; selon l'Algérie, son commerce de biens avec le Canada affichait un déficit de 890 millions de dollars. En 2001, les chiffres étaient un déficit de 548 millions de dollars pour le Canada et un excédent de 404 millions de dollars pour l'Algérie.
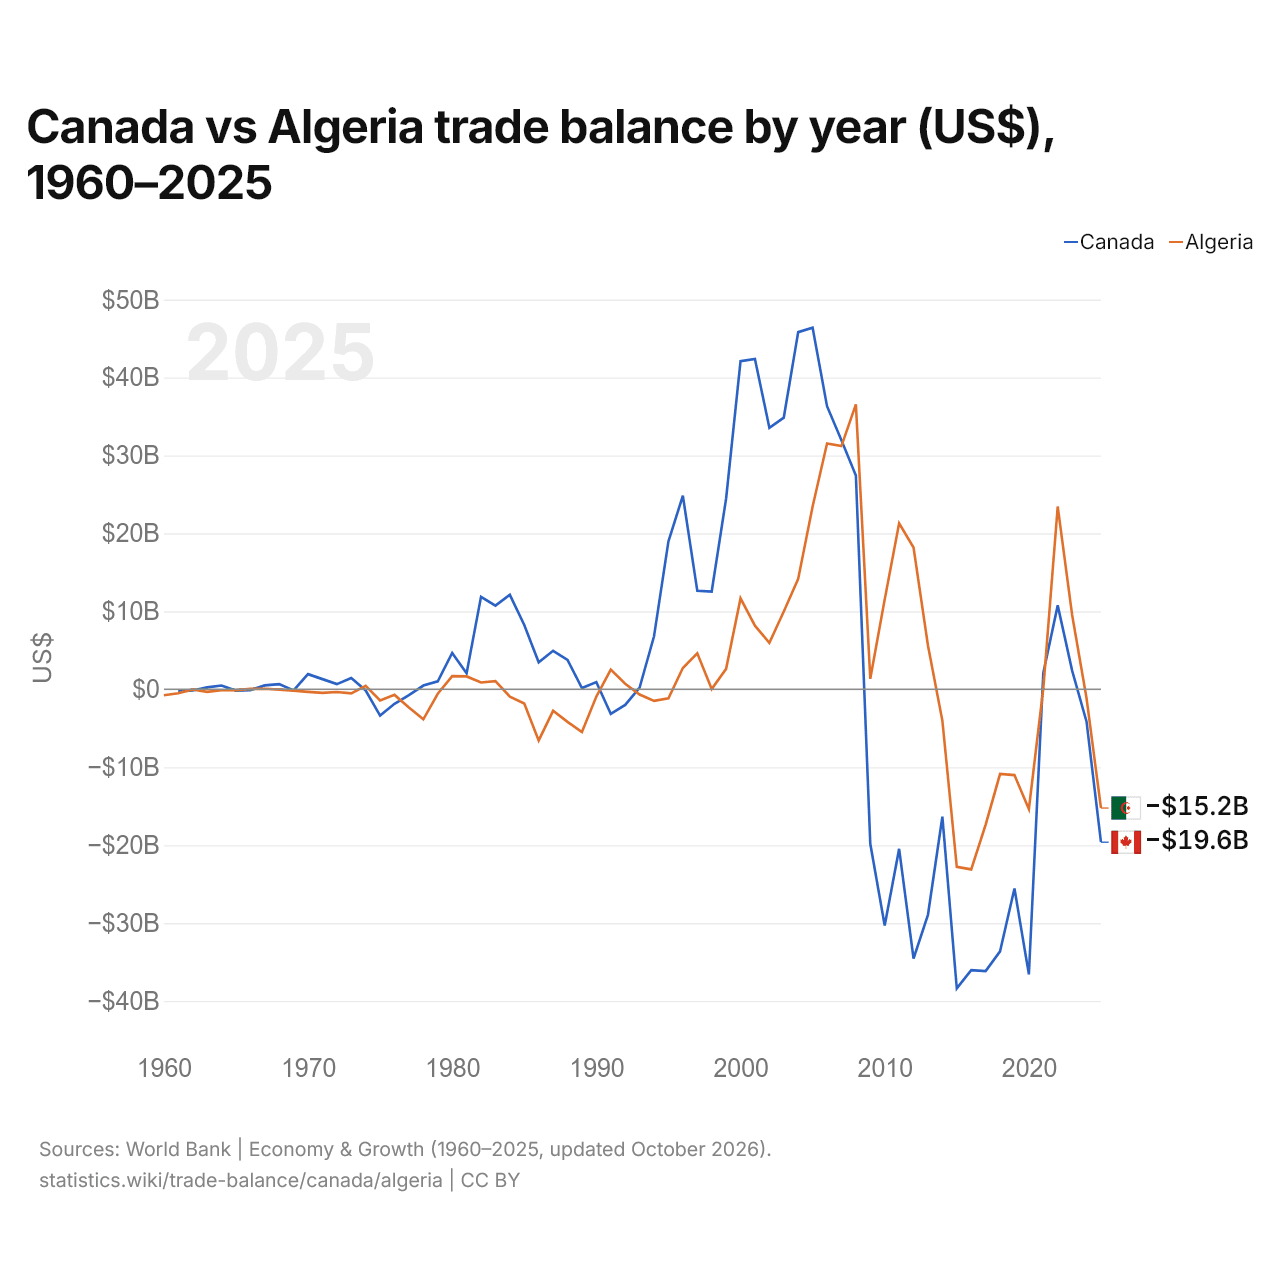
Canada vs Algérie : balance commerciale par année ($ US), 1960–2025
| Année | $ US | |
|---|---|---|
 Canada |
 Algérie |
|
| 2025 | −19 620 119 427 $ US | −15 239 617 821 $ US |
| 2024 | −4 160 338 387 $ US | −1 157 584 835 $ US |
| 2023 | 2 389 050 564 $ US | 9 521 076 816 $ US |
| 2022 | 10 766 354 419 $ US | 23 444 752 182 $ US |
| 2021 | 2 089 519 311 $ US | 96 235 574 $ US |
| 2020 | −36 581 964 914 $ US | −15 365 137 785 $ US |
| 2019 | −25 564 644 017 $ US | −11 009 709 489 $ US |
| 2018 | −33 628 018 589 $ US | −10 875 510 422 $ US |
| 2017 | −36 155 870 206 $ US | −17 380 666 509 $ US |
| 2016 | −36 038 362 646 $ US | −23 115 278 741 $ US |
| 2015 | −38 367 633 198 $ US | −22 777 389 612 $ US |
| 2014 | −16 351 253 124 $ US | −4 025 154 588 $ US |
| 2013 | −28 939 829 822 $ US | 5 622 451 757 $ US |
| 2012 | −34 546 946 169 $ US | 18 189 545 505 $ US |
| 2011 | −20 478 981 976 $ US | 21 300 645 647 $ US |
| 2010 | −30 298 625 514 $ US | 11 529 793 187 $ US |
| 2009 | −19 832 035 692 $ US | 1 333 701 926 $ US |
| 2008 | 27 432 052 484 $ US | 36 556 358 659 $ US |
| 2007 | 31 956 987 245 $ US | 31 196 364 969 $ US |
| 2006 | 36 316 114 245 $ US | 31 525 542 339 $ US |
| 2005 | 46 388 017 825 $ US | 23 445 463 437 $ US |
| 2004 | 45 822 444 274 $ US | 14 180 370 410 $ US |
| 2003 | 34 853 329 527 $ US | 9 970 802 368 $ US |
| 2002 | 33 546 804 308 $ US | 5 957 664 162 $ US |
| 2001 | 42 385 717 975 $ US | 8 147 248 966 $ US |
| 2000 | 42 102 888 694 $ US | 11 659 995 021 $ US |
| 1999 | 24 472 639 160 $ US | 2 612 547 339 $ US |
| 1998 | 12 535 220 762 $ US | 30 000 490 $ US |
| 1997 | 12 636 862 632 $ US | 4 609 976 585 $ US |
| 1996 | 24 825 815 915 $ US | 2 730 002 864 $ US |
| 1995 | 18 993 004 955 $ US | −1 170 007 106 $ US |
| 1994 | 6 794 815 466 $ US | −1 498 790 716 $ US |
| 1993 | 199 209 364 $ US | −676 792 326 $ US |
| 1992 | −2 019 525 110 $ US | 696 095 512 $ US |
| 1991 | −3 165 750 196 $ US | 2 522 617 373 $ US |
| 1990 | 918 752 143 $ US | −926 597 364 $ US |
| 1989 | 147 804 054 $ US | −5 493 813 611 $ US |
| 1988 | 3 769 399 529 $ US | −4 192 895 866 $ US |
| 1987 | 4 939 668 175 $ US | −2 763 033 271 $ US |
| 1986 | 3 449 442 245 $ US | −6 571 229 226 $ US |
| 1985 | 8 246 063 713 $ US | −1 829 825 550 $ US |
| 1984 | 12 115 666 744 $ US | −943 135 164 $ US |
| 1983 | 10 738 396 624 $ US | 1 044 102 802 $ US |
| 1982 | 11 860 257 761 $ US | 871 043 284 $ US |
| 1981 | 2 048 544 499 $ US | 1 645 114 472 $ US |
| 1980 | 4 663 017 448 $ US | 1 693 833 066 $ US |
| 1979 | 1 021 854 192 $ US | −570 943 669 $ US |
| 1978 | 476 900 149 $ US | −3 857 888 449 $ US |
| 1977 | −752 233 192 $ US | −2 339 177 208 $ US |
| 1976 | −1 865 111 562 $ US | −720 491 495 $ US |
| 1975 | −3 376 917 027 $ US | −1 443 254 204 $ US |
| 1974 | −156 441 718 $ US | 430 545 118 $ US |
| 1973 | 1 435 856 414 $ US | −529 969 047 $ US |
| 1972 | 656 631 983 $ US | −357 101 806 $ US |
| 1971 | 1 299 267 182 $ US | −468 180 171 $ US |
| 1970 | 1 937 027 467 $ US | −344 334 543 $ US |
| 1969 | −156 950 159 $ US | −182 294 787 $ US |
| 1968 | 661 732 320 $ US | −40 509 939 $ US |
| 1967 | 496 890 701 $ US | 60 764 909 $ US |
| 1966 | −112 316 059 $ US | 40 509 939 $ US |
| 1965 | −169 761 486 $ US | −101 274 848 $ US |
| 1964 | 479 321 480 $ US | −126 721 207 $ US |
| 1963 | 240 146 569 $ US | −328 164 535 $ US |
| 1962 | −155 319 174 $ US | −20 510 283 $ US |
| 1961 | −264 543 212 $ US | −517 608 091 $ US |
| 1960 | - | −765 348 446 $ US |
En 2025, la balance commerciale du Canada affichait un déficit de 19,6 milliards de dollars et celle de l'Algérie un déficit de 15,2 milliards de dollars ; le déficit du Canada était plus grand de 29 %. En 1961, la balance commerciale du Canada affichait un déficit de 265 millions de dollars et celle de l'Algérie un déficit de 518 millions de dollars.
De 1961 à 2025, la balance commerciale du Canada a été excédentaire pendant 40 des 65 années, et celle de l'Algérie pendant 30. Les balances commerciales du Canada et de l'Algérie ont été déficitaires en même temps pendant 16 de ces années, la dernière fois en 2025.
Canada vs Algérie : chiffres de la balance commerciale
|
Canada
|
Algérie
|
|
|---|---|---|
| Biens et services, $ US | −19,6 Md $US (2025) | −15,2 Md $US (2025) |
| % du PIB | −0,8 % (2025) | −5,3 % (2025) |
| Années d'excédent depuis 2000 | 12 sur 26 | 17 sur 26 |
| Solde des biens entre les deux, chiffres propres | +937 M $US (2025) | −890 M $US (2024) |
| Premier excédent en biens avec | États-Unis (+145 Md $US, 2025) | Italie (+9,26 Md $US, 2024) |
| Premier déficit en biens avec | Chine (−40,4 Md $US, 2025) | Chine (−8,59 Md $US, 2024) |
Comparer la balance commerciale de 2 pays au choix
Sources :
- Banque mondiale | Économie et croissance (1960–2025, mis à jour en octobre 2026)
- TradeMap (2001–2025, mis à jour en octobre 2026)
Creative Commons Attribution (CC BY) : vous pouvez copier, partager, adapter et réutiliser ce contenu, y compris à des fins commerciales, à condition de citer statistics.wiki et d’indiquer les modifications apportées. Les sources citées ci-dessus peuvent avoir leurs propres conditions de licence.