
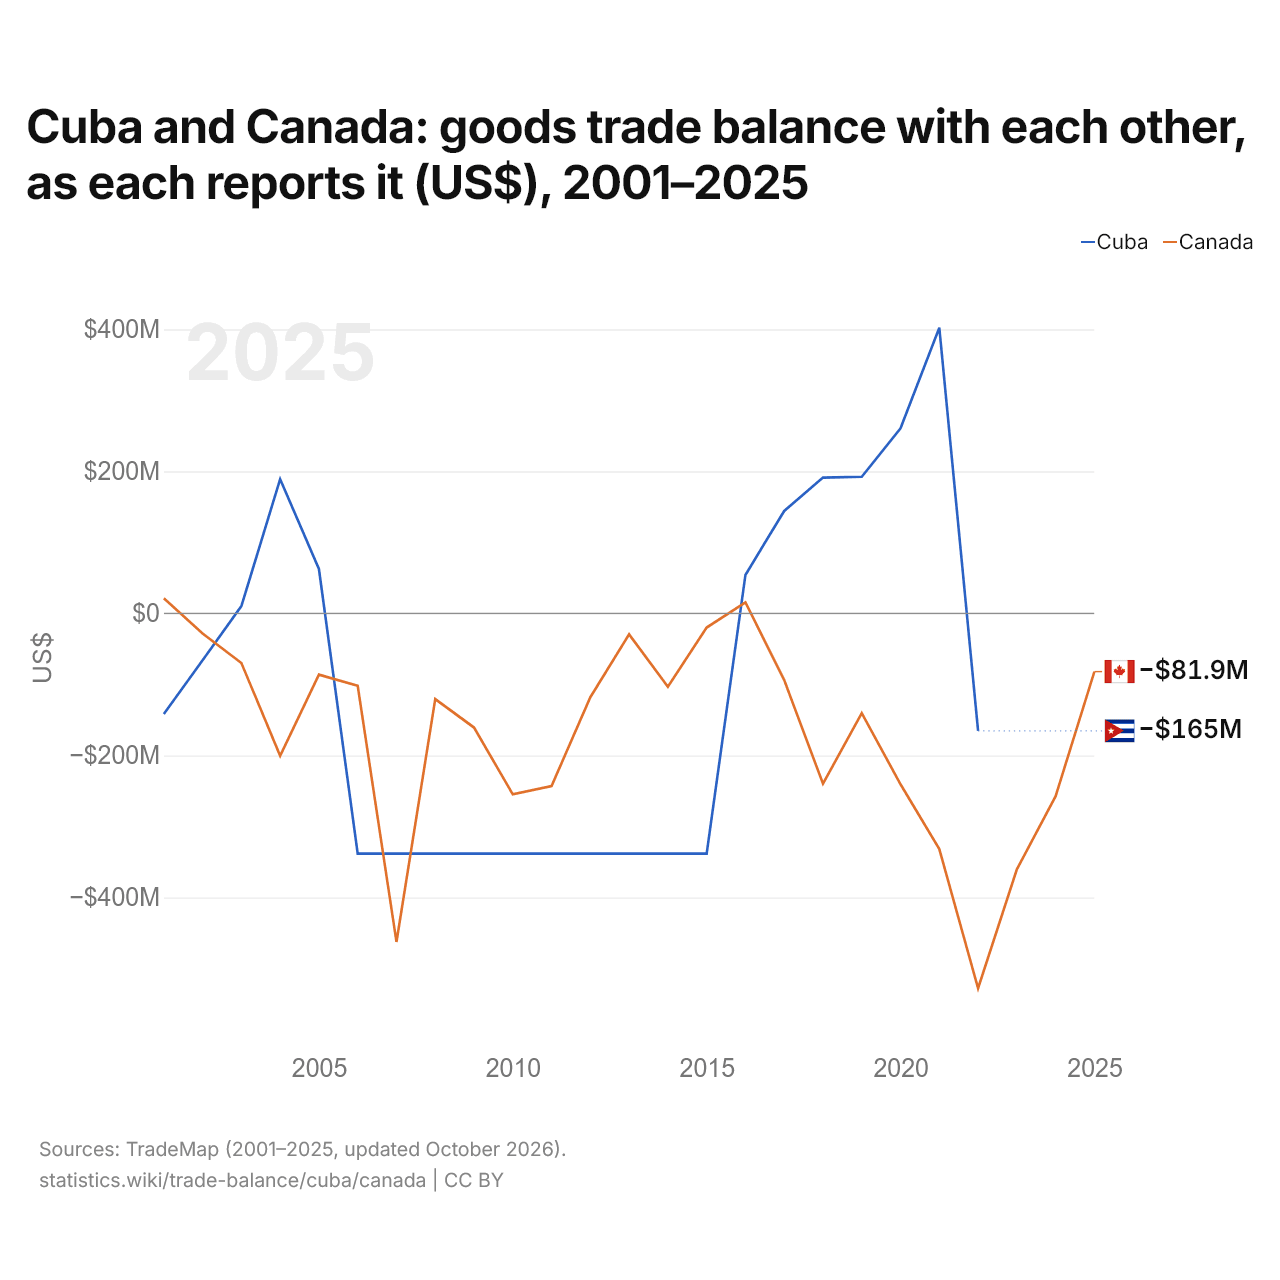
Cuba et le Canada : solde de leur commerce de biens bilatéral, selon chacun ($ US), 2001–2025
| Année | $ US | |
|---|---|---|
| Cuba | Canada | |
| 2025 | - | −81 943 000 $ US |
| 2024 | - | −257 268 000 $ US |
| 2023 | - | −360 366 000 $ US |
| 2022 | −165 353 000 $ US | −527 855 000 $ US |
| 2021 | 402 280 000 $ US | −331 940 000 $ US |
| 2020 | 260 609 000 $ US | −240 646 000 $ US |
| 2019 | 192 364 000 $ US | −140 341 000 $ US |
| 2018 | 191 268 000 $ US | −239 849 000 $ US |
| 2017 | 144 265 000 $ US | −93 940 000 $ US |
| 2016 | 54 182 000 $ US | 15 555 000 $ US |
| 2015 | −338 149 000 $ US | −19 894 000 $ US |
| 2014 | −338 149 000 $ US | −103 392 000 $ US |
| 2013 | −338 149 000 $ US | −29 508 000 $ US |
| 2012 | −338 149 000 $ US | −117 964 000 $ US |
| 2011 | −338 149 000 $ US | −243 026 000 $ US |
| 2010 | −338 149 000 $ US | −254 741 000 $ US |
| 2009 | −338 149 000 $ US | −160 695 000 $ US |
| 2008 | −338 149 000 $ US | −120 700 000 $ US |
| 2007 | −338 149 000 $ US | −462 532 000 $ US |
| 2006 | −338 149 000 $ US | −101 880 000 $ US |
| 2005 | 62 527 000 $ US | −86 230 000 $ US |
| 2004 | 189 002 000 $ US | −200 420 000 $ US |
| 2003 | 10 217 000 $ US | −69 832 000 $ US |
| 2002 | −66 022 000 $ US | −28 369 000 $ US |
| 2001 | −141 554 000 $ US | 21 457 000 $ US |
Selon Cuba, son commerce de biens avec le Canada affichait un déficit de 165 millions de dollars ; selon le Canada, son commerce de biens avec Cuba affichait un déficit de 528 millions de dollars. En 2001, les chiffres étaient un déficit de 142 millions de dollars pour Cuba et un excédent de 21,5 millions de dollars pour le Canada.
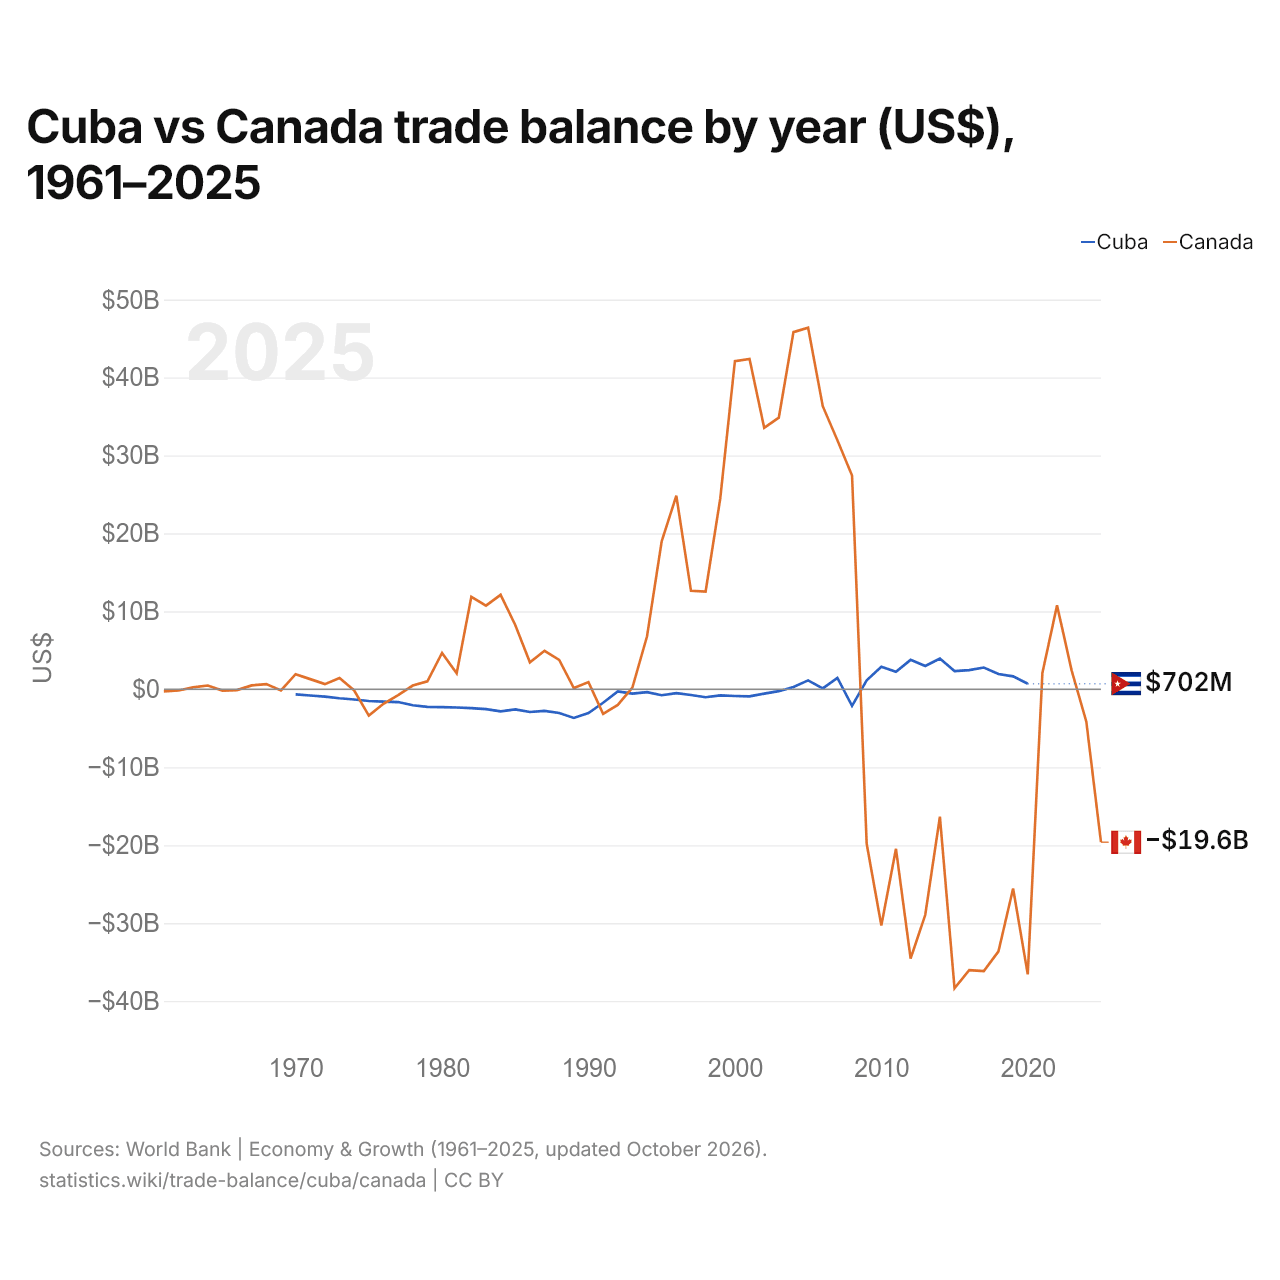
Cuba vs Canada : balance commerciale par année ($ US), 1961–2025
| Année | $ US | |
|---|---|---|
 Cuba |
 Canada |
|
| 2025 | - | −19 620 119 427 $ US |
| 2024 | - | −4 160 338 387 $ US |
| 2023 | - | 2 389 050 564 $ US |
| 2022 | - | 10 766 354 419 $ US |
| 2021 | - | 2 089 519 311 $ US |
| 2020 | 702 000 000 $ US | −36 581 964 914 $ US |
| 2019 | 1 660 900 000 $ US | −25 564 644 017 $ US |
| 2018 | 1 962 900 000 $ US | −33 628 018 589 $ US |
| 2017 | 2 789 400 000 $ US | −36 155 870 206 $ US |
| 2016 | 2 463 300 000 $ US | −36 038 362 646 $ US |
| 2015 | 2 336 000 000 $ US | −38 367 633 198 $ US |
| 2014 | 3 947 000 000 $ US | −16 351 253 124 $ US |
| 2013 | 2 991 000 000 $ US | −28 939 829 822 $ US |
| 2012 | 3 771 000 000 $ US | −34 546 946 169 $ US |
| 2011 | 2 240 000 000 $ US | −20 478 981 976 $ US |
| 2010 | 2 887 962 963 $ US | −30 298 625 514 $ US |
| 2009 | 1 152 777 778 $ US | −19 832 035 692 $ US |
| 2008 | −2 129 351 852 $ US | 27 432 052 484 $ US |
| 2007 | 1 467 870 370 $ US | 31 956 987 245 $ US |
| 2006 | 116 666 667 $ US | 36 316 114 245 $ US |
| 2005 | 1 140 600 000 $ US | 46 388 017 825 $ US |
| 2004 | 279 700 000 $ US | 45 822 444 274 $ US |
| 2003 | −245 300 000 $ US | 34 853 329 527 $ US |
| 2002 | −562 700 000 $ US | 33 546 804 308 $ US |
| 2001 | −916 300 000 $ US | 42 385 717 975 $ US |
| 2000 | −860 700 000 $ US | 42 102 888 694 $ US |
| 1999 | −792 500 000 $ US | 24 472 639 160 $ US |
| 1998 | −1 029 300 000 $ US | 12 535 220 762 $ US |
| 1997 | −737 200 000 $ US | 12 636 862 632 $ US |
| 1996 | −500 000 000 $ US | 24 825 815 915 $ US |
| 1995 | −762 386 442 $ US | 18 993 004 955 $ US |
| 1994 | −368 823 784 $ US | 6 794 815 466 $ US |
| 1993 | −565 312 297 $ US | 199 209 364 $ US |
| 1992 | −289 398 378 $ US | −2 019 525 110 $ US |
| 1991 | −1 734 684 045 $ US | −3 165 750 196 $ US |
| 1990 | −3 046 844 016 $ US | 918 752 143 $ US |
| 1989 | −3 675 379 469 $ US | 147 804 054 $ US |
| 1988 | −3 043 123 879 $ US | 3 769 399 529 $ US |
| 1987 | −2 777 825 258 $ US | 4 939 668 175 $ US |
| 1986 | −2 918 851 692 $ US | 3 449 442 245 $ US |
| 1985 | −2 582 425 265 $ US | 8 246 063 713 $ US |
| 1984 | −2 837 376 779 $ US | 12 115 666 744 $ US |
| 1983 | −2 541 022 934 $ US | 10 738 396 624 $ US |
| 1982 | −2 412 947 059 $ US | 11 860 257 761 $ US |
| 1981 | −2 340 543 976 $ US | 2 048 544 499 $ US |
| 1980 | −2 295 740 833 $ US | 4 663 017 448 $ US |
| 1979 | −2 268 138 219 $ US | 1 021 854 192 $ US |
| 1978 | −2 058 740 779 $ US | 476 900 149 $ US |
| 1977 | −1 641 618 313 $ US | −752 233 192 $ US |
| 1976 | −1 594 581 973 $ US | −1 865 111 562 $ US |
| 1975 | −1 505 098 537 $ US | −3 376 917 027 $ US |
| 1974 | −1 318 322 927 $ US | −156 441 718 $ US |
| 1973 | −1 153 937 033 $ US | 1 435 856 414 $ US |
| 1972 | −940 170 199 $ US | 656 631 983 $ US |
| 1971 | −799 136 000 $ US | 1 299 267 182 $ US |
| 1970 | −657 873 400 $ US | 1 937 027 467 $ US |
| 1969 | - | −156 950 159 $ US |
| 1968 | - | 661 732 320 $ US |
| 1967 | - | 496 890 701 $ US |
| 1966 | - | −112 316 059 $ US |
| 1965 | - | −169 761 486 $ US |
| 1964 | - | 479 321 480 $ US |
| 1963 | - | 240 146 569 $ US |
| 1962 | - | −155 319 174 $ US |
| 1961 | - | −264 543 212 $ US |
La balance commerciale de Cuba affiche un excédent de 702 millions de dollars (2020), et celle du Canada un déficit de 19,6 milliards de dollars (2025).
Depuis 1970, la balance commerciale de Cuba a été excédentaire pendant 16 des 51 années, et celle du Canada pendant 33. Les balances commerciales de Cuba et du Canada ont été déficitaires en même temps pendant 6 de ces années, la dernière fois en 1992.
Cuba vs Canada : chiffres de la balance commerciale
|
Cuba
|
Canada
|
|
|---|---|---|
| Biens et services, $ US | +702 M $US (2020) | −19,6 Md $US (2025) |
| % du PIB | +0,7 % (2020) | −0,8 % (2025) |
| Années d'excédent depuis 2000 | 16 sur 21 | 12 sur 26 |
| Solde des biens entre les deux, chiffres propres | −165 M $US (2022) | −81,9 M $US (2025) |
| Premier excédent en biens avec | Chypre (+17,5 M $US, 2022) | États-Unis (+145 Md $US, 2025) |
| Premier déficit en biens avec | Chine (−950 M $US, 2022) | Chine (−40,4 Md $US, 2025) |
Comparer la balance commerciale de 2 pays au choix
Sources :
- Banque mondiale | Économie et croissance (1961–2025, mis à jour en octobre 2026)
- TradeMap (2001–2025, mis à jour en octobre 2026)
Creative Commons Attribution (CC BY) : vous pouvez copier, partager, adapter et réutiliser ce contenu, y compris à des fins commerciales, à condition de citer statistics.wiki et d’indiquer les modifications apportées. Les sources citées ci-dessus peuvent avoir leurs propres conditions de licence.