
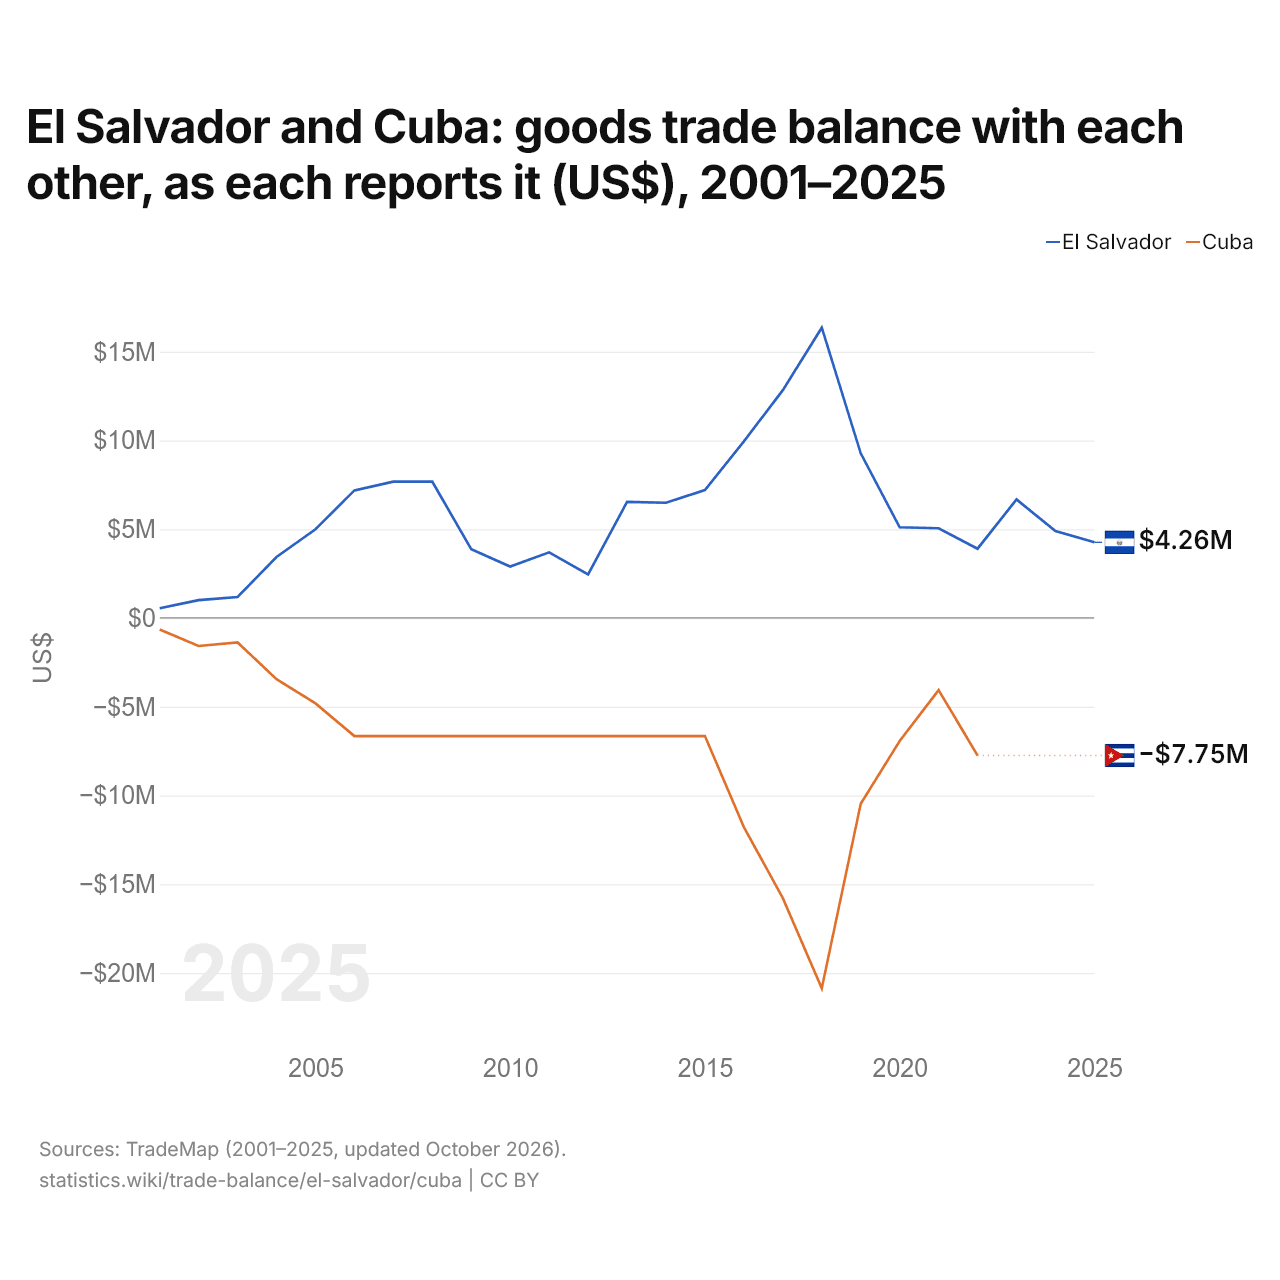
Le Salvador et Cuba : solde de leur commerce de biens bilatéral, selon chacun ($ US), 2001–2025
| Année | $ US | |
|---|---|---|
| Salvador | Cuba | |
| 2025 | 4 258 000 $ US | - |
| 2024 | 4 887 000 $ US | - |
| 2023 | 6 673 000 $ US | - |
| 2022 | 3 898 000 $ US | −7 754 000 $ US |
| 2021 | 5 051 000 $ US | −4 071 000 $ US |
| 2020 | 5 104 000 $ US | −6 937 000 $ US |
| 2019 | 9 272 000 $ US | −10 475 000 $ US |
| 2018 | 16 350 000 $ US | −20 869 000 $ US |
| 2017 | 12 833 000 $ US | −15 786 000 $ US |
| 2016 | 9 946 000 $ US | −11 784 000 $ US |
| 2015 | 7 205 000 $ US | −6 658 000 $ US |
| 2014 | 6 487 000 $ US | −6 658 000 $ US |
| 2013 | 6 534 000 $ US | −6 658 000 $ US |
| 2012 | 2 449 000 $ US | −6 658 000 $ US |
| 2011 | 3 694 000 $ US | −6 658 000 $ US |
| 2010 | 2 894 000 $ US | −6 658 000 $ US |
| 2009 | 3 872 000 $ US | −6 658 000 $ US |
| 2008 | 7 674 000 $ US | −6 658 000 $ US |
| 2007 | 7 678 000 $ US | −6 658 000 $ US |
| 2006 | 7 184 000 $ US | −6 658 000 $ US |
| 2005 | 4 991 000 $ US | −4 814 000 $ US |
| 2004 | 3 432 000 $ US | −3 451 000 $ US |
| 2003 | 1 178 000 $ US | −1 382 000 $ US |
| 2002 | 1 000 000 $ US | −1 582 000 $ US |
| 2001 | 543 000 $ US | −654 000 $ US |
Selon le Salvador, son commerce de biens avec Cuba affichait un excédent de 3,9 millions de dollars ; selon Cuba, son commerce de biens avec le Salvador affichait un déficit de 7,75 millions de dollars. En 2001, les chiffres étaient un excédent de 543 000 dollars pour le Salvador et un déficit de 654 000 dollars pour Cuba.
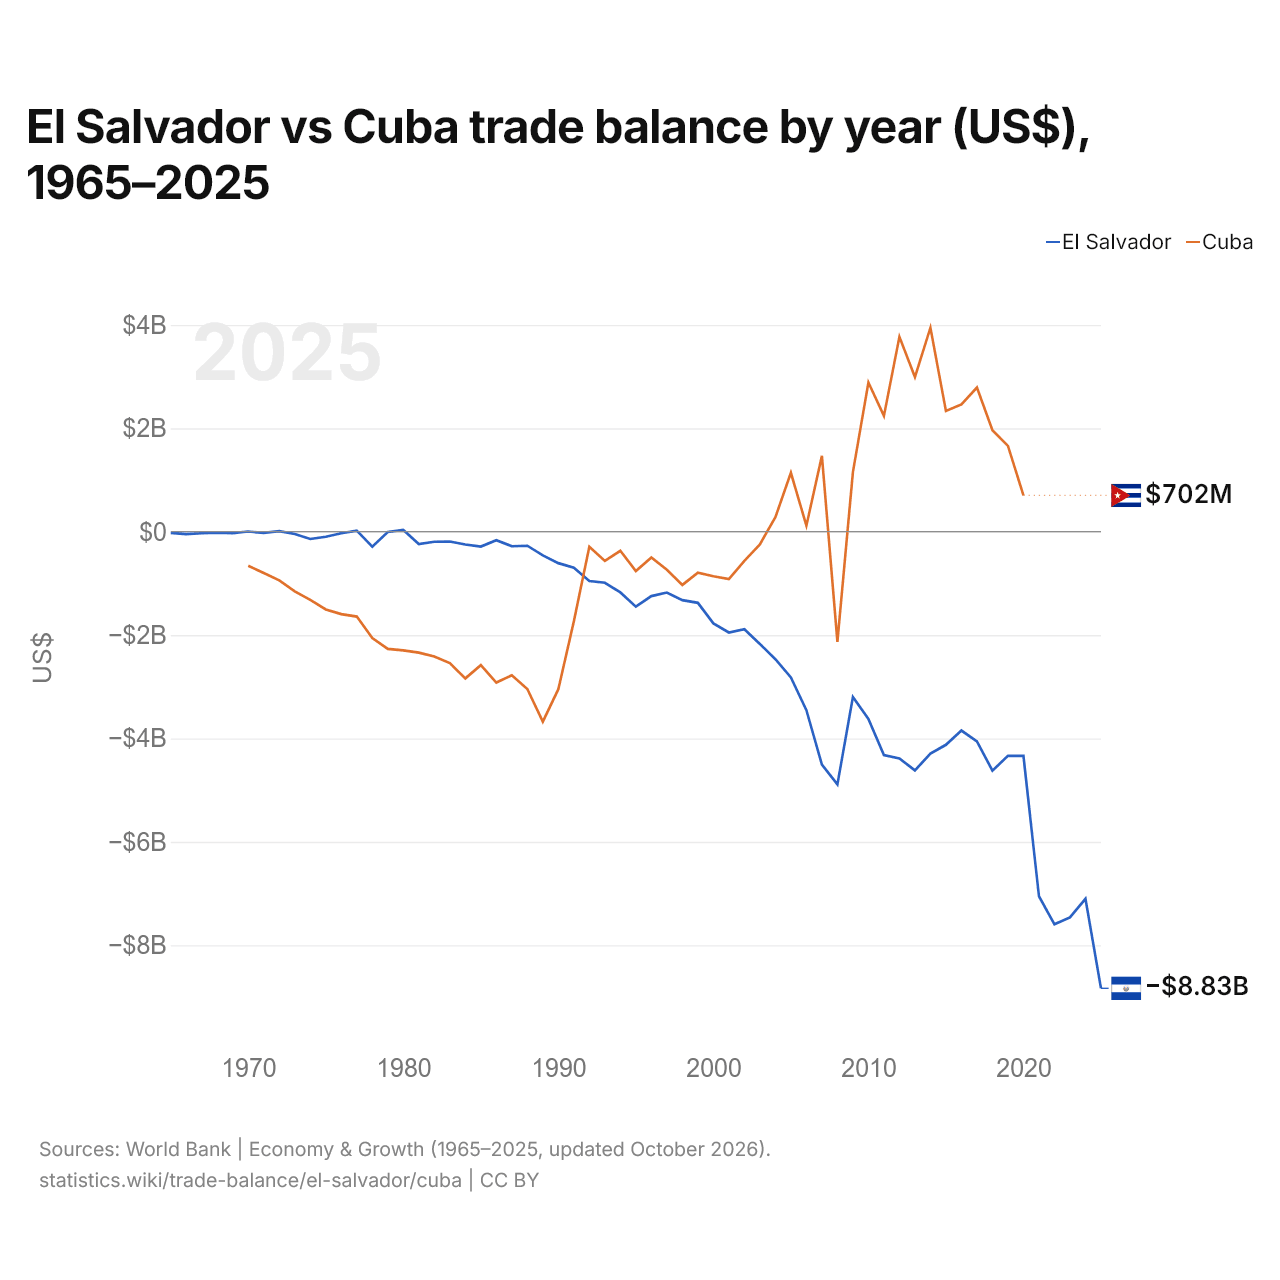
Salvador vs Cuba : balance commerciale par année ($ US), 1965–2025
| Année | $ US | |
|---|---|---|
 Salvador |
 Cuba |
|
| 2025 | −8 833 780 000 $ US | - |
| 2024 | −7 102 510 000 $ US | - |
| 2023 | −7 461 110 000 $ US | - |
| 2022 | −7 595 970 000 $ US | - |
| 2021 | −7 052 280 000 $ US | - |
| 2020 | −4 337 760 000 $ US | 702 000 000 $ US |
| 2019 | −4 335 980 000 $ US | 1 660 900 000 $ US |
| 2018 | −4 622 570 000 $ US | 1 962 900 000 $ US |
| 2017 | −4 057 900 000 $ US | 2 789 400 000 $ US |
| 2016 | −3 846 900 000 $ US | 2 463 300 000 $ US |
| 2015 | −4 122 300 000 $ US | 2 336 000 000 $ US |
| 2014 | −4 292 460 000 $ US | 3 947 000 000 $ US |
| 2013 | −4 618 410 000 $ US | 2 991 000 000 $ US |
| 2012 | −4 385 540 000 $ US | 3 771 000 000 $ US |
| 2011 | −4 323 100 000 $ US | 2 240 000 000 $ US |
| 2010 | −3 623 900 000 $ US | 2 887 962 963 $ US |
| 2009 | −3 198 000 000 $ US | 1 152 777 778 $ US |
| 2008 | −4 889 700 000 $ US | −2 129 351 852 $ US |
| 2007 | −4 505 900 000 $ US | 1 467 870 370 $ US |
| 2006 | −3 452 170 000 $ US | 116 666 667 $ US |
| 2005 | −2 819 470 000 $ US | 1 140 600 000 $ US |
| 2004 | −2 466 327 000 $ US | 279 700 000 $ US |
| 2003 | −2 170 692 600 $ US | −245 300 000 $ US |
| 2002 | −1 886 066 700 $ US | −562 700 000 $ US |
| 2001 | −1 949 502 700 $ US | −916 300 000 $ US |
| 2000 | −1 774 285 500 $ US | −860 700 000 $ US |
| 1999 | −1 376 411 000 $ US | −792 500 000 $ US |
| 1998 | −1 323 240 700 $ US | −1 029 300 000 $ US |
| 1997 | −1 176 867 900 $ US | −737 200 000 $ US |
| 1996 | −1 246 211 200 $ US | −500 000 000 $ US |
| 1995 | −1 449 972 700 $ US | −762 386 442 $ US |
| 1994 | −1 175 191 700 $ US | −368 823 784 $ US |
| 1993 | −987 523 100 $ US | −565 312 297 $ US |
| 1992 | −953 944 800 $ US | −289 398 378 $ US |
| 1991 | −698 660 500 $ US | −1 734 684 045 $ US |
| 1990 | −608 053 458 $ US | −3 046 844 016 $ US |
| 1989 | −457 015 400 $ US | −3 675 379 469 $ US |
| 1988 | −271 267 100 $ US | −3 043 123 879 $ US |
| 1987 | −281 417 600 $ US | −2 777 825 258 $ US |
| 1986 | −165 115 800 $ US | −2 918 851 692 $ US |
| 1985 | −287 422 100 $ US | −2 582 425 265 $ US |
| 1984 | −248 349 900 $ US | −2 837 376 779 $ US |
| 1983 | −190 070 900 $ US | −2 541 022 934 $ US |
| 1982 | −193 513 600 $ US | −2 412 947 059 $ US |
| 1981 | −237 480 000 $ US | −2 340 543 976 $ US |
| 1980 | 32 760 000 $ US | −2 295 740 833 $ US |
| 1979 | −5 880 000 $ US | −2 268 138 219 $ US |
| 1978 | −289 760 100 $ US | −2 058 740 779 $ US |
| 1977 | 20 360 000 $ US | −1 641 618 313 $ US |
| 1976 | −29 640 000 $ US | −1 594 581 973 $ US |
| 1975 | −97 400 000 $ US | −1 505 098 537 $ US |
| 1974 | −140 160 000 $ US | −1 318 322 927 $ US |
| 1973 | −43 600 000 $ US | −1 153 937 033 $ US |
| 1972 | 12 240 000 $ US | −940 170 199 $ US |
| 1971 | −23 520 000 $ US | −799 136 000 $ US |
| 1970 | 3 240 000 $ US | −657 873 400 $ US |
| 1969 | −27 360 000 $ US | - |
| 1968 | −17 720 000 $ US | - |
| 1967 | −29 480 000 $ US | - |
| 1966 | −47 560 000 $ US | - |
| 1965 | −21 280 000 $ US | - |
La balance commerciale du Salvador affiche un déficit de 8,83 milliards de dollars (2025), et celle de Cuba un excédent de 702 millions de dollars (2020).
Depuis 1970, la balance commerciale du Salvador a été excédentaire pendant 4 des 51 années, et celle de Cuba pendant 16. Les balances commerciales du Salvador et de Cuba ont été déficitaires en même temps pendant 31 de ces années, la dernière fois en 2008.
Salvador vs Cuba : chiffres de la balance commerciale
|
Salvador
|
Cuba
|
|
|---|---|---|
| Biens et services, $ US | −8,83 Md $US (2025) | +702 M $US (2020) |
| % du PIB | −24,1 % (2025) | +0,7 % (2020) |
| Années d'excédent depuis 2000 | 0 sur 26 | 16 sur 21 |
| Solde des biens entre les deux, chiffres propres | +4,26 M $US (2025) | −7,75 M $US (2022) |
| Premier excédent en biens avec | Honduras (+348 M $US, 2025) | Chypre (+17,5 M $US, 2022) |
| Premier déficit en biens avec | Chine (−3,52 Md $US, 2025) | Chine (−950 M $US, 2022) |
Comparer la balance commerciale de 2 pays au choix
Sources :
- Banque mondiale | Économie et croissance (1965–2025, mis à jour en octobre 2026)
- TradeMap (2001–2025, mis à jour en octobre 2026)
Creative Commons Attribution (CC BY) : vous pouvez copier, partager, adapter et réutiliser ce contenu, y compris à des fins commerciales, à condition de citer statistics.wiki et d’indiquer les modifications apportées. Les sources citées ci-dessus peuvent avoir leurs propres conditions de licence.