
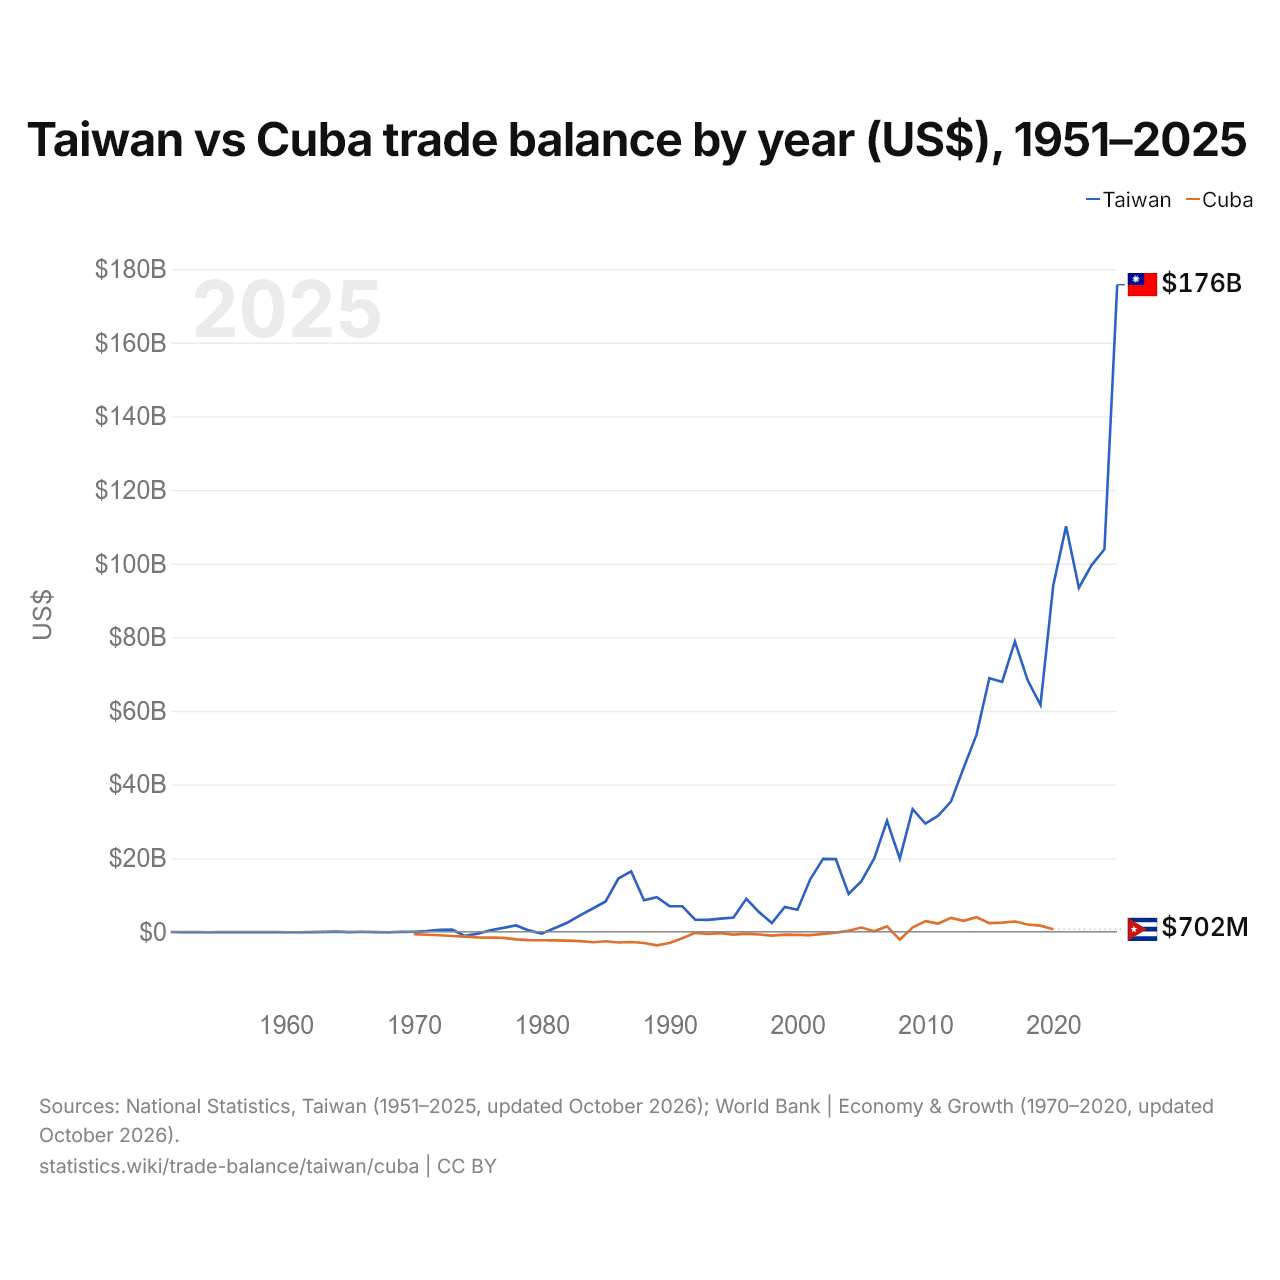
Taïwan vs Cuba : balance commerciale par année ($ US), 1951–2025
| Année | $ US | |
|---|---|---|
 Taïwan |
 Cuba |
|
| 2025 | 175 730 816 366 $ US | - |
| 2024 | 103 868 298 391 $ US | - |
| 2023 | 99 599 518 967 $ US | - |
| 2022 | 93 419 145 167 $ US | - |
| 2021 | 110 101 001 084 $ US | - |
| 2020 | 94 112 135 102 $ US | 702 000 000 $ US |
| 2019 | 61 602 988 387 $ US | 1 660 900 000 $ US |
| 2018 | 68 289 323 756 $ US | 1 962 900 000 $ US |
| 2017 | 78 822 748 418 $ US | 2 789 400 000 $ US |
| 2016 | 67 843 592 121 $ US | 2 463 300 000 $ US |
| 2015 | 68 868 916 045 $ US | 2 336 000 000 $ US |
| 2014 | 53 534 889 165 $ US | 3 947 000 000 $ US |
| 2013 | 44 597 419 023 $ US | 2 991 000 000 $ US |
| 2012 | 35 346 921 251 $ US | 3 771 000 000 $ US |
| 2011 | 31 508 135 989 $ US | 2 240 000 000 $ US |
| 2010 | 29 390 983 001 $ US | 2 887 962 963 $ US |
| 2009 | 33 299 169 241 $ US | 1 152 777 778 $ US |
| 2008 | 19 856 679 259 $ US | −2 129 351 852 $ US |
| 2007 | 30 133 874 910 $ US | 1 467 870 370 $ US |
| 2006 | 19 902 056 091 $ US | 116 666 667 $ US |
| 2005 | 13 759 784 756 $ US | 1 140 600 000 $ US |
| 2004 | 10 294 009 209 $ US | 279 700 000 $ US |
| 2003 | 19 713 655 175 $ US | −245 300 000 $ US |
| 2002 | 19 796 152 635 $ US | −562 700 000 $ US |
| 2001 | 14 254 666 034 $ US | −916 300 000 $ US |
| 2000 | 5 967 270 867 $ US | −860 700 000 $ US |
| 1999 | 6 729 466 177 $ US | −792 500 000 $ US |
| 1998 | 2 346 260 930 $ US | −1 029 300 000 $ US |
| 1997 | 5 331 353 679 $ US | −737 200 000 $ US |
| 1996 | 8 954 373 984 $ US | −500 000 000 $ US |
| 1995 | 3 860 320 666 $ US | −762 386 442 $ US |
| 1994 | 3 583 749 045 $ US | −368 823 784 $ US |
| 1993 | 3 233 303 779 $ US | −565 312 297 $ US |
| 1992 | 3 255 558 306 $ US | −289 398 378 $ US |
| 1991 | 6 934 344 190 $ US | −1 734 684 045 $ US |
| 1990 | 6 937 400 638 $ US | −3 046 844 016 $ US |
| 1989 | 9 408 935 239 $ US | −3 675 379 469 $ US |
| 1988 | 8 553 507 565 $ US | −3 043 123 879 $ US |
| 1987 | 16 386 726 889 $ US | −2 777 825 258 $ US |
| 1986 | 14 458 795 432 $ US | −2 918 851 692 $ US |
| 1985 | 8 214 902 611 $ US | −2 582 425 265 $ US |
| 1984 | 6 327 452 175 $ US | −2 837 376 779 $ US |
| 1983 | 4 465 957 867 $ US | −2 541 022 934 $ US |
| 1982 | 2 460 201 845 $ US | −2 412 947 059 $ US |
| 1981 | 958 960 559 $ US | −2 340 543 976 $ US |
| 1980 | −493 172 173 $ US | −2 295 740 833 $ US |
| 1979 | 375 529 010 $ US | −2 268 138 219 $ US |
| 1978 | 1 730 897 279 $ US | −2 058 740 779 $ US |
| 1977 | 1 063 558 823 $ US | −1 641 618 313 $ US |
| 1976 | 401 639 929 $ US | −1 594 581 973 $ US |
| 1975 | −508 044 189 $ US | −1 505 098 537 $ US |
| 1974 | −1 120 599 261 $ US | −1 318 322 927 $ US |
| 1973 | 568 986 665 $ US | −1 153 937 033 $ US |
| 1972 | 493 599 487 $ US | −940 170 199 $ US |
| 1971 | 162 197 589 $ US | −799 136 000 $ US |
| 1970 | −2 850 037 $ US | −657 873 400 $ US |
| 1969 | −35 598 581 $ US | - |
| 1968 | −120 794 414 $ US | - |
| 1967 | −74 631 036 $ US | - |
| 1966 | 8 725 544 $ US | - |
| 1965 | −84 323 530 $ US | - |
| 1964 | 19 377 804 $ US | - |
| 1963 | −24 971 622 $ US | - |
| 1962 | −102 918 436 $ US | - |
| 1961 | −124 121 510 $ US | - |
| 1960 | −129 280 153 $ US | - |
| 1959 | −117 696 324 $ US | - |
| 1958 | −115 652 908 $ US | - |
| 1957 | −82 951 885 $ US | - |
| 1956 | −95 184 616 $ US | - |
| 1955 | −83 290 787 $ US | - |
| 1954 | −135 500 533 $ US | - |
| 1953 | −76 248 741 $ US | - |
| 1952 | −102 221 766 $ US | - |
| 1951 | −56 223 169 $ US | - |
La balance commerciale de Taïwan affiche un excédent de 176 milliards de dollars (2025), et celle de Cuba un excédent de 702 millions de dollars (2020).
Depuis 1970, la balance commerciale de Taïwan a été excédentaire pendant 47 des 51 années, et celle de Cuba pendant 16. Les balances commerciales de Taïwan et de Cuba ont été déficitaires en même temps pendant 4 de ces années, la dernière fois en 1980.
Taïwan vs Cuba : chiffres de la balance commerciale
|
Taïwan
|
Cuba
|
|
|---|---|---|
| Biens et services, $ US | +176 Md $US (2025) | +702 M $US (2020) |
| % du PIB | +19,1 % (2025) | +0,7 % (2020) |
| Années d'excédent depuis 2000 | 26 sur 26 | 16 sur 21 |
| Solde des biens entre les deux, chiffres propres | n.d. | n.d. |
| Premier excédent en biens avec | n.d. | Chypre (+17,5 M $US, 2022) |
| Premier déficit en biens avec | n.d. | Chine (−950 M $US, 2022) |
Comparer la balance commerciale de 2 pays au choix
Sources :
- National Statistics, Taiwan (1951–2025, mis à jour en octobre 2026)
- Banque mondiale | Économie et croissance (1970–2020, mis à jour en octobre 2026)
- TradeMap (2022, mis à jour en octobre 2026)
Creative Commons Attribution (CC BY) : vous pouvez copier, partager, adapter et réutiliser ce contenu, y compris à des fins commerciales, à condition de citer statistics.wiki et d’indiquer les modifications apportées. Les sources citées ci-dessus peuvent avoir leurs propres conditions de licence.