
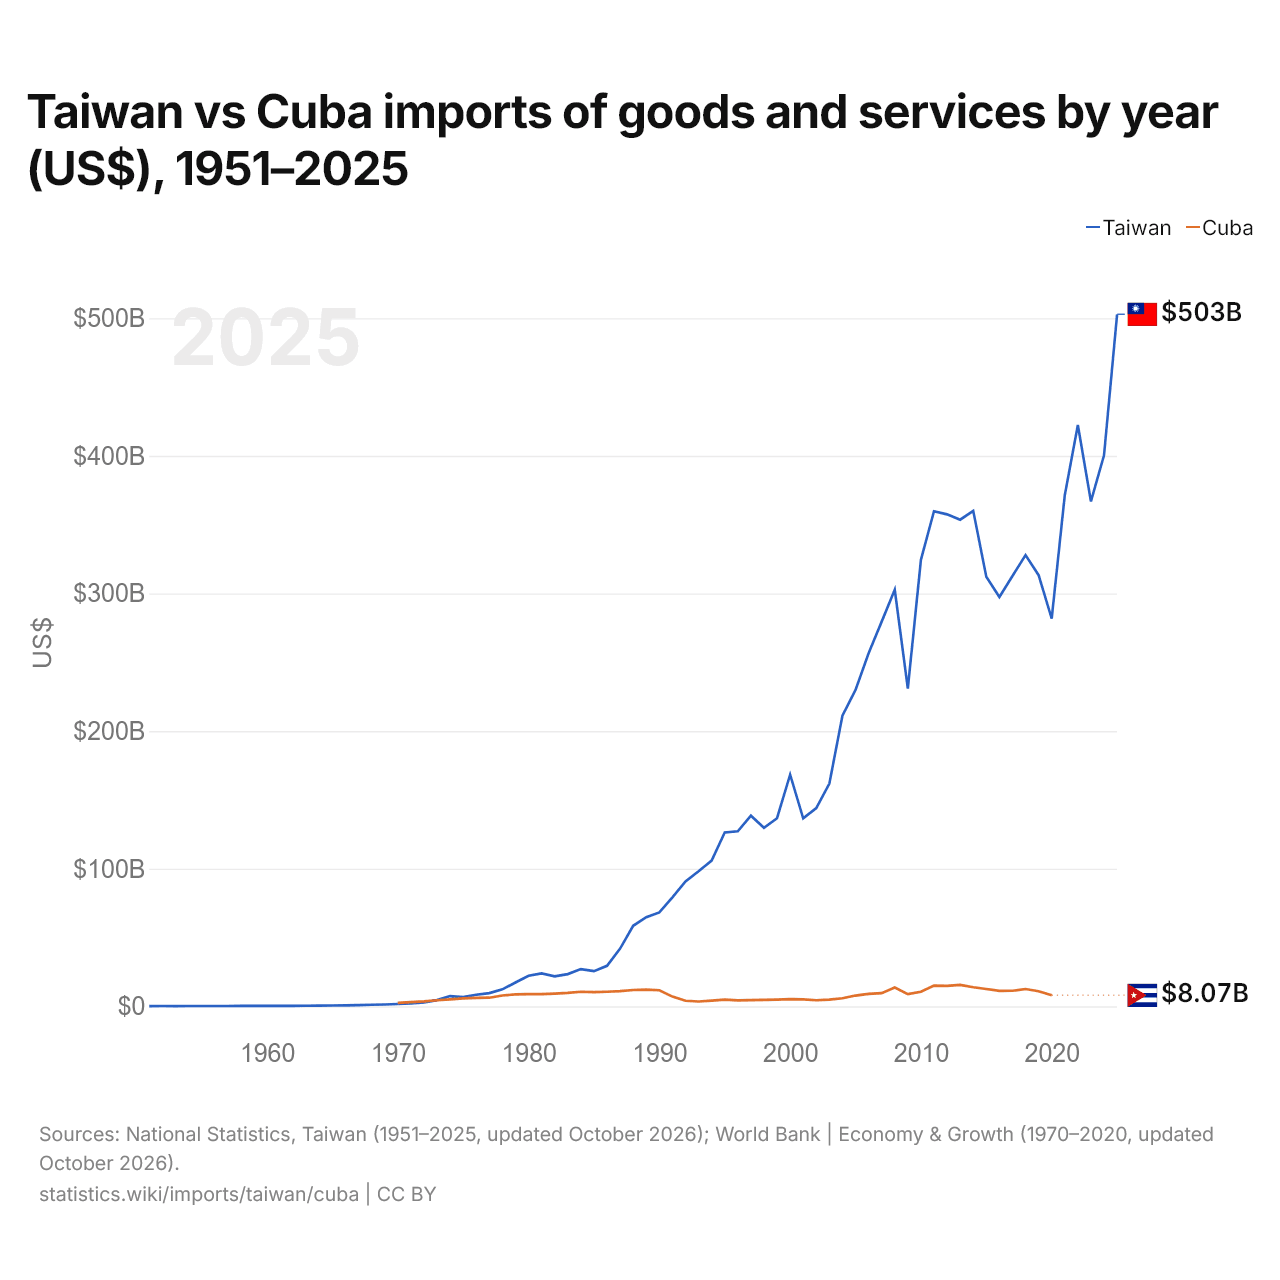
Taïwan vs Cuba : importations de biens et services par année ($ US), 1951–2025
1x
| Année | $ US | |
|---|---|---|
 Taïwan |
 Cuba |
|
| 2025 | 502 835 299 985 $ US | - |
| 2024 | 400 368 455 028 $ US | - |
| 2023 | 366 845 807 360 $ US | - |
| 2022 | 422 418 389 822 $ US | - |
| 2021 | 371 358 687 512 $ US | - |
| 2020 | 281 760 577 465 $ US | 8 067 000 000 $ US |
| 2019 | 313 292 602 358 $ US | 10 971 100 000 $ US |
| 2018 | 327 845 590 898 $ US | 12 567 100 000 $ US |
| 2017 | 312 707 879 928 $ US | 11 303 600 000 $ US |
| 2016 | 297 393 618 741 $ US | 11 226 300 000 $ US |
| 2015 | 312 111 514 859 $ US | 12 605 000 000 $ US |
| 2014 | 360 013 581 736 $ US | 13 865 000 000 $ US |
| 2013 | 353 603 335 669 $ US | 15 602 000 000 $ US |
| 2012 | 357 451 322 269 $ US | 14 888 000 000 $ US |
| 2011 | 359 703 351 306 $ US | 15 079 000 000 $ US |
| 2010 | 324 408 301 889 $ US | 10 555 555 556 $ US |
| 2009 | 230 844 879 301 $ US | 8 883 333 333 $ US |
| 2008 | 302 634 491 957 $ US | 13 709 351 852 $ US |
| 2007 | 279 526 946 314 $ US | 9 567 222 222 $ US |
| 2006 | 256 578 743 097 $ US | 9 022 222 222 $ US |
| 2005 | 229 914 322 111 $ US | 7 822 300 000 $ US |
| 2004 | 211 196 602 360 $ US | 5 841 100 000 $ US |
| 2003 | 161 831 083 158 $ US | 4 895 200 000 $ US |
| 2002 | 144 071 527 401 $ US | 4 434 700 000 $ US |
| 2001 | 136 548 195 128 $ US | 5 109 300 000 $ US |
| 2000 | 168 365 299 685 $ US | 5 179 600 000 $ US |
| 1999 | 136 655 668 787 $ US | 4 916 000 000 $ US |
| 1998 | 129 709 711 824 $ US | 4 697 400 000 $ US |
| 1997 | 138 475 579 073 $ US | 4 522 800 000 $ US |
| 1996 | 127 198 891 368 $ US | 4 331 000 000 $ US |
| 1995 | 126 319 235 395 $ US | 4 840 440 189 $ US |
| 1994 | 105 928 155 394 $ US | 4 135 300 811 $ US |
| 1993 | 98 100 210 821 $ US | 3 516 494 865 $ US |
| 1992 | 90 696 690 646 $ US | 4 025 942 838 $ US |
| 1991 | 79 173 835 551 $ US | 7 067 591 647 $ US |
| 1990 | 68 210 750 510 $ US | 11 708 950 532 $ US |
| 1989 | 64 803 743 277 $ US | 12 096 964 757 $ US |
| 1988 | 58 543 020 885 $ US | 11 837 456 728 $ US |
| 1987 | 41 947 665 008 $ US | 11 073 229 683 $ US |
| 1986 | 29 440 547 435 $ US | 10 606 362 971 $ US |
| 1985 | 25 543 553 844 $ US | 10 307 791 680 $ US |
| 1984 | 27 048 026 267 $ US | 10 603 443 142 $ US |
| 1983 | 23 430 464 997 $ US | 9 765 161 118 $ US |
| 1982 | 21 761 298 705 $ US | 9 251 183 529 $ US |
| 1981 | 23 973 062 619 $ US | 8 905 963 976 $ US |
| 1980 | 22 250 970 671 $ US | 8 817 697 500 $ US |
| 1979 | 17 335 251 305 $ US | 8 645 207 123 $ US |
| 1978 | 12 325 322 336 $ US | 7 878 465 455 $ US |
| 1977 | 9 608 186 615 $ US | 6 276 949 157 $ US |
| 1976 | 8 446 649 280 $ US | 6 093 814 738 $ US |
| 1975 | 6 657 968 307 $ US | 5 756 838 293 $ US |
| 1974 | 7 473 065 235 $ US | 5 038 233 171 $ US |
| 1973 | 4 496 443 005 $ US | 4 412 339 083 $ US |
| 1972 | 2 846 816 229 $ US | 3 594 369 360 $ US |
| 1971 | 2 182 167 561 $ US | 3 055 095 900 $ US |
| 1970 | 1 721 522 319 $ US | 2 515 236 800 $ US |
| 1969 | 1 358 270 853 $ US | - |
| 1968 | 1 152 446 708 $ US | - |
| 1967 | 881 846 328 $ US | - |
| 1966 | 679 367 368 $ US | - |
| 1965 | 628 589 045 $ US | - |
| 1964 | 489 970 887 $ US | - |
| 1963 | 415 843 754 $ US | - |
| 1962 | 365 351 700 $ US | - |
| 1961 | 369 189 618 $ US | - |
| 1960 | 327 022 147 $ US | - |
| 1959 | 298 405 955 $ US | - |
| 1958 | 304 870 104 $ US | - |
| 1957 | 239 858 443 $ US | - |
| 1956 | 220 671 752 $ US | - |
| 1955 | 242 475 881 $ US | - |
| 1954 | 240 582 579 $ US | - |
| 1953 | 203 801 441 $ US | - |
| 1952 | 236 770 072 $ US | - |
| 1951 | 178 282 794 $ US | - |
Les importations de biens et services de Taïwan s'élèvent à 503 milliards de dollars (2025), et celles de Cuba à 8,07 milliards de dollars (2020). En 1970, les importations de Cuba étaient supérieures de 46 % : 1,72 milliard de dollars pour Taïwan et 2,52 milliards de dollars pour Cuba.
Les importations de biens et services de Taïwan sont supérieures à celles de Cuba chaque année depuis 1973.
Taïwan vs Cuba : chiffres des importations
|
Taïwan
|
Cuba
|
|
|---|---|---|
| Importations | 503 Md $US (2025) | 8,07 Md $US (2020) |
| Rang mondial | 18/174 | 124/174 |
| Part mondiale | 1,49 % | 0,04 % |
| % du PIB | 54,5 % | 7,5 % |
| Première catégorie de biens | n.d. | Pétrole, gaz, minerais et autres matières premières (38,5 %, 2022) |
| Première origine des biens | n.d. | Chine (11,5 %, 2022) |
Comparer les importations de 2 pays au choix
Sources :
- National Statistics, Taiwan (1951–2025, mis à jour en octobre 2026)
- Banque mondiale | Économie et croissance (1970–2020, mis à jour en octobre 2026)
- TradeMap (2022, mis à jour en octobre 2026)
Creative Commons Attribution (CC BY) : vous pouvez copier, partager, adapter et réutiliser ce contenu, y compris à des fins commerciales, à condition de citer statistics.wiki et d’indiquer les modifications apportées. Les sources citées ci-dessus peuvent avoir leurs propres conditions de licence.