
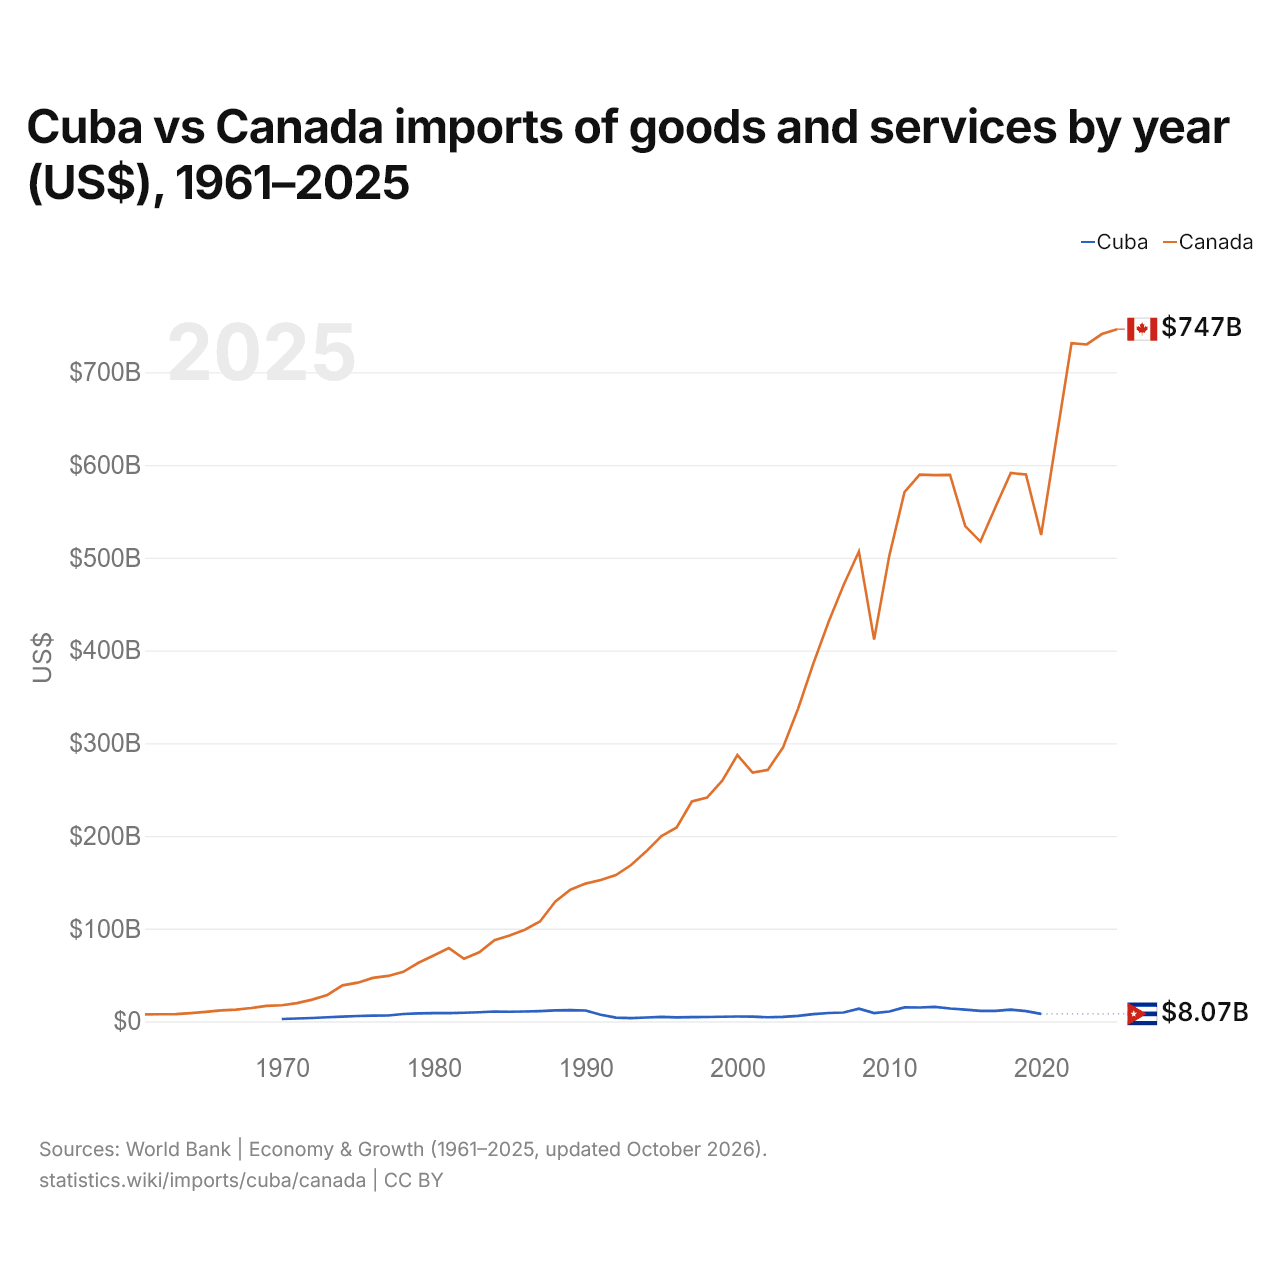
Cuba vs Canada : importations de biens et services par année ($ US), 1961–2025
| Année | $ US | |
|---|---|---|
 Cuba |
 Canada |
|
| 2025 | - | 746 500 089 837 $ US |
| 2024 | - | 741 233 987 716 $ US |
| 2023 | - | 729 991 623 300 $ US |
| 2022 | - | 731 290 006 744 $ US |
| 2021 | - | 628 388 638 999 $ US |
| 2020 | 8 067 000 000 $ US | 524 572 641 557 $ US |
| 2019 | 10 971 100 000 $ US | 589 706 748 631 $ US |
| 2018 | 12 567 100 000 $ US | 591 347 645 767 $ US |
| 2017 | 11 303 600 000 $ US | 554 922 650 425 $ US |
| 2016 | 11 226 300 000 $ US | 517 396 012 626 $ US |
| 2015 | 12 605 000 000 $ US | 534 115 083 556 $ US |
| 2014 | 13 865 000 000 $ US | 589 434 433 378 $ US |
| 2013 | 15 602 000 000 $ US | 589 048 627 265 $ US |
| 2012 | 14 888 000 000 $ US | 589 511 490 952 $ US |
| 2011 | 15 079 000 000 $ US | 570 642 753 938 $ US |
| 2010 | 10 555 555 556 $ US | 502 035 342 677 $ US |
| 2009 | 8 883 333 333 $ US | 411 817 863 704 $ US |
| 2008 | 13 709 351 852 $ US | 506 718 837 863 $ US |
| 2007 | 9 567 222 222 $ US | 470 813 704 497 $ US |
| 2006 | 9 022 222 222 $ US | 430 736 071 932 $ US |
| 2005 | 7 822 300 000 $ US | 385 981 185 014 $ US |
| 2004 | 5 841 100 000 $ US | 337 418 139 892 $ US |
| 2003 | 4 895 200 000 $ US | 295 296 552 709 $ US |
| 2002 | 4 434 700 000 $ US | 271 159 115 529 $ US |
| 2001 | 5 109 300 000 $ US | 268 281 895 661 $ US |
| 2000 | 5 179 600 000 $ US | 287 155 747 088 $ US |
| 1999 | 4 916 000 000 $ US | 259 518 745 373 $ US |
| 1998 | 4 697 400 000 $ US | 241 249 747 219 $ US |
| 1997 | 4 522 800 000 $ US | 237 129 134 768 $ US |
| 1996 | 4 331 000 000 $ US | 209 119 911 991 $ US |
| 1995 | 4 840 440 189 $ US | 199 747 158 263 $ US |
| 1994 | 4 135 300 811 $ US | 183 320 152 314 $ US |
| 1993 | 3 516 494 865 $ US | 168 552 050 229 $ US |
| 1992 | 4 025 942 838 $ US | 157 743 857 036 $ US |
| 1991 | 7 067 591 647 $ US | 152 336 562 800 $ US |
| 1990 | 11 708 950 532 $ US | 148 543 023 654 $ US |
| 1989 | 12 096 964 757 $ US | 141 918 074 324 $ US |
| 1988 | 11 837 456 728 $ US | 128 938 815 308 $ US |
| 1987 | 11 073 229 683 $ US | 107 690 045 249 $ US |
| 1986 | 10 606 362 971 $ US | 98 835 552 357 $ US |
| 1985 | 10 307 791 680 $ US | 92 626 876 602 $ US |
| 1984 | 10 603 443 142 $ US | 87 539 186 163 $ US |
| 1983 | 9 765 161 118 $ US | 74 471 762 415 $ US |
| 1982 | 9 251 183 529 $ US | 67 407 797 682 $ US |
| 1981 | 8 905 963 976 $ US | 79 017 432 647 $ US |
| 1980 | 8 817 697 500 $ US | 70 921 142 662 $ US |
| 1979 | 8 645 207 123 $ US | 63 191 053 440 $ US |
| 1978 | 7 878 465 455 $ US | 53 336 547 734 $ US |
| 1977 | 6 276 949 157 $ US | 48 954 395 863 $ US |
| 1976 | 6 093 814 738 $ US | 46 807 302 231 $ US |
| 1975 | 5 756 838 293 $ US | 41 679 119 151 $ US |
| 1974 | 5 038 233 171 $ US | 38 774 028 630 $ US |
| 1973 | 4 412 339 083 $ US | 28 460 153 985 $ US |
| 1972 | 3 594 369 360 $ US | 23 413 476 109 $ US |
| 1971 | 3 055 095 900 $ US | 19 613 784 908 $ US |
| 1970 | 2 515 236 800 $ US | 17 327 973 969 $ US |
| 1969 | - | 16 708 226 654 $ US |
| 1968 | - | 14 340 936 627 $ US |
| 1967 | - | 12 634 558 505 $ US |
| 1966 | - | 11 787 616 836 $ US |
| 1965 | - | 10 166 208 353 $ US |
| 1964 | - | 8 918 902 585 $ US |
| 1963 | - | 7 854 369 043 $ US |
| 1962 | - | 7 594 733 340 $ US |
| 1961 | - | 7 480 255 449 $ US |
Les importations de biens et services de Cuba s'élèvent à 8,07 milliards de dollars (2020), et celles du Canada à 747 milliards de dollars (2025). En 1970, les importations du Canada étaient 6,9 fois plus élevées : 2,52 milliards de dollars pour Cuba et 17,3 milliards de dollars pour le Canada.
Les importations de biens et services du Canada sont supérieures à celles de Cuba chaque année depuis 1970.
Cuba vs Canada : chiffres des importations
|
Cuba
|
Canada
|
|
|---|---|---|
| Importations | 8,07 Md $US (2020) | 747 Md $US (2025) |
| Rang mondial | 124/174 | 12/174 |
| Part mondiale | 0,04 % | 2,21 % |
| % du PIB | 7,5 % | 32,2 % |
| Première catégorie de biens | Pétrole, gaz, minerais et autres matières premières (38,5 %, 2022) | Machines, électronique et véhicules (45,2 %, 2025) |
| Première origine des biens | Chine (11,5 %, 2022) | États-Unis (45,9 %, 2025) |
Comparer les importations de 2 pays au choix
Sources :
- Banque mondiale | Économie et croissance (1961–2025, mis à jour en octobre 2026)
- TradeMap (2001–2025, mis à jour en octobre 2026)
Creative Commons Attribution (CC BY) : vous pouvez copier, partager, adapter et réutiliser ce contenu, y compris à des fins commerciales, à condition de citer statistics.wiki et d’indiquer les modifications apportées. Les sources citées ci-dessus peuvent avoir leurs propres conditions de licence.