
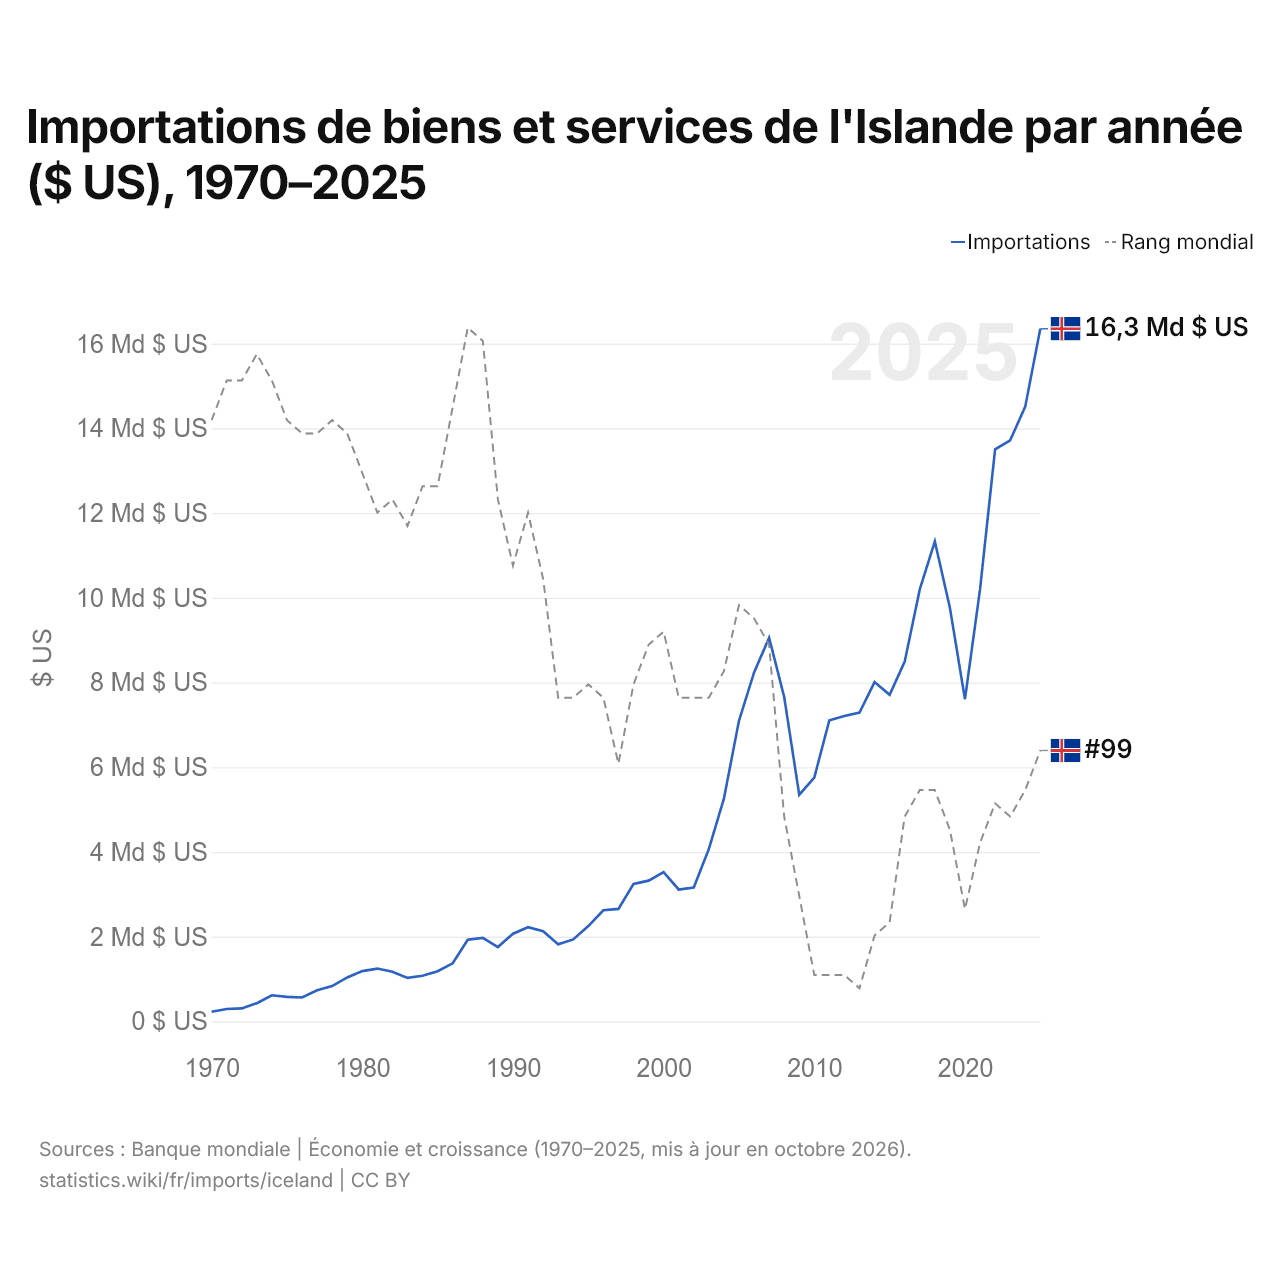
Importations de biens et services de l'Islande par année ($ US), 1970–2025
| Année | $ US | Rang mondial |
|---|---|---|
| Importations | Rang mondial | |
| 2025 | 16 348 934 321 $ US | #99 |
| 2024 | 14 510 626 908 $ US | #102 |
| 2023 | 13 715 643 196 $ US | #104 |
| 2022 | 13 505 975 928 $ US | #103 |
| 2021 | 10 196 648 319 $ US | #106 |
| 2020 | 7 605 549 122 $ US | #111 |
| 2019 | 9 764 032 621 $ US | #105 |
| 2018 | 11 328 152 833 $ US | #102 |
| 2017 | 10 196 309 115 $ US | #102 |
| 2016 | 8 490 620 818 $ US | #104 |
| 2015 | 7 709 275 099 $ US | #112 |
| 2014 | 8 010 515 430 $ US | #113 |
| 2013 | 7 289 463 604 $ US | #117 |
| 2012 | 7 210 160 315 $ US | #116 |
| 2011 | 7 108 322 148 $ US | #116 |
| 2010 | 5 755 787 173 $ US | #116 |
| 2009 | 5 350 549 845 $ US | #110 |
| 2008 | 7 661 403 285 $ US | #104 |
| 2007 | 9 057 418 952 $ US | #91 |
| 2006 | 8 231 507 894 $ US | #89 |
| 2005 | 7 093 787 735 $ US | #88 |
| 2004 | 5 256 645 900 $ US | #93 |
| 2003 | 4 066 221 669 $ US | #95 |
| 2002 | 3 160 502 456 $ US | #95 |
| 2001 | 3 112 265 208 $ US | #95 |
| 2000 | 3 520 829 004 $ US | #90 |
| 1999 | 3 320 939 762 $ US | #91 |
| 1998 | 3 241 180 130 $ US | #94 |
| 1997 | 2 654 797 382 $ US | #100 |
| 1996 | 2 621 869 173 $ US | #95 |
| 1995 | 2 247 449 055 $ US | #94 |
| 1994 | 1 933 731 893 $ US | #95 |
| 1993 | 1 820 239 057 $ US | #95 |
| 1992 | 2 126 363 946 $ US | #86 |
| 1991 | 2 222 220 478 $ US | #81 |
| 1990 | 2 067 695 843 $ US | #85 |
| 1989 | 1 753 605 111 $ US | #80 |
| 1988 | 1 970 826 754 $ US | #68 |
| 1987 | 1 927 004 902 $ US | #67 |
| 1986 | 1 369 556 639 $ US | #73 |
| 1985 | 1 181 924 655 $ US | #79 |
| 1984 | 1 077 216 892 $ US | #79 |
| 1983 | 1 025 825 471 $ US | #82 |
| 1982 | 1 169 312 796 $ US | #80 |
| 1981 | 1 245 839 816 $ US | #81 |
| 1980 | 1 185 819 785 $ US | #78 |
| 1979 | 1 037 270 278 $ US | #75 |
| 1978 | 832 986 611 $ US | #74 |
| 1977 | 735 436 717 $ US | #75 |
| 1976 | 563 608 168 $ US | #75 |
| 1975 | 578 989 590 $ US | #74 |
| 1974 | 615 641 821 $ US | #71 |
| 1973 | 429 005 880 $ US | #69 |
| 1972 | 305 401 088 $ US | #71 |
| 1971 | 290 564 773 $ US | #71 |
| 1970 | 225 194 318 $ US | #74 |
En 2025, les importations de biens et services de l'Islande s'élevaient à 16,3 milliards de dollars, contre 225 millions de dollars en 1970. Elles se classaient au 99e rang mondial, en hausse par rapport au 102e rang en 2024. Leur meilleur rang a été le 67e, occupé pour la dernière fois en 1987.
En 2025, les importations de biens et services de l'Islande étaient les 36es plus élevées de 41 pays situés en Europe. En 2025, les importations de l'Islande dépassaient ses exportations de 872 millions de dollars, soit un déficit commercial. Le commerce de l'Islande, exportations et importations réunies, équivalait à 82,5 % de son PIB en 2025, au 85e rang mondial.
Importations de biens de l'Islande par catégorie, 2025
Importations de biens, 2025: 11,0 Md $US
En 2025, la première catégorie des importations de biens de l'Islande était « machines, électronique et véhicules », avec 44,6 %, suivie de « pétrole, gaz, minerais et autres matières premières », avec 18,6 %.
Origines des importations de biens de l'Islande : les 10 premières, 2025
| Rang | Pays | Importations de biens | Part | |
|---|---|---|---|---|
| 1 |
 Chine |
1,30 Md $US | 11,8 % | |
| 2 |
 Norvège |
1,07 Md $US | 9,79 % | vs Norvège |
| 3 |
 Allemagne |
943 M $US | 8,59 % | |
| 4 |
 États-Unis |
754 M $US | 6,87 % | |
| 5 |
 Danemark |
647 M $US | 5,9 % | |
| 6 |
 Pays-Bas |
559 M $US | 5,09 % | |
| 7 |
 Suède |
448 M $US | 4,08 % | |
| 8 |
 Royaume-Uni |
394 M $US | 3,59 % | |
| 9 |
 Pologne |
298 M $US | 2,71 % | |
| 10 |
 Italie |
278 M $US | 2,53 % | |
| Autres partenaires et non précisés | 4,28 Md $US | 39 % |
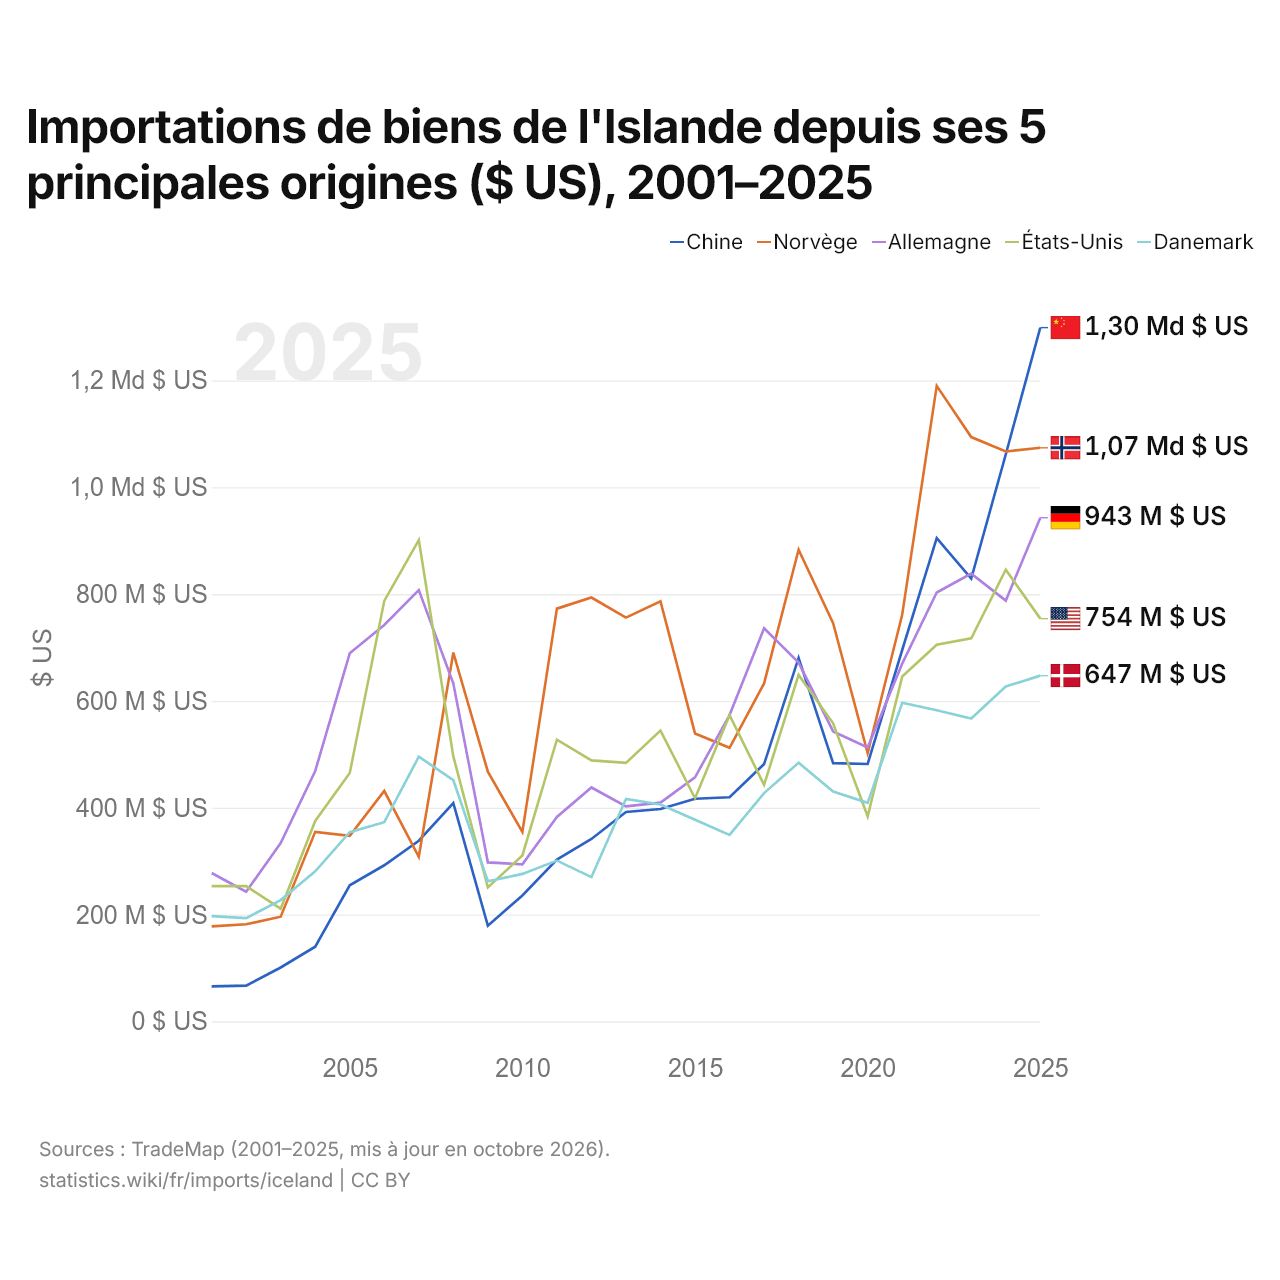
Importations de biens de l'Islande depuis ses 5 principales origines ($ US), 2001–2025
| Année | $ US | ||||
|---|---|---|---|---|---|
| Chine | Norvège | Allemagne | États-Unis | Danemark | |
| 2025 | 1 298 972 000 $ US | 1 073 958 000 $ US | 942 933 000 $ US | 753 992 000 $ US | 647 333 000 $ US |
| 2024 | 1 061 809 000 $ US | 1 067 029 000 $ US | 787 802 000 $ US | 845 771 000 $ US | 626 938 000 $ US |
| 2023 | 829 070 000 $ US | 1 093 925 000 $ US | 838 424 000 $ US | 717 158 000 $ US | 566 890 000 $ US |
| 2022 | 904 935 000 $ US | 1 189 906 000 $ US | 802 967 000 $ US | 705 308 000 $ US | 582 384 000 $ US |
| 2021 | 695 256 000 $ US | 761 315 000 $ US | 669 785 000 $ US | 645 568 000 $ US | 596 520 000 $ US |
| 2020 | 481 910 000 $ US | 502 155 000 $ US | 512 867 000 $ US | 383 936 000 $ US | 409 134 000 $ US |
| 2019 | 483 334 000 $ US | 745 390 000 $ US | 542 787 000 $ US | 558 030 000 $ US | 430 217 000 $ US |
| 2018 | 680 593 000 $ US | 883 011 000 $ US | 671 806 000 $ US | 648 806 000 $ US | 484 169 000 $ US |
| 2017 | 481 712 000 $ US | 632 719 000 $ US | 736 094 000 $ US | 442 678 000 $ US | 427 387 000 $ US |
| 2016 | 419 535 000 $ US | 512 219 000 $ US | 573 353 000 $ US | 573 272 000 $ US | 349 173 000 $ US |
| 2015 | 416 717 000 $ US | 539 022 000 $ US | 456 946 000 $ US | 417 645 000 $ US | 377 623 000 $ US |
| 2014 | 397 511 000 $ US | 786 338 000 $ US | 409 441 000 $ US | 544 433 000 $ US | 406 122 000 $ US |
| 2013 | 391 969 000 $ US | 755 964 000 $ US | 402 361 000 $ US | 483 898 000 $ US | 416 484 000 $ US |
| 2012 | 341 503 000 $ US | 793 497 000 $ US | 437 938 000 $ US | 488 672 000 $ US | 270 062 000 $ US |
| 2011 | 303 031 000 $ US | 772 790 000 $ US | 382 595 000 $ US | 527 434 000 $ US | 300 987 000 $ US |
| 2010 | 235 665 000 $ US | 354 482 000 $ US | 293 951 000 $ US | 310 546 000 $ US | 276 007 000 $ US |
| 2009 | 179 032 000 $ US | 467 459 000 $ US | 297 664 000 $ US | 250 769 000 $ US | 262 172 000 $ US |
| 2008 | 408 598 000 $ US | 690 507 000 $ US | 632 707 000 $ US | 496 065 000 $ US | 451 547 000 $ US |
| 2007 | 338 127 000 $ US | 308 081 000 $ US | 807 405 000 $ US | 901 312 000 $ US | 495 578 000 $ US |
| 2006 | 292 224 000 $ US | 431 267 000 $ US | 742 146 000 $ US | 787 225 000 $ US | 372 820 000 $ US |
| 2005 | 254 697 000 $ US | 347 484 000 $ US | 689 215 000 $ US | 464 921 000 $ US | 354 101 000 $ US |
| 2004 | 139 805 000 $ US | 354 838 000 $ US | 468 664 000 $ US | 375 338 000 $ US | 280 935 000 $ US |
| 2003 | 100 767 000 $ US | 195 929 000 $ US | 333 906 000 $ US | 210 867 000 $ US | 226 997 000 $ US |
| 2002 | 66 937 000 $ US | 181 795 000 $ US | 242 736 000 $ US | 253 132 000 $ US | 193 333 000 $ US |
| 2001 | 65 554 000 $ US | 177 854 000 $ US | 277 687 000 $ US | 253 100 000 $ US | 196 900 000 $ US |
En 2025, les importations de biens s'élevaient à 1,3 milliard de dollars en provenance de la Chine, 1,07 milliard de dollars en provenance de la Norvège, 943 millions de dollars en provenance de l'Allemagne, 754 millions de dollars en provenance des États-Unis et 647 millions de dollars en provenance du Danemark. Le changement le plus récent dans leur ordre remonte à 2025, quand les importations de l'Islande en provenance de la Chine ont dépassé celles en provenance de la Norvège.
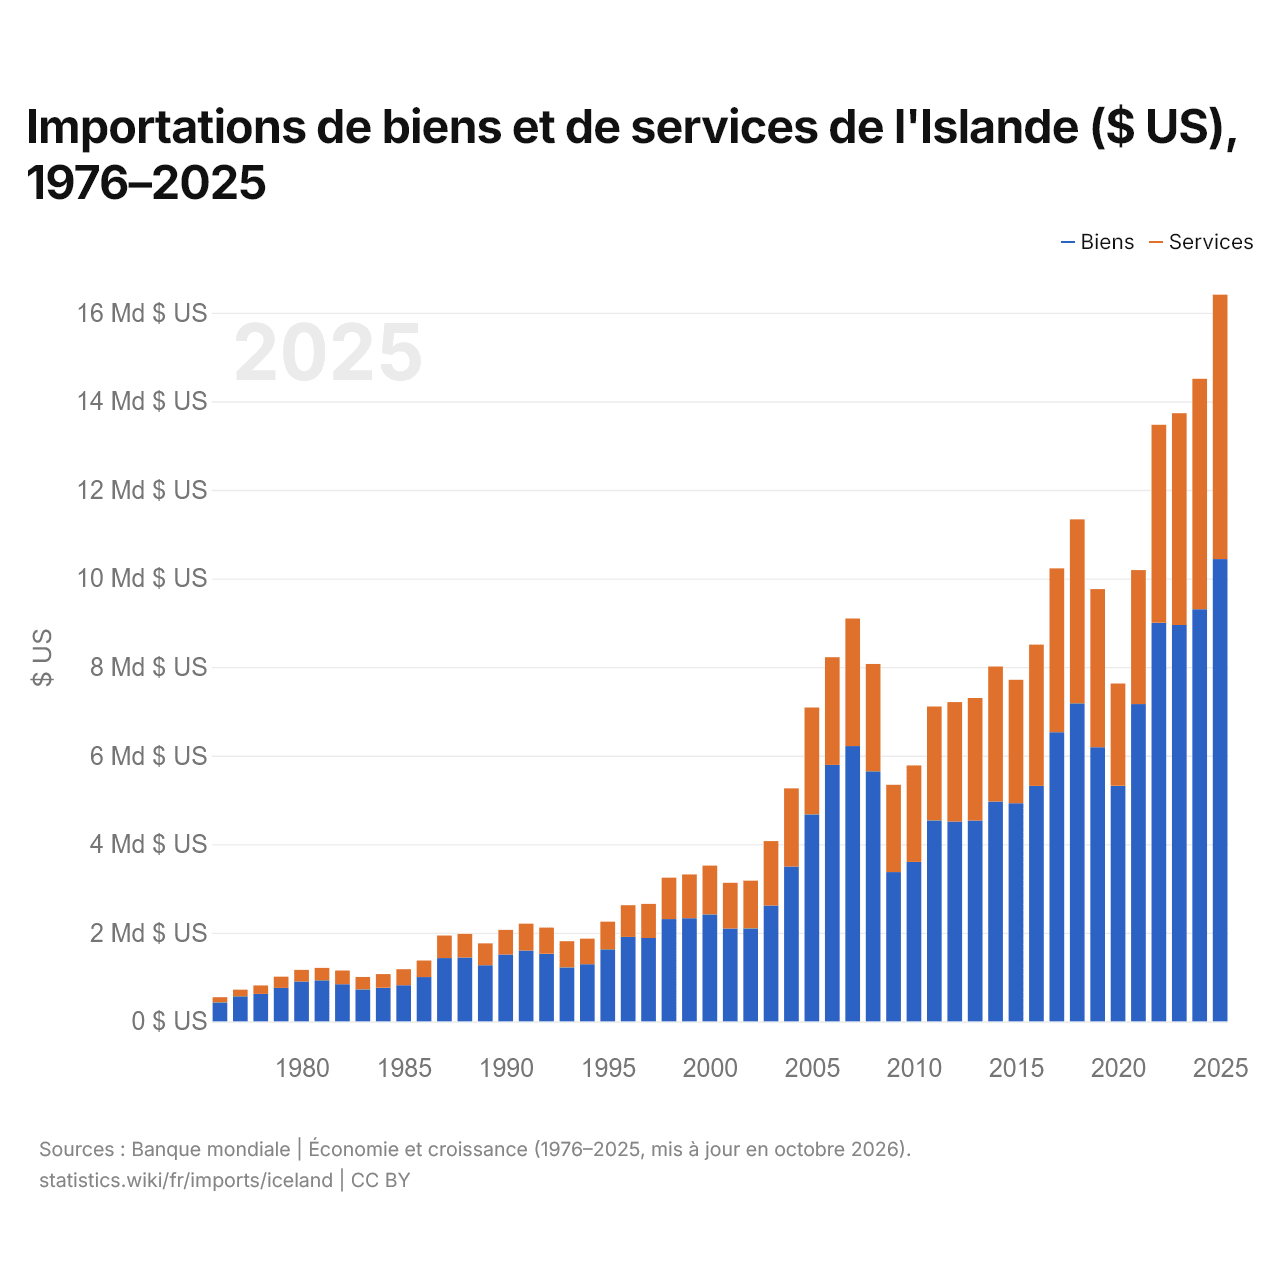
Importations de biens et de services de l'Islande ($ US), 1976–2025
| Année | $ US | |
|---|---|---|
| Biens | Services | |
| 2025 | 10 436 633 414 $ US | 5 970 973 355 $ US |
| 2024 | 9 304 462 211 $ US | 5 204 199 672 $ US |
| 2023 | 8 948 697 779 $ US | 4 782 920 183 $ US |
| 2022 | 8 999 125 595 $ US | 4 470 137 407 $ US |
| 2021 | 7 164 002 674 $ US | 3 026 024 350 $ US |
| 2020 | 5 317 369 797 $ US | 2 308 960 151 $ US |
| 2019 | 6 190 952 540 $ US | 3 568 869 721 $ US |
| 2018 | 7 180 230 691 $ US | 4 153 043 928 $ US |
| 2017 | 6 526 808 057 $ US | 3 700 646 186 $ US |
| 2016 | 5 316 034 440 $ US | 3 190 526 203 $ US |
| 2015 | 4 926 214 130 $ US | 2 785 143 615 $ US |
| 2014 | 4 961 134 295 $ US | 3 051 581 485 $ US |
| 2013 | 4 533 064 677 $ US | 2 767 460 063 $ US |
| 2012 | 4 510 352 935 $ US | 2 698 063 102 $ US |
| 2011 | 4 537 281 083 $ US | 2 569 969 975 $ US |
| 2010 | 3 599 441 220 $ US | 2 178 442 916 $ US |
| 2009 | 3 368 874 354 $ US | 1 972 185 233 $ US |
| 2008 | 5 644 842 167 $ US | 2 424 156 454 $ US |
| 2007 | 6 215 585 838 $ US | 2 880 036 249 $ US |
| 2006 | 5 790 610 698 $ US | 2 430 186 797 $ US |
| 2005 | 4 672 427 060 $ US | 2 414 592 579 $ US |
| 2004 | 3 497 254 628 $ US | 1 764 266 350 $ US |
| 2003 | 2 615 415 626 $ US | 1 453 994 179 $ US |
| 2002 | 2 098 348 370 $ US | 1 078 969 331 $ US |
| 2001 | 2 097 302 647 $ US | 1 030 047 742 $ US |
| 2000 | 2 414 538 372 $ US | 1 102 090 671 $ US |
| 1999 | 2 327 958 190 $ US | 989 038 204 $ US |
| 1998 | 2 309 316 424 $ US | 933 556 889 $ US |
| 1997 | 1 881 790 216 $ US | 770 703 033 $ US |
| 1996 | 1 906 209 960 $ US | 714 499 454 $ US |
| 1995 | 1 625 749 037 $ US | 623 768 894 $ US |
| 1994 | 1 288 161 103 $ US | 577 304 243 $ US |
| 1993 | 1 217 856 185 $ US | 591 504 271 $ US |
| 1992 | 1 526 993 436 $ US | 589 773 568 $ US |
| 1991 | 1 599 335 865 $ US | 605 396 499 $ US |
| 1990 | 1 509 237 078 $ US | 555 861 965 $ US |
| 1989 | 1 267 300 000 $ US | 494 800 000 $ US |
| 1988 | 1 439 400 000 $ US | 535 600 000 $ US |
| 1987 | 1 428 200 000 $ US | 509 900 000 $ US |
| 1986 | 1 000 000 000 $ US | 373 600 000 $ US |
| 1985 | 814 300 000 $ US | 362 900 000 $ US |
| 1984 | 756 600 000 $ US | 310 900 000 $ US |
| 1983 | 721 600 000 $ US | 280 700 000 $ US |
| 1982 | 837 600 000 $ US | 308 500 000 $ US |
| 1981 | 925 500 000 $ US | 282 000 000 $ US |
| 1980 | 899 900 000 $ US | 262 800 000 $ US |
| 1979 | 754 100 000 $ US | 253 500 000 $ US |
| 1978 | 618 400 000 $ US | 192 100 000 $ US |
| 1977 | 564 700 000 $ US | 149 800 000 $ US |
| 1976 | 427 900 000 $ US | 117 200 000 $ US |
En 2025, les importations de biens de l'Islande s'élevaient à 10,4 milliards de dollars et celles de services à 5,97 milliards de dollars ; les services représentaient 36,4 % du total, contre 21,5 % en 1976.
L'Islande dans le classement mondial des importations, 2025







Importations de biens et services de l'Islande, % du PIB, 1970–2025
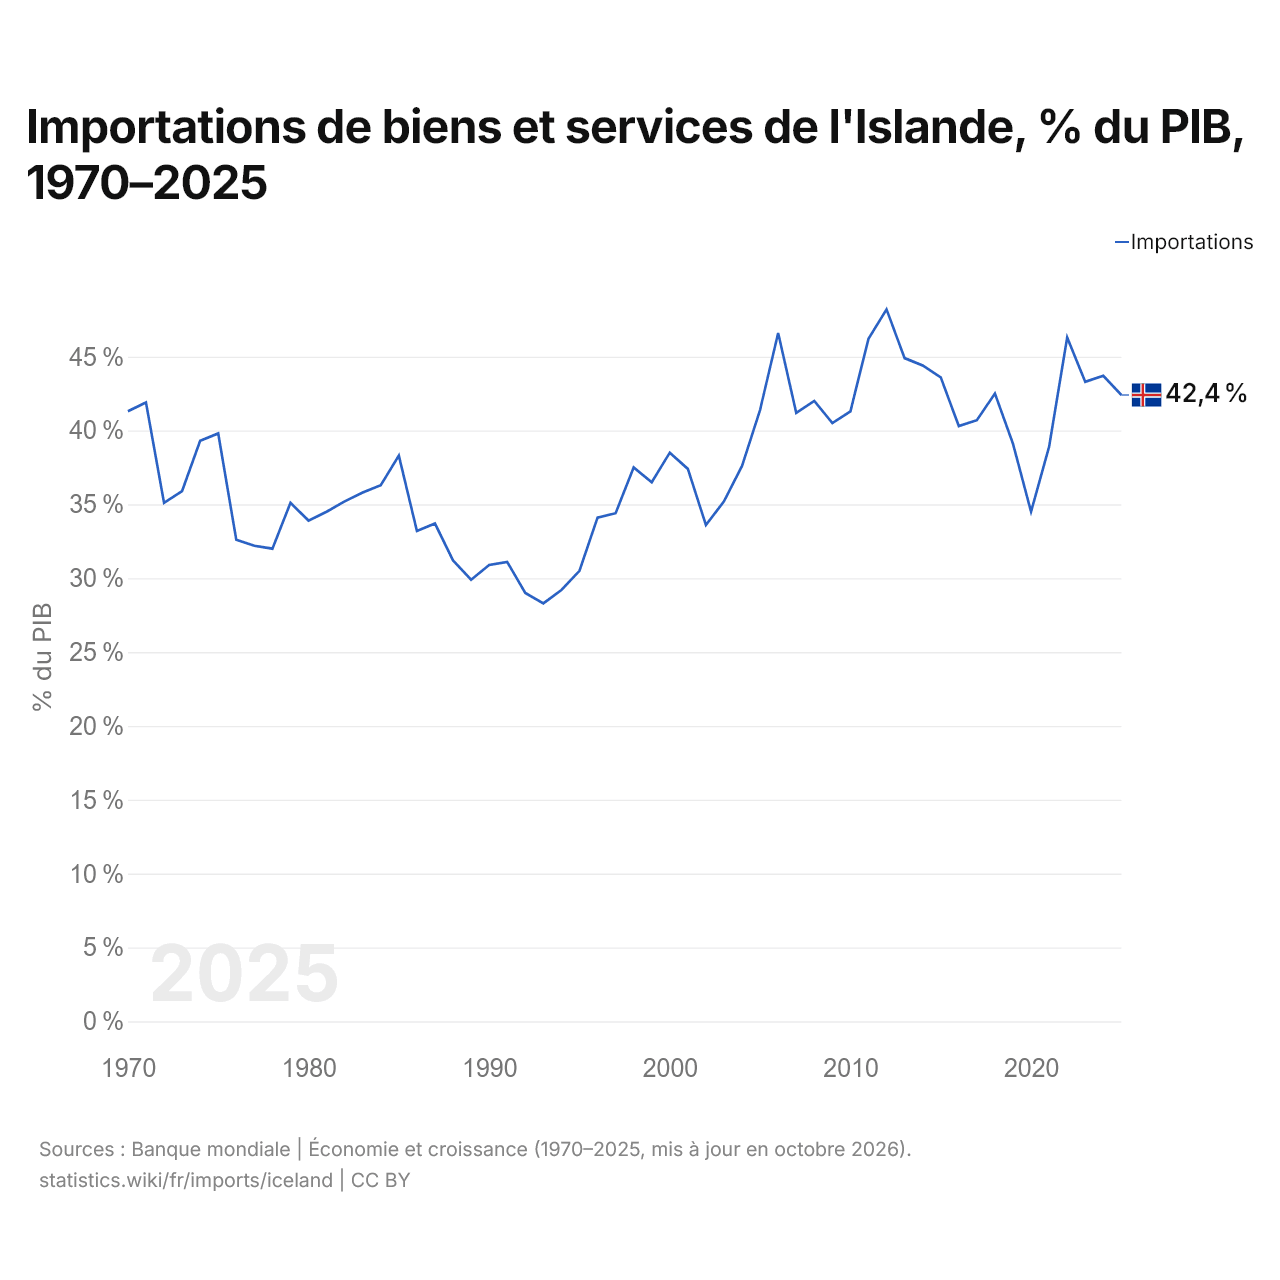
En 2025, les importations de biens et services de l'Islande équivalaient à 42,4 % de son PIB, contre 41,3 % en 1970. La part la plus élevée a été de 48,2 %, en 2012.
Comparer les importations de l'Islande avec celles d'autres pays
Sources :
- TradeMap (2001–2025, mis à jour en octobre 2026)
- Banque mondiale | Économie et croissance (1970–2025, mis à jour en octobre 2026)
Creative Commons Attribution (CC BY) : vous pouvez copier, partager, adapter et réutiliser ce contenu, y compris à des fins commerciales, à condition de citer statistics.wiki et d’indiquer les modifications apportées. Les sources citées ci-dessus peuvent avoir leurs propres conditions de licence.