
Importations de biens et services des Bahamas par année ($ US)
| Année | $ US | Rang mondial |
|---|---|---|
| Importations | Rang mondial | |
| 2024 | 6 564 100 000 $ US | #132 |
| 2023 | 5 915 800 000 $ US | #134 |
| 2022 | 5 395 300 000 $ US | #134 |
| 2021 | 4 569 400 000 $ US | #137 |
| 2020 | 3 124 200 000 $ US | #145 |
| 2019 | 4 488 400 000 $ US | #138 |
| 2018 | 4 730 600 000 $ US | #134 |
| 2017 | 4 556 600 000 $ US | #133 |
| 2016 | 4 082 400 000 $ US | #134 |
| 2015 | 4 006 600 000 $ US | #134 |
| 2014 | 4 809 200 000 $ US | #132 |
| 2013 | 4 681 600 000 $ US | #135 |
| 2012 | 4 944 700 000 $ US | #132 |
| 2011 | 5 125 700 000 $ US | #127 |
| 2010 | 4 414 100 000 $ US | #123 |
| 2009 | 4 225 400 000 $ US | #120 |
| 2008 | 5 045 700 000 $ US | #118 |
| 2007 | 5 088 400 000 $ US | #111 |
| 2006 | 5 006 500 000 $ US | #101 |
| 2005 | 4 193 800 000 $ US | #101 |
| 2004 | 3 421 700 000 $ US | #105 |
| 2003 | 3 127 000 000 $ US | #100 |
| 2002 | 3 028 700 000 $ US | #98 |
| 2001 | 3 196 400 000 $ US | #94 |
| 2000 | 3 359 600 000 $ US | #91 |
| 1999 | 3 015 600 000 $ US | #95 |
| 1998 | 2 943 000 000 $ US | #95 |
| 1997 | 2 713 700 000 $ US | #98 |
| 1996 | 2 086 690 000 $ US | #100 |
| 1995 | 1 883 080 000 $ US | #103 |
| 1994 | 1 739 670 000 $ US | #96 |
| 1993 | 1 589 080 000 $ US | #99 |
| 1992 | 1 592 260 000 $ US | #99 |
| 1991 | 1 716 350 000 $ US | #94 |
| 1990 | 1 771 670 000 $ US | #92 |
| 1989 | 1 750 510 000 $ US | #81 |
| 1988 | - | - |
| 1987 | 1 514 500 000 $ US | #77 |
| 1986 | 1 431 700 000 $ US | #72 |
| 1985 | 1 375 500 000 $ US | #71 |
| 1984 | 1 190 100 000 $ US | #78 |
| 1983 | 1 005 300 000 $ US | #83 |
| 1982 | 939 900 000 $ US | #85 |
| 1981 | 889 700 000 $ US | #86 |
| 1980 | 839 600 000 $ US | #87 |
| 1979 | 686 200 000 $ US | #81 |
| 1978 | 562 000 000 $ US | #82 |
| 1977 | 471 600 000 $ US | #82 |
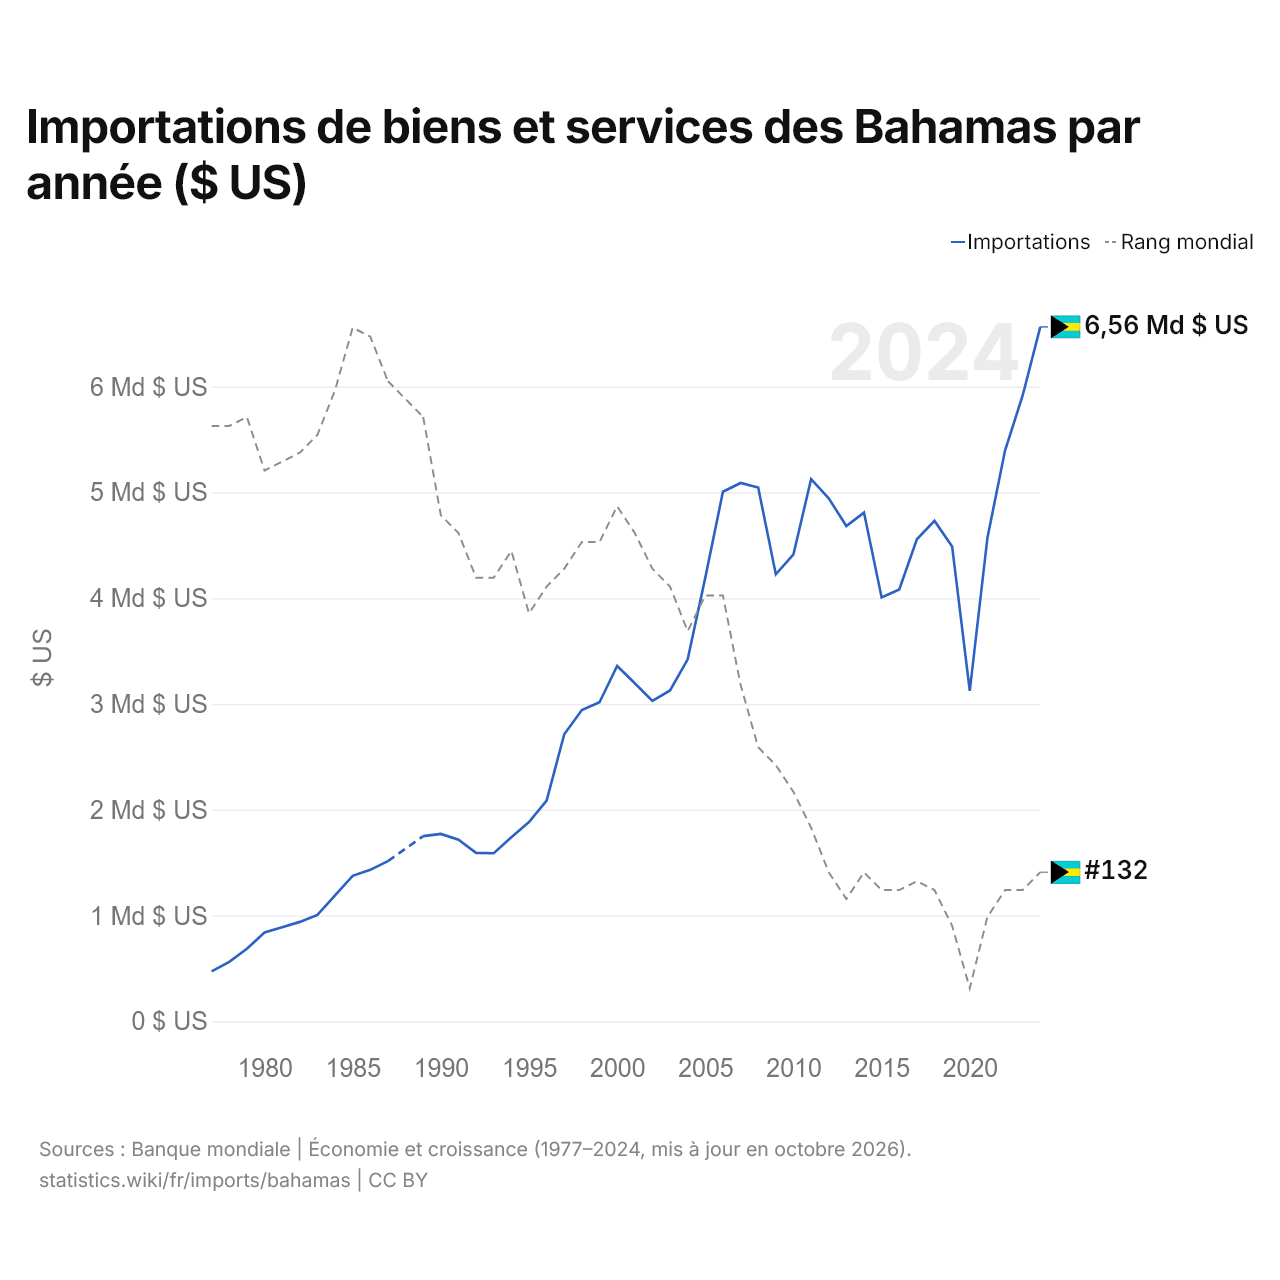
Les importations de biens et services des Bahamas s'élèvent à 6,56 milliards de dollars (2024), contre 472 millions de dollars en 1977. Elles se classent au 132e rang mondial, en hausse par rapport au 134e rang l'année précédente. Leur meilleur rang a été le 71e, occupé pour la dernière fois en 1985.
Les importations de biens et services des Bahamas sont les 21es plus élevées de 26 pays situés en Amérique latine. Les importations des Bahamas dépassent leurs exportations de 582 millions de dollars, soit un déficit commercial (2024). Le commerce des Bahamas, exportations et importations réunies, équivaut à 79,2 % de leur PIB (2024), au 91e rang mondial.
Importations de biens des Bahamas par catégorie, 2025
Importations de biens, 2025: 5,11 Md $US
En 2025, la première catégorie des importations de biens des Bahamas était « machines, électronique et véhicules », avec 28,6 %, suivie de « pétrole, gaz, minerais et autres matières premières », avec 14,3 %.
Origines des importations de biens des Bahamas : les 10 premières, 2025
| Rang | Pays | Importations de biens | Part | |
|---|---|---|---|---|
| 1 |
 États-Unis |
4,20 Md $US | 82,2 % | |
| 2 |
 Chine |
138 M $US | 2,71 % | |
| 3 |
 Japon |
58,6 M $US | 1,15 % | |
| 4 |
 Panama |
57,7 M $US | 1,13 % | |
| 5 |
 Royaume-Uni |
46,4 M $US | 0,91 % | |
| 6 |
 Suisse |
40,2 M $US | 0,79 % | |
| 7 |
 Mexique |
34,3 M $US | 0,67 % | |
| 8 |
 Canada |
33,8 M $US | 0,66 % | vs Canada |
| 9 |
 Allemagne |
28,4 M $US | 0,56 % | |
| 10 |
 Finlande |
27,4 M $US | 0,54 % | |
| Autres partenaires et non précisés | 446 M $US | 8,72 % |
Importations de biens des Bahamas depuis leurs 5 principales origines ($ US), 2001–2025
| Année | $ US | ||||
|---|---|---|---|---|---|
| États-Unis | Chine | Japon | Panama | Royaume-Uni | |
| 2025 | 4 196 690 000 $ US | 138 221 000 $ US | 58 568 000 $ US | 57 695 000 $ US | 46 411 000 $ US |
| 2024 | 4 130 611 000 $ US | 123 830 000 $ US | 67 476 000 $ US | 38 414 000 $ US | 29 773 000 $ US |
| 2023 | 3 508 919 000 $ US | 72 831 000 $ US | 34 356 000 $ US | 33 963 000 $ US | 23 318 000 $ US |
| 2022 | 3 181 295 000 $ US | 72 042 000 $ US | 34 214 000 $ US | 25 648 000 $ US | 22 820 000 $ US |
| 2021 | 2 952 597 000 $ US | 49 437 000 $ US | 27 142 000 $ US | 23 629 000 $ US | 24 135 000 $ US |
| 2020 | 1 759 046 000 $ US | 34 023 000 $ US | 21 871 000 $ US | 15 161 000 $ US | 17 665 000 $ US |
| 2019 | 2 701 886 000 $ US | 24 409 000 $ US | 29 221 000 $ US | 22 883 000 $ US | 41 426 000 $ US |
| 2018 | 2 954 387 000 $ US | 53 827 000 $ US | 36 610 000 $ US | 27 520 000 $ US | 50 630 000 $ US |
| 2017 | 2 879 942 000 $ US | 31 111 000 $ US | 54 204 000 $ US | 31 966 000 $ US | 21 233 000 $ US |
| 2016 | 2 454 583 000 $ US | 24 787 000 $ US | 51 364 000 $ US | 34 104 000 $ US | 22 526 000 $ US |
| 2015 | 2 587 937 000 $ US | 25 901 000 $ US | 35 808 000 $ US | 25 169 000 $ US | 20 818 000 $ US |
| 2014 | 3 250 890 000 $ US | 27 062 000 $ US | 28 746 000 $ US | 15 780 000 $ US | 23 377 000 $ US |
| 2013 | 3 005 692 000 $ US | 17 612 000 $ US | 42 838 000 $ US | 10 921 000 $ US | 14 145 000 $ US |
| 2012 | 3 080 818 000 $ US | 60 287 000 $ US | 31 296 000 $ US | 11 624 000 $ US | 17 475 000 $ US |
| 2011 | 3 032 520 000 $ US | 6 006 000 $ US | 19 482 000 $ US | 15 031 000 $ US | 18 743 000 $ US |
| 2010 | 2 600 098 000 $ US | - | 13 261 000 $ US | 16 012 000 $ US | 12 933 000 $ US |
| 2009 | 2 451 893 000 $ US | - | 10 357 000 $ US | 7 412 000 $ US | 6 949 000 $ US |
| 2008 | 2 817 876 000 $ US | - | 26 322 000 $ US | 7 964 000 $ US | 13 952 000 $ US |
| 2007 | 2 744 728 000 $ US | 530 000 $ US | 33 214 000 $ US | 9 885 000 $ US | 16 651 000 $ US |
| 2006 | 2 615 164 000 $ US | - | 35 081 000 $ US | 13 234 000 $ US | 10 426 000 $ US |
| 2005 | 2 204 921 000 $ US | 401 000 $ US | 30 288 000 $ US | 12 556 000 $ US | 14 881 000 $ US |
| 2004 | 1 743 553 000 $ US | 358 000 $ US | 23 927 000 $ US | 5 496 000 $ US | 11 023 000 $ US |
| 2003 | 1 617 107 000 $ US | 627 000 $ US | 22 495 000 $ US | 5 486 000 $ US | 16 523 000 $ US |
| 2002 | 1 673 895 000 $ US | 4 387 000 $ US | 18 797 000 $ US | 5 651 000 $ US | 8 732 000 $ US |
| 2001 | 1 605 458 000 $ US | 619 000 $ US | 22 634 000 $ US | 4 288 000 $ US | 9 871 000 $ US |
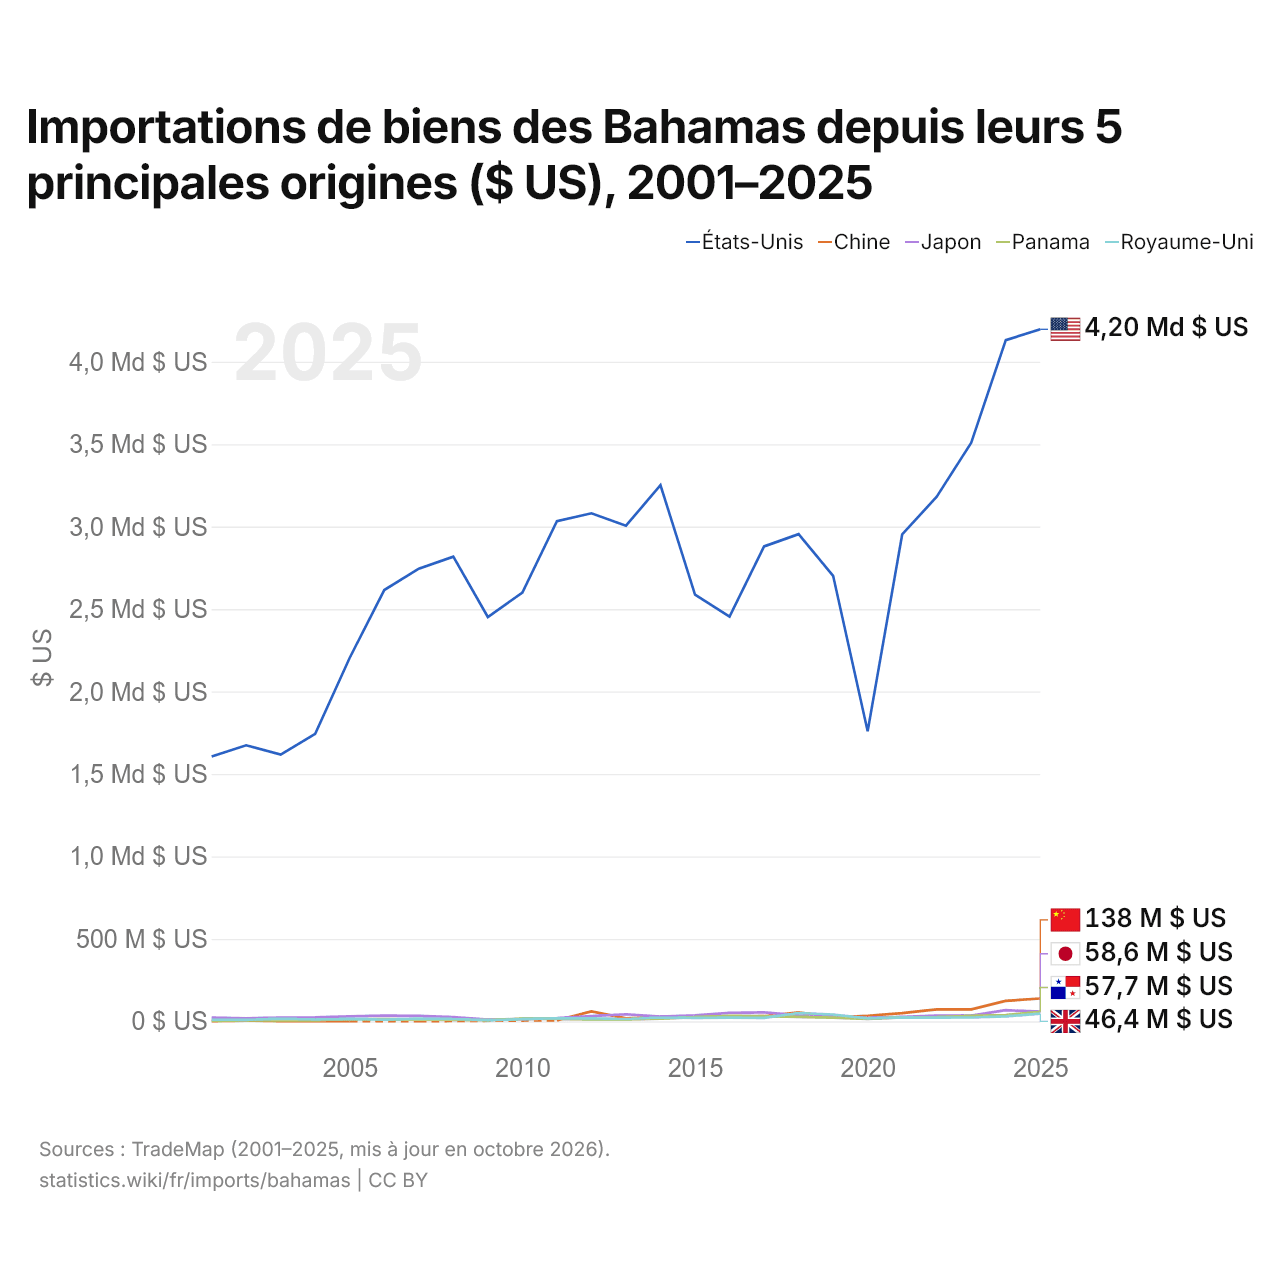
En 2025, les importations de biens s'élevaient à 4,2 milliards de dollars en provenance des États-Unis, 138 millions de dollars en provenance de la Chine, 58,6 millions de dollars en provenance du Japon, 57,7 millions de dollars en provenance du Panama et 46,4 millions de dollars en provenance du Royaume-Uni. Le premier rang des cinq fournisseurs des Bahamas est occupé par les États-Unis chaque année depuis 2001. Le changement le plus récent dans leur ordre remonte à 2022, quand les importations des Bahamas en provenance du Panama ont dépassé celles en provenance du Royaume-Uni.
Importations de biens et de services des Bahamas ($ US)
| Année | $ US | |
|---|---|---|
| Biens | Services | |
| 2024 | 4 595 812 200 $ US | 2 472 835 226 $ US |
| 2023 | 4 074 795 545 $ US | 2 198 028 602 $ US |
| 2022 | 3 879 249 640 $ US | 1 963 424 213 $ US |
| 2021 | 3 264 220 363 $ US | 1 682 931 370 $ US |
| 2020 | 2 023 990 102 $ US | 1 386 810 937 $ US |
| 2019 | 3 009 200 306 $ US | 1 830 415 287 $ US |
| 2018 | 3 316 814 472 $ US | 1 799 488 920 $ US |
| 2017 | 3 109 004 930 $ US | 1 812 461 442 $ US |
| 2016 | 2 631 619 793 $ US | 1 835 538 826 $ US |
| 2015 | 2 954 035 033 $ US | 1 277 858 820 $ US |
| 2014 | 3 344 241 610 $ US | 1 727 820 968 $ US |
| 2013 | 3 165 946 000 $ US | 1 628 266 000 $ US |
| 2012 | 3 385 465 000 $ US | 1 537 661 000 $ US |
| 2011 | 2 965 656 000 $ US | 1 292 417 000 $ US |
| 2010 | 2 591 499 000 $ US | 1 181 098 000 $ US |
| 2009 | 2 535 793 000 $ US | 1 196 063 000 $ US |
| 2008 | 3 199 041 000 $ US | 1 402 901 975 $ US |
| 2007 | 2 956 922 389 $ US | 1 579 589 808 $ US |
| 2006 | 2 766 500 000 $ US | 1 610 870 000 $ US |
| 2005 | 2 377 432 028 $ US | 1 286 409 095 $ US |
| 2004 | 1 906 820 000 $ US | 1 231 300 000 $ US |
| 2003 | 1 758 560 000 $ US | 1 092 420 000 $ US |
| 2002 | 1 749 032 786 $ US | 1 016 149 313 $ US |
| 2001 | 1 804 200 000 $ US | 973 200 000 $ US |
| 2000 | 1 983 100 000 $ US | 1 025 680 000 $ US |
| 1999 | 1 677 200 000 $ US | 933 600 000 $ US |
| 1998 | 1 737 100 000 $ US | 990 900 000 $ US |
| 1997 | 1 410 700 000 $ US | 836 000 000 $ US |
| 1996 | 1 287 400 000 $ US | 715 800 000 $ US |
| 1995 | 1 156 700 000 $ US | 639 100 000 $ US |
| 1994 | 1 013 800 000 $ US | 627 200 000 $ US |
| 1993 | 930 200 000 $ US | 567 740 000 $ US |
| 1992 | 984 300 000 $ US | 515 500 000 $ US |
| 1991 | 1 046 300 000 $ US | 549 100 000 $ US |
| 1990 | 1 080 000 000 $ US | 573 000 000 $ US |
| 1989 | 1 131 800 000 $ US | 522 000 000 $ US |
| 1988 | 982 900 000 $ US | 491 200 000 $ US |
| 1987 | 998 100 000 $ US | 461 900 000 $ US |
| 1986 | 940 900 000 $ US | 417 700 000 $ US |
| 1985 | 926 600 000 $ US | 390 400 000 $ US |
| 1984 | 866 200 000 $ US | 357 500 000 $ US |
| 1983 | 822 100 000 $ US | 373 800 000 $ US |
| 1982 | 754 500 000 $ US | 346 100 000 $ US |
| 1981 | 796 700 000 $ US | 310 600 000 $ US |
| 1980 | 800 800 000 $ US | 263 700 000 $ US |
| 1979 | 597 500 000 $ US | 227 800 000 $ US |
| 1978 | 467 900 000 $ US | 196 900 000 $ US |
| 1977 | 390 400 000 $ US | 208 300 000 $ US |
| 1976 | 389 500 000 $ US | 137 300 000 $ US |
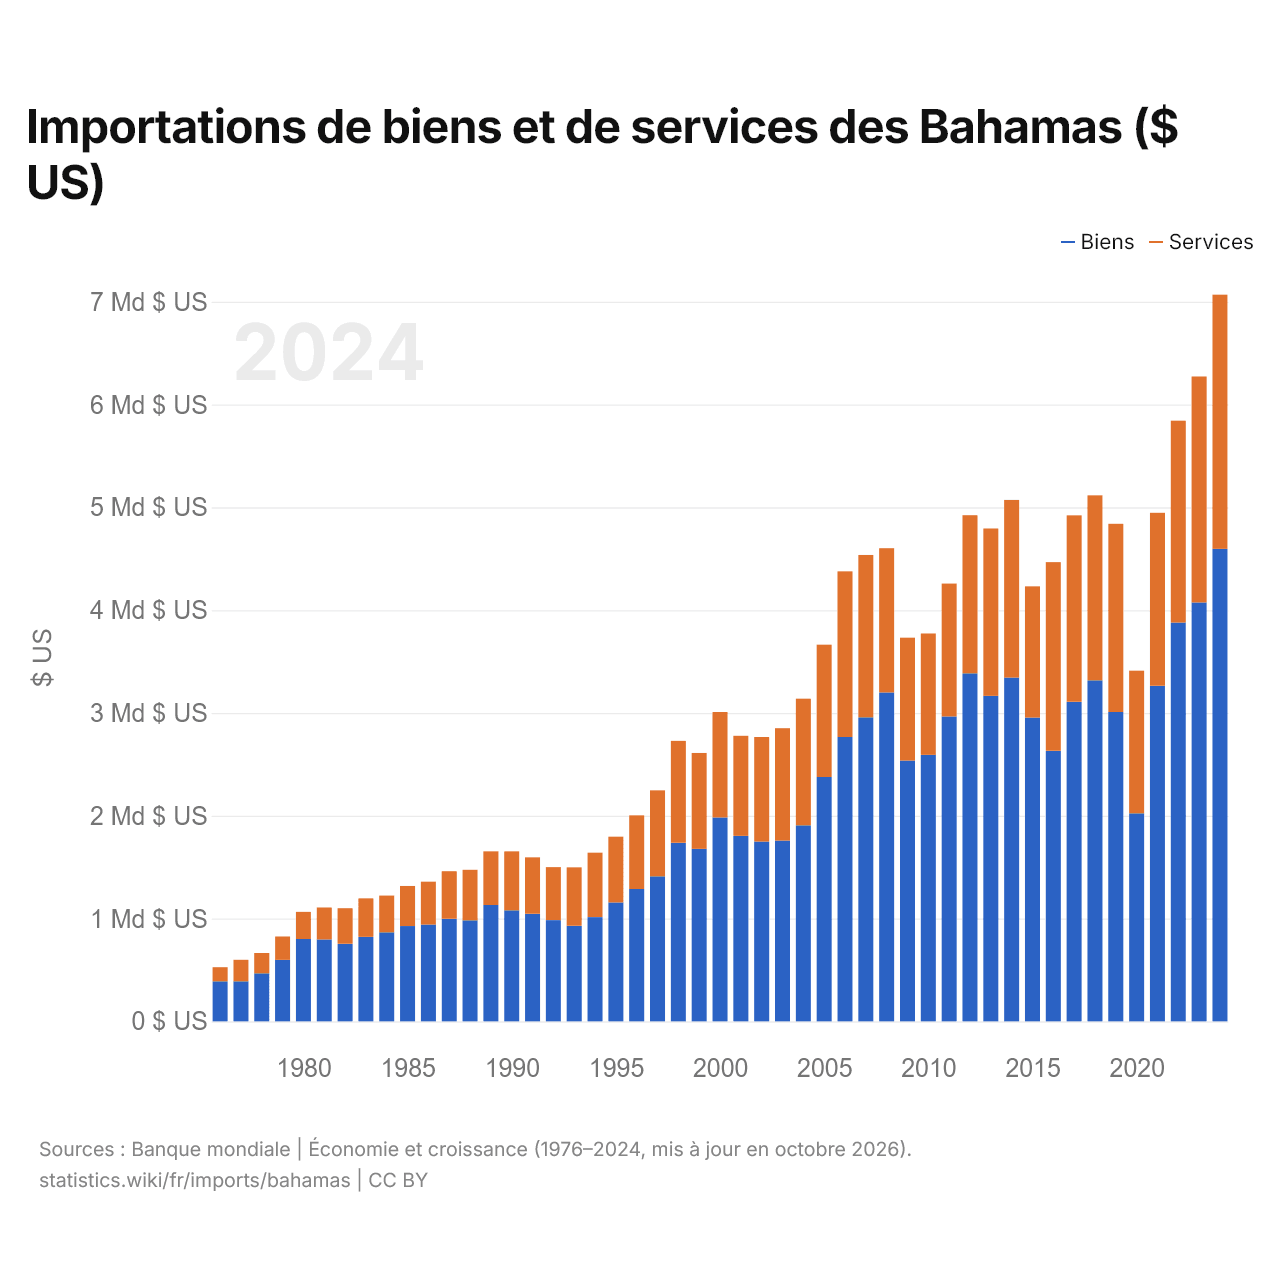
Les importations de biens des Bahamas s'élèvent à 4,6 milliards de dollars (2024) et celles de services à 2,47 milliards de dollars ; les services représentent 35,0 % du total, contre 26,1 % en 1976.
Les Bahamas dans le classement mondial des importations
| Rang | Pays | Importations | Part mondiale | |
|---|---|---|---|---|
| 129 |
 Zambie |
6,97 Md $US | 0,02 % | |
| 130 |
 Turkménistan |
6,82 Md $US (2025) | 0,02 % | |
| 131 |
 Syrie |
6,80 Md $US (2022) | 0,02 % | |
| 132 |
 Bahamas |
6,56 Md $US | 0,02 % | |
| 133 |
 Madagascar |
6,46 Md $US (2025) | 0,02 % | |
| 134 |
 Mauritanie |
6,33 Md $US (2025) | 0,02 % | |
| 135 |
 Gabon |
6,30 Md $US (2025) | 0,02 % |
Importations de biens et services des Bahamas, % du PIB
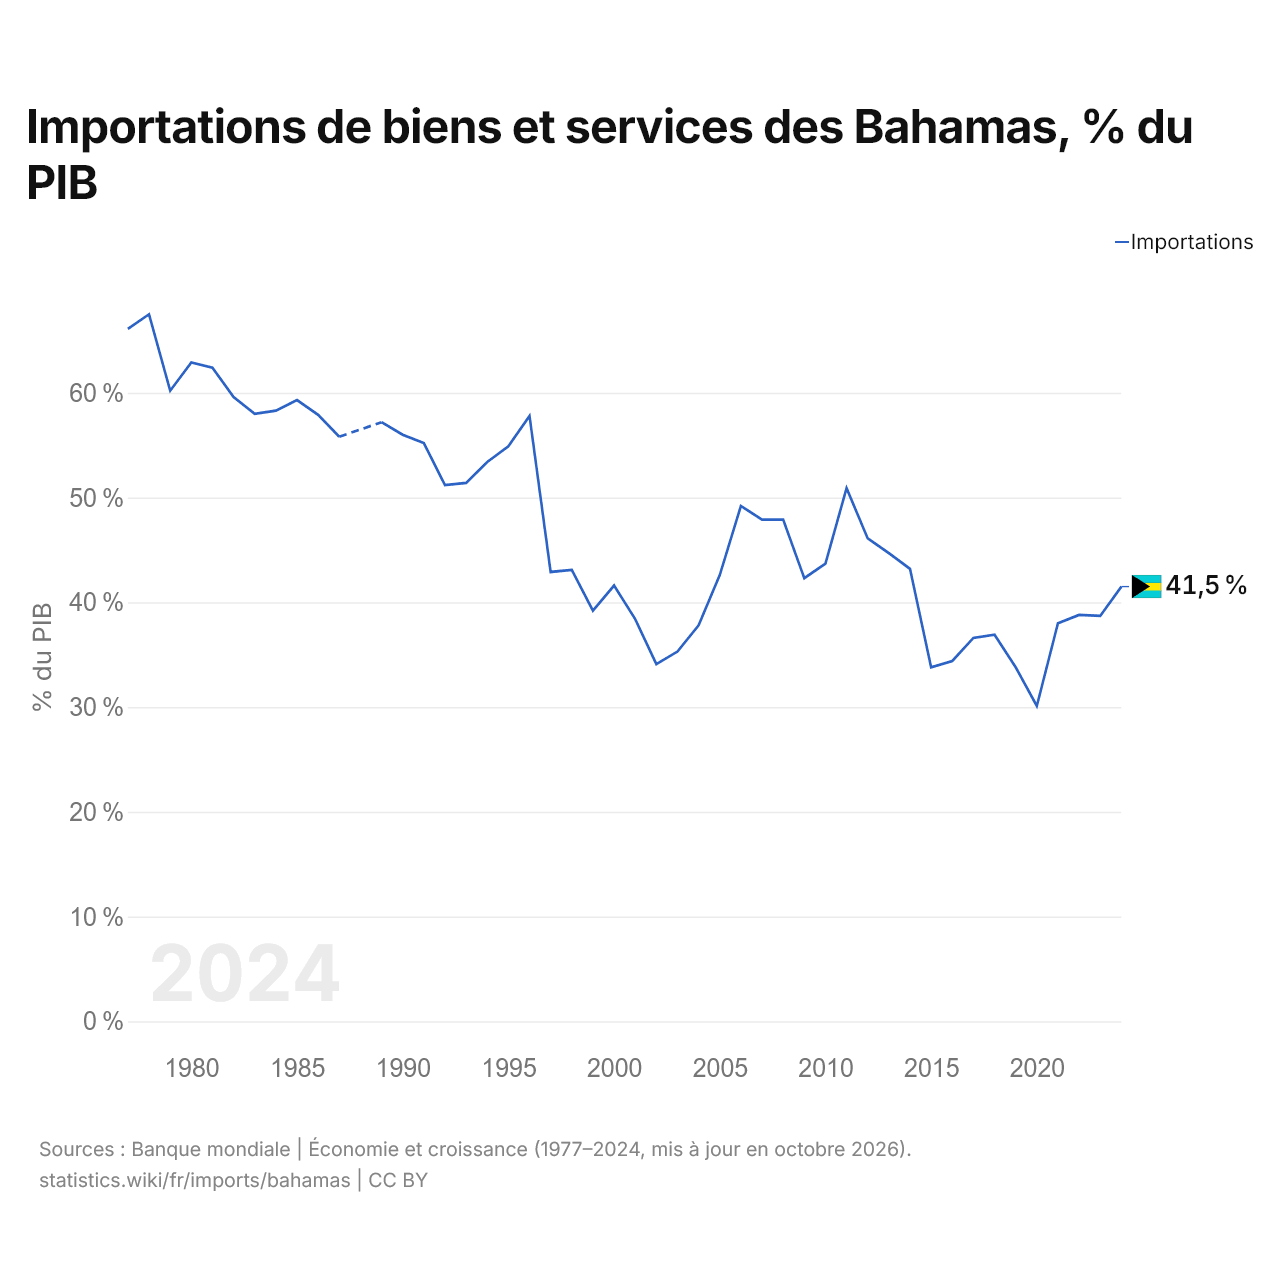
Les importations de biens et services des Bahamas équivalent à 41,5 % de leur PIB (2024), contre 66,1 % en 1977. La part la plus élevée a été de 67,5 %, en 1978.
Comparer les importations des Bahamas avec celles d'autres pays
Sources :
- Banque mondiale | Économie et croissance (1976–2025, mis à jour en octobre 2026)
- TradeMap (2001–2025, mis à jour en octobre 2026)
Creative Commons Attribution (CC BY) : vous pouvez copier, partager, adapter et réutiliser ce contenu, y compris à des fins commerciales, à condition de citer statistics.wiki et d’indiquer les modifications apportées. Les sources citées ci-dessus peuvent avoir leurs propres conditions de licence.