
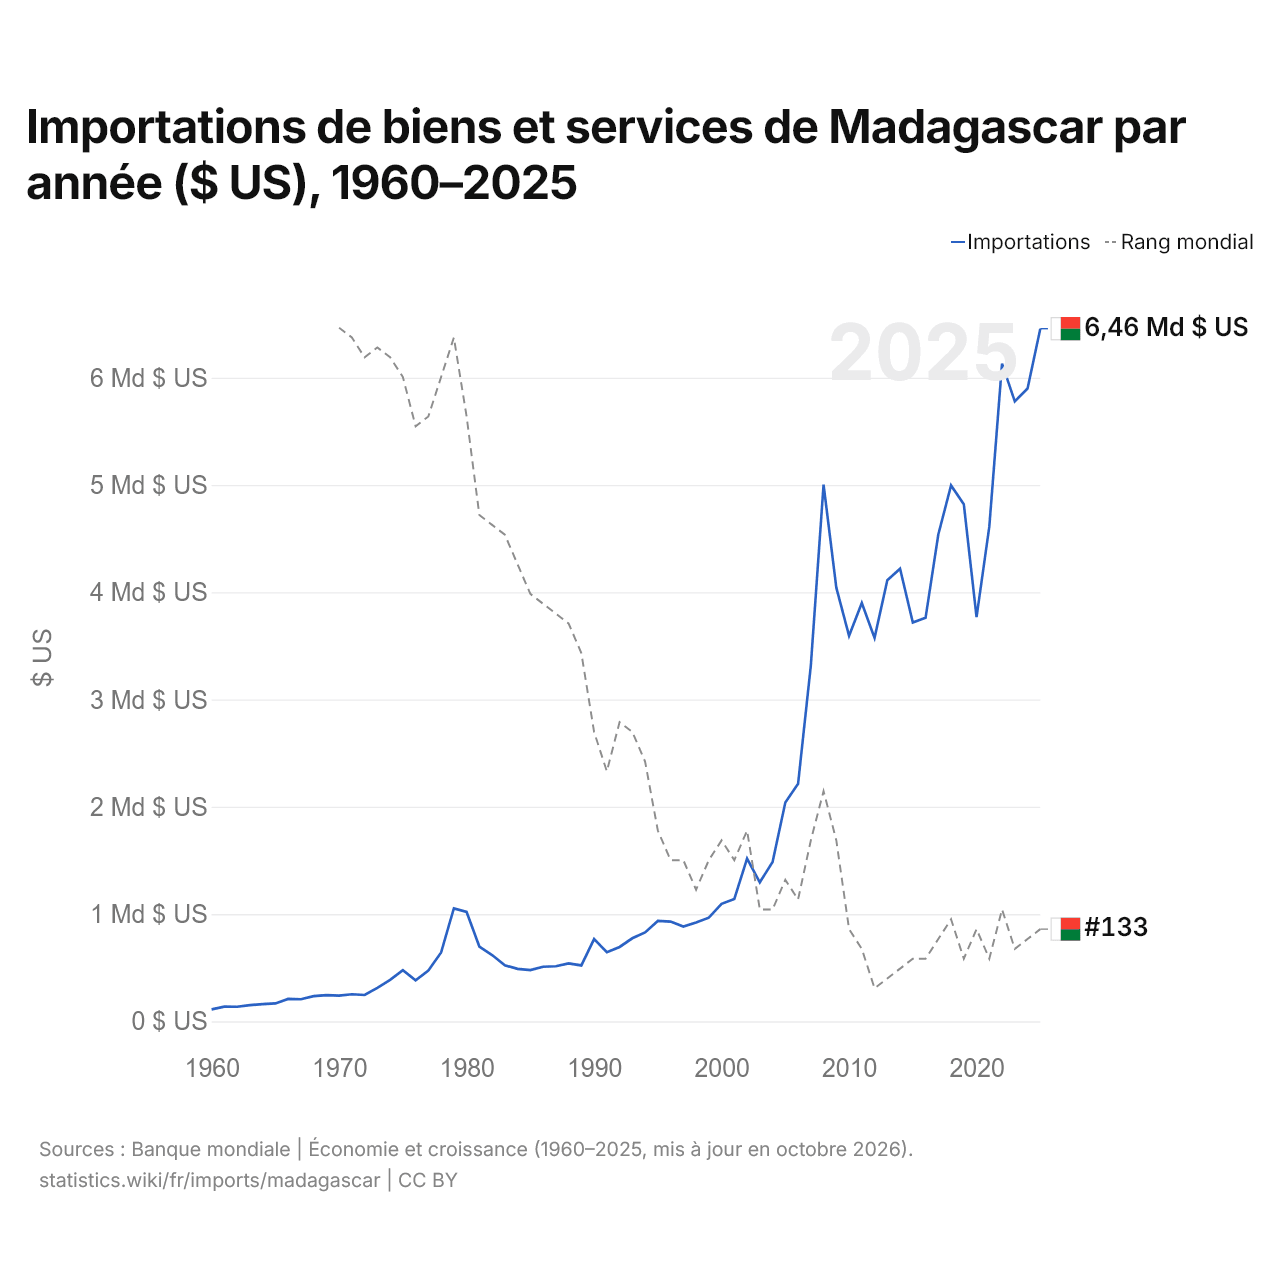
Importations de biens et services de Madagascar par année ($ US), 1960–2025
| Année | $ US | Rang mondial |
|---|---|---|
| Importations | Rang mondial | |
| 2025 | 6 456 688 115 $ US | #133 |
| 2024 | 5 898 719 063 $ US | #134 |
| 2023 | 5 779 521 890 $ US | #135 |
| 2022 | 6 130 820 186 $ US | #131 |
| 2021 | 4 611 346 609 $ US | #136 |
| 2020 | 3 767 772 595 $ US | #133 |
| 2019 | 4 820 540 218 $ US | #136 |
| 2018 | 4 995 646 271 $ US | #132 |
| 2017 | 4 538 023 942 $ US | #134 |
| 2016 | 3 761 002 302 $ US | #136 |
| 2015 | 3 717 317 431 $ US | #136 |
| 2014 | 4 218 673 808 $ US | #137 |
| 2013 | 4 111 627 324 $ US | #138 |
| 2012 | 3 574 547 936 $ US | #139 |
| 2011 | 3 900 293 294 $ US | #135 |
| 2010 | 3 593 827 392 $ US | #133 |
| 2009 | 4 042 538 711 $ US | #124 |
| 2008 | 5 003 293 325 $ US | #119 |
| 2007 | 3 316 634 032 $ US | #124 |
| 2006 | 2 213 935 049 $ US | #130 |
| 2005 | 2 039 652 747 $ US | #128 |
| 2004 | 1 484 882 132 $ US | #131 |
| 2003 | 1 295 939 420 $ US | #131 |
| 2002 | 1 518 069 984 $ US | #123 |
| 2001 | 1 140 139 723 $ US | #126 |
| 2000 | 1 095 162 038 $ US | #124 |
| 1999 | 965 856 215 $ US | #126 |
| 1998 | 920 883 328 $ US | #129 |
| 1997 | 883 747 059 $ US | #126 |
| 1996 | 930 030 558 $ US | #126 |
| 1995 | 936 020 464 $ US | #123 |
| 1994 | 829 101 113 $ US | #116 |
| 1993 | 774 310 222 $ US | #113 |
| 1992 | 693 267 161 $ US | #112 |
| 1991 | 643 923 816 $ US | #117 |
| 1990 | 767 031 802 $ US | #113 |
| 1989 | 521 021 527 $ US | #105 |
| 1988 | 539 406 598 $ US | #102 |
| 1987 | 513 724 262 $ US | #101 |
| 1986 | 508 615 749 $ US | #100 |
| 1985 | 477 012 483 $ US | #99 |
| 1984 | 488 824 150 $ US | #96 |
| 1983 | 522 094 425 $ US | #93 |
| 1982 | 617 989 390 $ US | #92 |
| 1981 | 696 934 879 $ US | #91 |
| 1980 | 1 019 609 062 $ US | #81 |
| 1979 | 1 052 478 242 $ US | #73 |
| 1978 | 642 273 690 $ US | #77 |
| 1977 | 472 941 274 $ US | #81 |
| 1976 | 382 361 664 $ US | #82 |
| 1975 | 476 932 068 $ US | #77 |
| 1974 | 387 473 830 $ US | #75 |
| 1973 | 312 077 207 $ US | #74 |
| 1972 | 245 822 788 $ US | #75 |
| 1971 | 252 204 260 $ US | #73 |
| 1970 | 240 001 885 $ US | #72 |
| 1969 | 244 148 323 $ US | - |
| 1968 | 235 119 320 $ US | - |
| 1967 | 205 672 791 $ US | - |
| 1966 | 208 843 980 $ US | - |
| 1965 | 166 712 685 $ US | - |
| 1964 | 159 917 394 $ US | - |
| 1963 | 151 309 644 $ US | - |
| 1962 | 135 907 022 $ US | - |
| 1961 | 136 359 935 $ US | - |
| 1960 | 111 896 639 $ US | - |
En 2025, les importations de biens et services de Madagascar s'élevaient à 6,46 milliards de dollars, contre 112 millions de dollars en 1960. Elles se classaient au 133e rang mondial, en hausse par rapport au 134e rang en 2024. Leur meilleur rang a été le 72e, occupé pour la dernière fois en 1970.
En 2025, les importations de biens et services de Madagascar étaient les 28es plus élevées de 50 pays situés en Afrique. En 2025, les importations de Madagascar dépassaient ses exportations de 2,27 milliards de dollars, soit un déficit commercial. Le commerce de Madagascar, exportations et importations réunies, équivalait à 54,2 % de son PIB en 2025, au 127e rang mondial.
Importations de biens de Madagascar par catégorie, 2025
Importations de biens, 2025: 5,22 Md $US
En 2025, la première catégorie des importations de biens de Madagascar était « pétrole, gaz, minerais et autres matières premières », avec 24,7 %, suivie de « machines, électronique et véhicules », avec 19,8 %.
Origines des importations de biens de Madagascar : les 10 premières, 2025
| Rang | Pays | Importations de biens | Part | |
|---|---|---|---|---|
| 1 |
 Chine |
1,33 Md $US | 25,5 % | |
| 2 |
 Oman |
646 M $US | 12,4 % | |
| 3 |
 Inde |
357 M $US | 6,84 % | |
| 4 |
 France |
288 M $US | 5,51 % | vs France |
| 5 |
 Pakistan |
265 M $US | 5,07 % | |
| 6 |
 EAU |
256 M $US | 4,91 % | |
| 7 |
 Malaisie |
210 M $US | 4,03 % | |
| 8 |
 Afrique du Sud |
204 M $US | 3,92 % | |
| 9 |
 Maurice |
143 M $US | 2,74 % | vs Maurice |
| 10 |
 Égypte |
131 M $US | 2,5 % | |
| Autres partenaires et non précisés | 1,39 Md $US | 26,6 % |
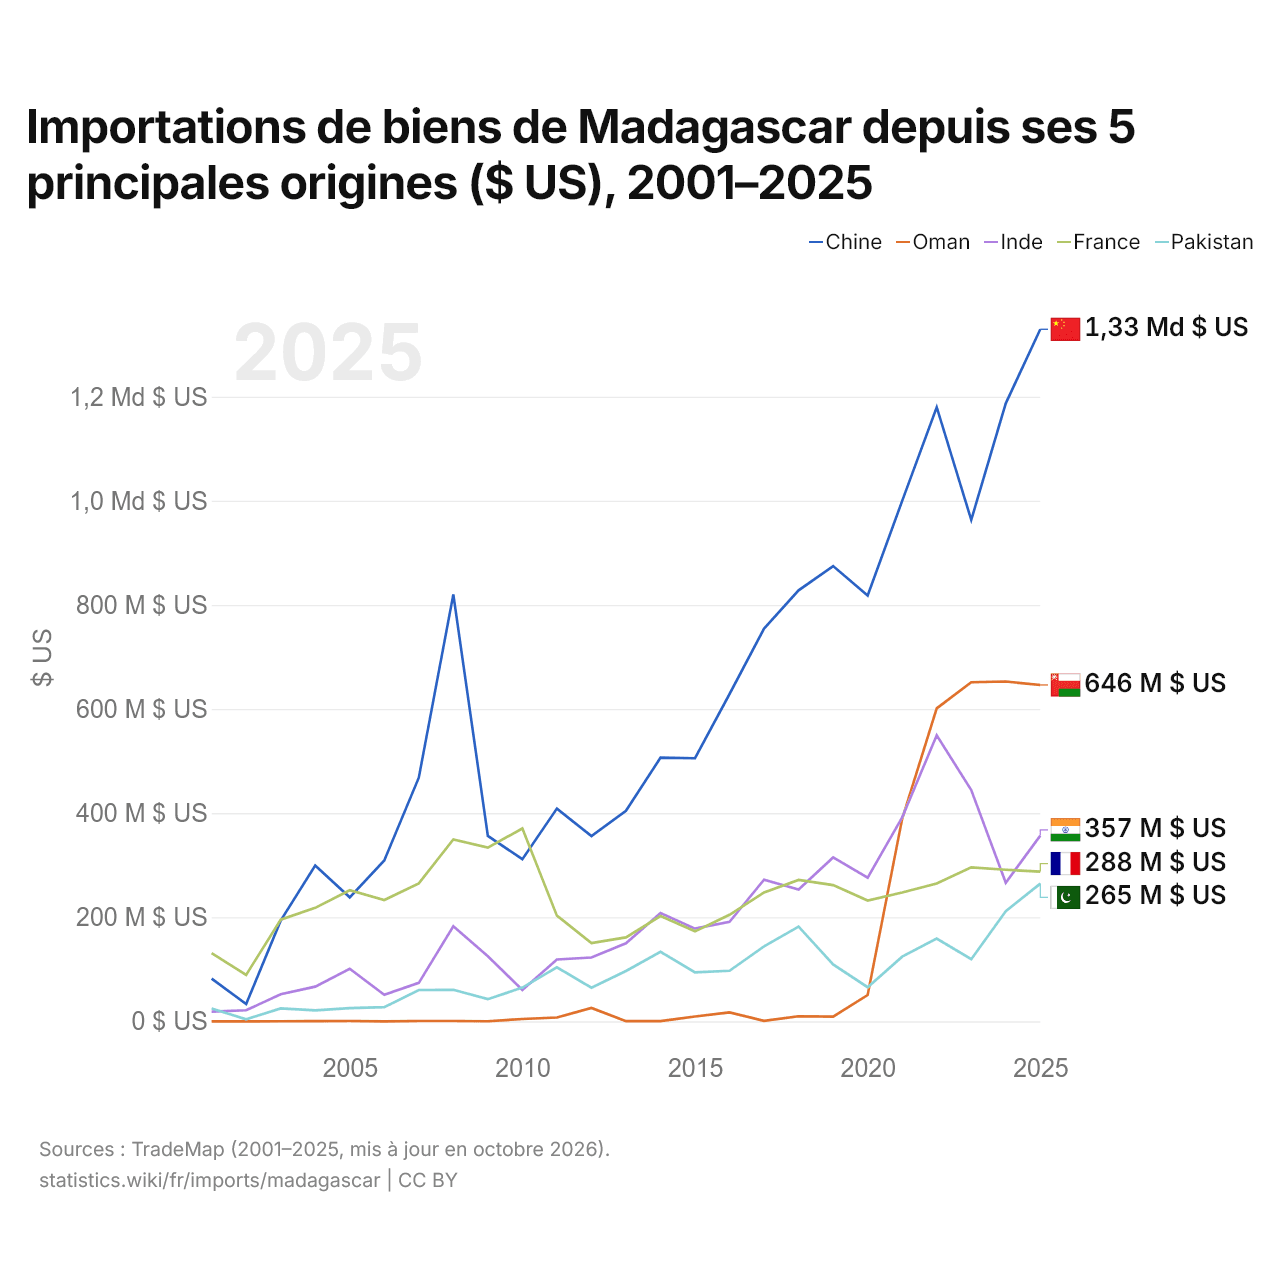
Importations de biens de Madagascar depuis ses 5 principales origines ($ US), 2001–2025
| Année | $ US | ||||
|---|---|---|---|---|---|
| Chine | Oman | Inde | France | Pakistan | |
| 2025 | 1 329 441 000 $ US | 646 160 000 $ US | 356 750 000 $ US | 287 667 000 $ US | 264 637 000 $ US |
| 2024 | 1 187 118 000 $ US | 652 734 000 $ US | 266 341 000 $ US | 291 105 000 $ US | 211 503 000 $ US |
| 2023 | 963 259 000 $ US | 651 305 000 $ US | 444 337 000 $ US | 295 877 000 $ US | 119 293 000 $ US |
| 2022 | 1 179 739 000 $ US | 601 289 000 $ US | 549 422 000 $ US | 264 836 000 $ US | 158 942 000 $ US |
| 2021 | 999 811 000 $ US | 388 952 000 $ US | 391 836 000 $ US | 247 463 000 $ US | 124 309 000 $ US |
| 2020 | 818 139 000 $ US | 50 536 000 $ US | 276 073 000 $ US | 232 107 000 $ US | 65 520 000 $ US |
| 2019 | 874 580 000 $ US | 9 057 000 $ US | 314 866 000 $ US | 261 716 000 $ US | 109 427 000 $ US |
| 2018 | 828 035 000 $ US | 9 689 000 $ US | 253 306 000 $ US | 271 590 000 $ US | 181 808 000 $ US |
| 2017 | 754 473 000 $ US | 993 000 $ US | 272 106 000 $ US | 247 558 000 $ US | 144 156 000 $ US |
| 2016 | 628 795 000 $ US | 17 213 000 $ US | 191 105 000 $ US | 204 636 000 $ US | 97 205 000 $ US |
| 2015 | 505 368 000 $ US | 9 199 000 $ US | 178 103 000 $ US | 172 854 000 $ US | 93 898 000 $ US |
| 2014 | 506 411 000 $ US | 524 000 $ US | 208 085 000 $ US | 202 299 000 $ US | 133 502 000 $ US |
| 2013 | 404 345 000 $ US | 334 000 $ US | 149 949 000 $ US | 161 161 000 $ US | 96 651 000 $ US |
| 2012 | 355 884 000 $ US | 25 841 000 $ US | 122 658 000 $ US | 150 507 000 $ US | 64 705 000 $ US |
| 2011 | 408 660 000 $ US | 7 352 000 $ US | 118 739 000 $ US | 203 023 000 $ US | 103 634 000 $ US |
| 2010 | 311 484 000 $ US | 4 474 000 $ US | 60 281 000 $ US | 370 454 000 $ US | 64 849 000 $ US |
| 2009 | 356 220 000 $ US | 129 000 $ US | 124 987 000 $ US | 333 809 000 $ US | 42 604 000 $ US |
| 2008 | 819 948 000 $ US | 696 000 $ US | 182 570 000 $ US | 349 351 000 $ US | 60 539 000 $ US |
| 2007 | 468 089 000 $ US | 599 000 $ US | 73 898 000 $ US | 265 045 000 $ US | 60 186 000 $ US |
| 2006 | 309 075 000 $ US | 60 000 $ US | 51 017 000 $ US | 233 140 000 $ US | 27 237 000 $ US |
| 2005 | 238 136 000 $ US | 572 000 $ US | 100 950 000 $ US | 251 931 000 $ US | 25 281 000 $ US |
| 2004 | 299 327 000 $ US | 321 000 $ US | 66 636 000 $ US | 218 016 000 $ US | 20 899 000 $ US |
| 2003 | 193 508 000 $ US | 101 000 $ US | 51 931 000 $ US | 195 300 000 $ US | 24 727 000 $ US |
| 2002 | 33 205 000 $ US | 17 000 $ US | 21 282 000 $ US | 89 212 000 $ US | 3 996 000 $ US |
| 2001 | 81 871 000 $ US | 18 000 $ US | 18 705 000 $ US | 130 883 000 $ US | 24 636 000 $ US |
En 2025, les importations de biens s'élevaient à 1,33 milliard de dollars en provenance de la Chine, 646 millions de dollars en provenance d'Oman, 357 millions de dollars en provenance de l'Inde, 288 millions de dollars en provenance de la France et 265 millions de dollars en provenance du Pakistan. Le premier rang des cinq fournisseurs de Madagascar est occupé par la Chine depuis 2011. Le changement le plus récent dans leur ordre remonte à 2025, quand les importations de Madagascar en provenance de l'Inde ont dépassé celles en provenance de la France.
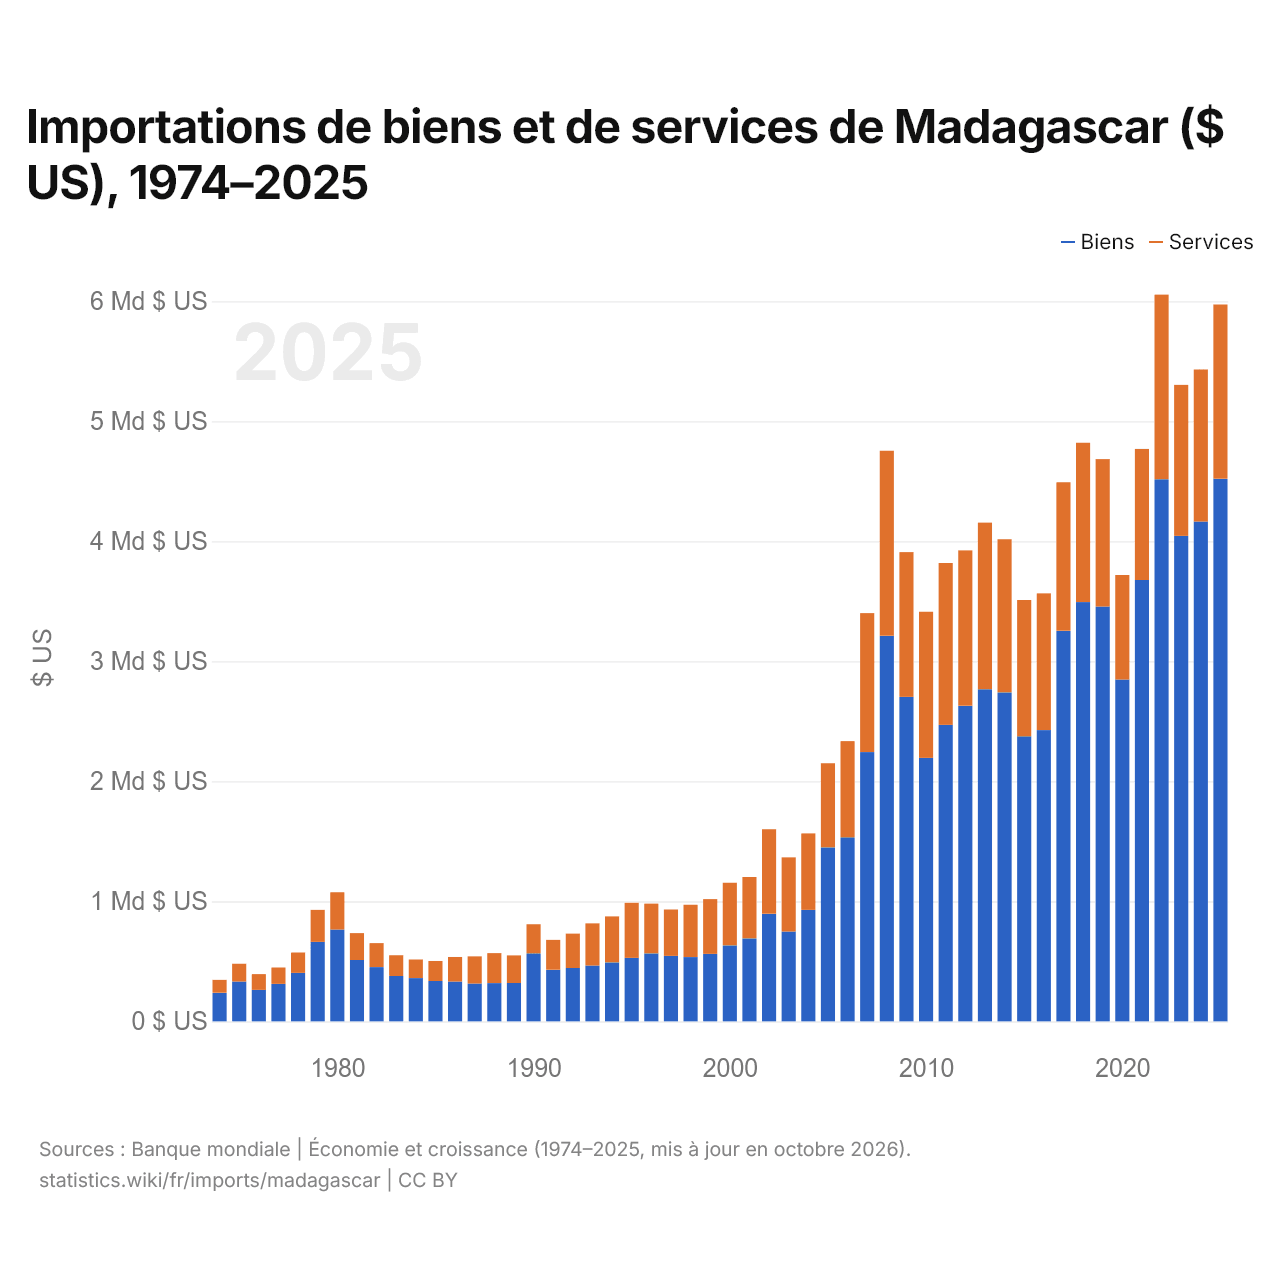
Importations de biens et de services de Madagascar ($ US), 1974–2025
| Année | $ US | |
|---|---|---|
| Biens | Services | |
| 2025 | 4 521 273 269 $ US | 1 451 486 786 $ US |
| 2024 | 4 163 765 326 $ US | 1 267 585 133 $ US |
| 2023 | 4 044 503 250 $ US | 1 258 666 581 $ US |
| 2022 | 4 516 885 265 $ US | 1 537 557 190 $ US |
| 2021 | 3 677 001 521 $ US | 1 092 032 655 $ US |
| 2020 | 2 848 557 492 $ US | 869 651 490 $ US |
| 2019 | 3 456 452 643 $ US | 1 228 137 433 $ US |
| 2018 | 3 493 261 050 $ US | 1 327 761 912 $ US |
| 2017 | 3 254 302 745 $ US | 1 236 786 358 $ US |
| 2016 | 2 426 542 336 $ US | 1 139 293 571 $ US |
| 2015 | 2 375 412 180 $ US | 1 134 982 312 $ US |
| 2014 | 2 740 906 880 $ US | 1 275 723 015 $ US |
| 2013 | 2 767 097 423 $ US | 1 388 199 102 $ US |
| 2012 | 2 630 047 182 $ US | 1 293 740 761 $ US |
| 2011 | 2 469 788 168 $ US | 1 348 729 515 $ US |
| 2010 | 2 195 394 617 $ US | 1 216 792 414 $ US |
| 2009 | 2 703 564 804 $ US | 1 205 873 126 $ US |
| 2008 | 3 212 841 577 $ US | 1 541 246 530 $ US |
| 2007 | 2 243 651 778 $ US | 1 157 562 133 $ US |
| 2006 | 1 533 732 815 $ US | 800 633 415 $ US |
| 2005 | 1 449 112 645 $ US | 701 490 867 $ US |
| 2004 | 929 324 080 $ US | 636 331 020 $ US |
| 2003 | 748 155 469 $ US | 618 279 025 $ US |
| 2002 | 896 434 638 $ US | 704 213 631 $ US |
| 2001 | 691 235 259 $ US | 510 924 518 $ US |
| 2000 | 632 674 123 $ US | 522 061 323 $ US |
| 1999 | 562 214 592 $ US | 456 181 197 $ US |
| 1998 | 535 393 629 $ US | 435 582 888 $ US |
| 1997 | 546 093 566 $ US | 385 726 584 $ US |
| 1996 | 566 057 016 $ US | 414 564 311 $ US |
| 1995 | 528 287 526 $ US | 458 649 540 $ US |
| 1994 | 491 361 260 $ US | 382 840 375 $ US |
| 1993 | 464 838 611 $ US | 351 591 678 $ US |
| 1992 | 444 584 131 $ US | 286 394 606 $ US |
| 1991 | 430 193 532 $ US | 248 757 737 $ US |
| 1990 | 566 443 723 $ US | 242 312 223 $ US |
| 1989 | 319 918 924 $ US | 229 444 553 $ US |
| 1988 | 318 639 667 $ US | 250 108 971 $ US |
| 1987 | 315 250 465 $ US | 226 418 800 $ US |
| 1986 | 331 075 678 $ US | 205 207 187 $ US |
| 1985 | 335 754 799 $ US | 167 205 679 $ US |
| 1984 | 360 119 138 $ US | 155 295 525 $ US |
| 1983 | 378 256 046 $ US | 172 238 689 $ US |
| 1982 | 451 540 806 $ US | 200 065 287 $ US |
| 1981 | 510 800 380 $ US | 224 045 584 $ US |
| 1980 | 764 440 343 $ US | 310 632 281 $ US |
| 1979 | 662 417 488 $ US | 266 546 530 $ US |
| 1978 | 404 245 419 $ US | 168 841 816 $ US |
| 1977 | 311 748 574 $ US | 136 356 930 $ US |
| 1976 | 261 770 701 $ US | 131 659 573 $ US |
| 1975 | 331 805 836 $ US | 148 055 114 $ US |
| 1974 | 238 342 776 $ US | 107 393 424 $ US |
En 2025, les importations de biens de Madagascar s'élevaient à 4,52 milliards de dollars et celles de services à 1,45 milliard de dollars ; les services représentaient 24,3 % du total, contre 31,1 % en 1974.
Madagascar dans le classement mondial des importations, 2025
| Rang | Pays | Importations | Part mondiale | |
|---|---|---|---|---|
| 130 |
 Turkménistan |
6,82 Md $US | 0,02 % | |
| 131 |
 Syrie |
6,80 Md $US (2022) | 0,02 % | |
| 132 |
 Bahamas |
6,56 Md $US (2024) | 0,02 % | |
| 133 |
 Madagascar |
6,46 Md $US | 0,02 % | |
| 134 |
 Mauritanie |
6,33 Md $US | 0,02 % | |
| 135 |
 Gabon |
6,30 Md $US | 0,02 % | |
| 136 |
 Monténégro |
6,07 Md $US | 0,02 % |
Importations de biens et services de Madagascar, % du PIB, 1960–2025
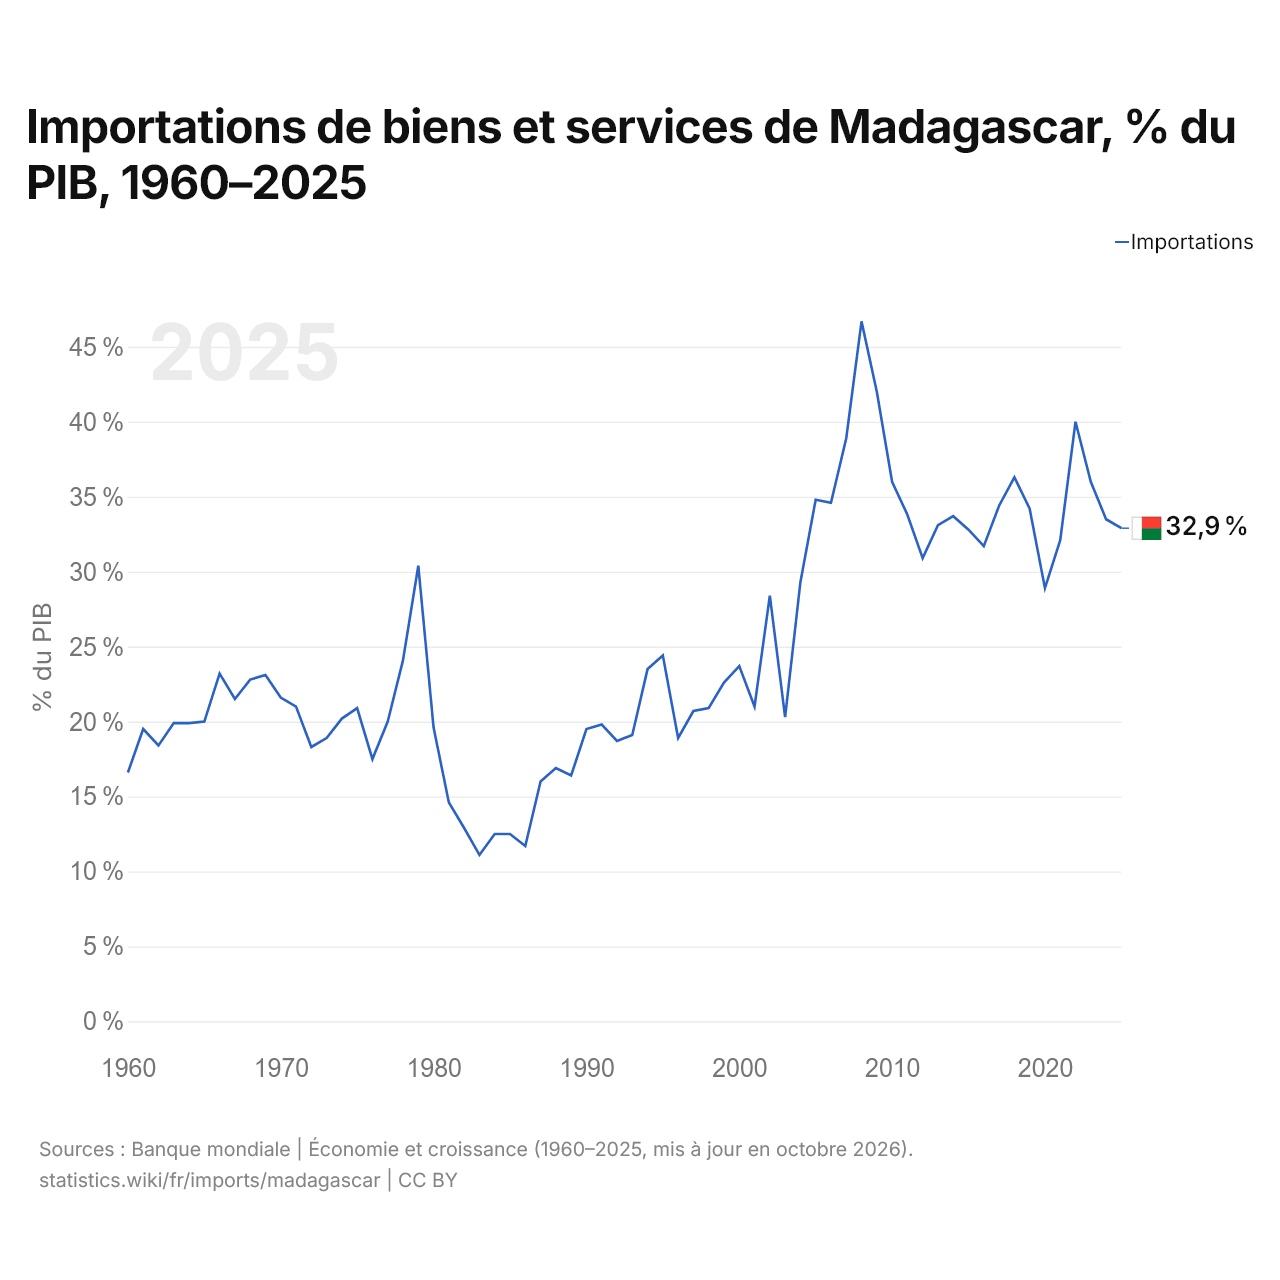
En 2025, les importations de biens et services de Madagascar équivalaient à 32,9 % de son PIB, contre 16,6 % en 1960. La part la plus élevée a été de 46,7 %, en 2008.
Comparer les importations de Madagascar avec celles d'autres pays
Sources :
- Banque mondiale | Économie et croissance (1960–2025, mis à jour en octobre 2026)
- TradeMap (2001–2025, mis à jour en octobre 2026)
Creative Commons Attribution (CC BY) : vous pouvez copier, partager, adapter et réutiliser ce contenu, y compris à des fins commerciales, à condition de citer statistics.wiki et d’indiquer les modifications apportées. Les sources citées ci-dessus peuvent avoir leurs propres conditions de licence.