
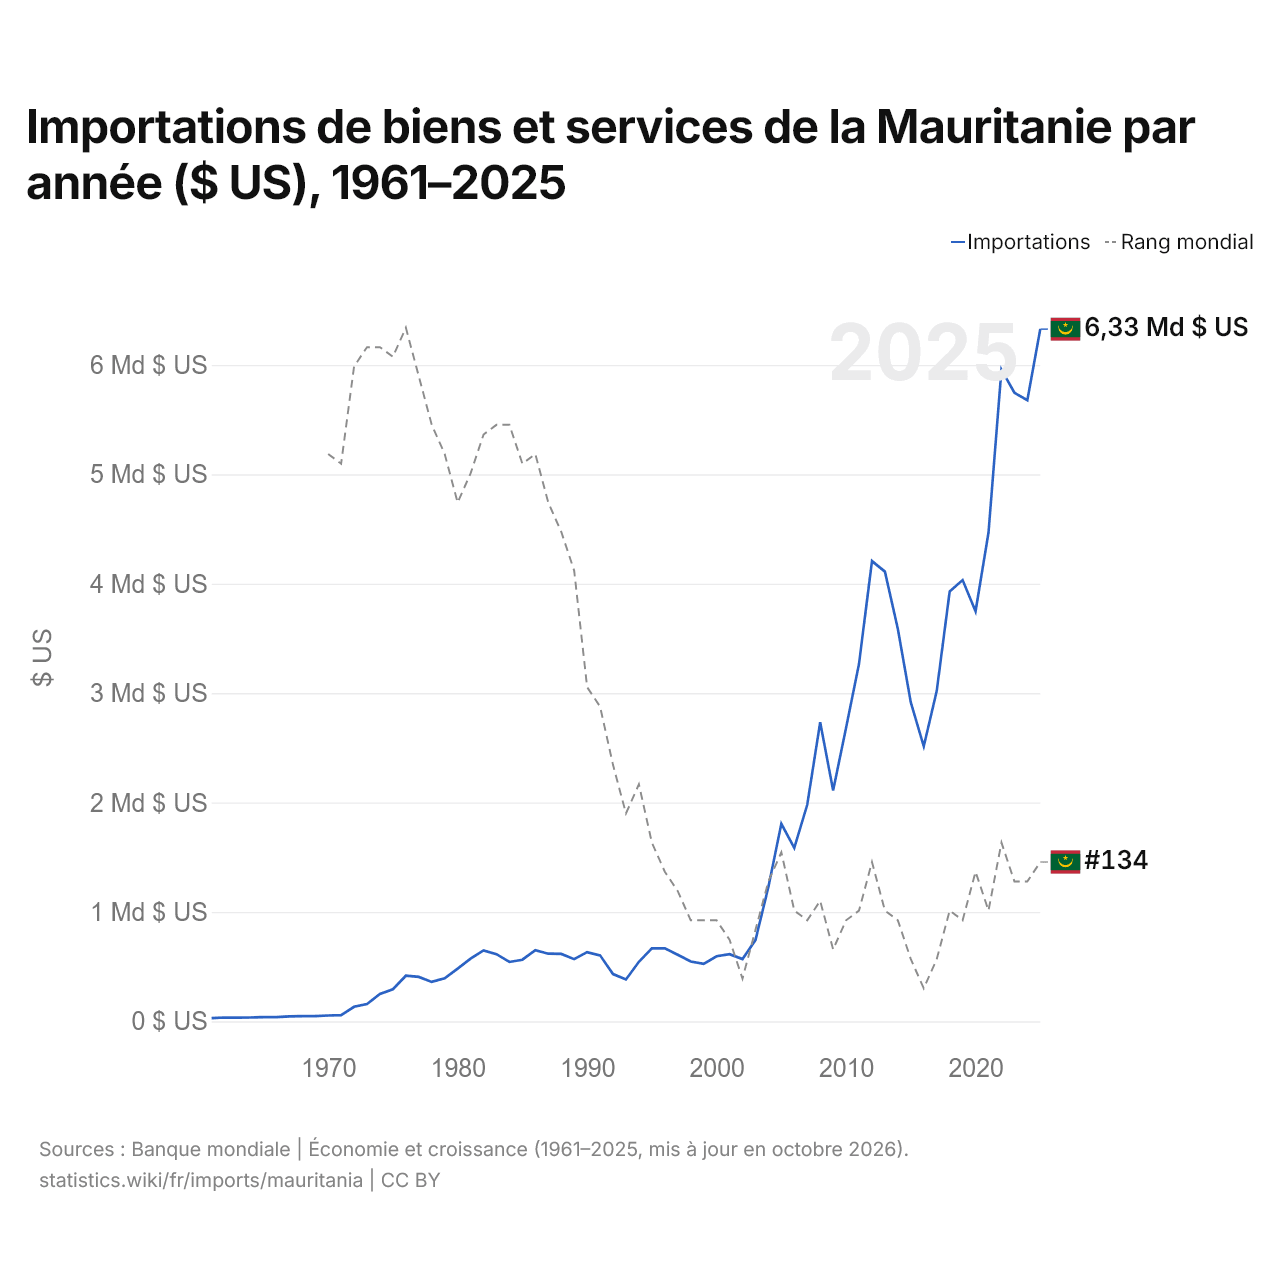
Importations de biens et services de la Mauritanie par année ($ US), 1961–2025
| Année | $ US | Rang mondial |
|---|---|---|
| Importations | Rang mondial | |
| 2025 | 6 327 162 514 $ US | #134 |
| 2024 | 5 677 643 653 $ US | #136 |
| 2023 | 5 745 446 437 $ US | #136 |
| 2022 | 5 956 297 149 $ US | #132 |
| 2021 | 4 467 674 565 $ US | #139 |
| 2020 | 3 747 824 684 $ US | #135 |
| 2019 | 4 033 369 861 $ US | #140 |
| 2018 | 3 929 143 535 $ US | #139 |
| 2017 | 3 018 559 264 $ US | #144 |
| 2016 | 2 513 699 049 $ US | #147 |
| 2015 | 2 915 057 681 $ US | #144 |
| 2014 | 3 586 992 625 $ US | #140 |
| 2013 | 4 110 638 554 $ US | #139 |
| 2012 | 4 206 931 498 $ US | #134 |
| 2011 | 3 267 485 663 $ US | #139 |
| 2010 | 2 683 928 047 $ US | #140 |
| 2009 | 2 110 388 243 $ US | #143 |
| 2008 | 2 734 283 391 $ US | #138 |
| 2007 | 1 979 303 956 $ US | #140 |
| 2006 | 1 584 465 517 $ US | #139 |
| 2005 | 1 805 119 194 $ US | #133 |
| 2004 | 1 227 308 582 $ US | #136 |
| 2003 | 742 377 025 $ US | #141 |
| 2002 | 568 870 241 $ US | #146 |
| 2001 | 613 989 585 $ US | #142 |
| 2000 | 594 773 876 $ US | #140 |
| 1999 | 525 231 931 $ US | #140 |
| 1998 | 547 348 702 $ US | #140 |
| 1997 | 608 286 588 $ US | #137 |
| 1996 | 667 182 822 $ US | #135 |
| 1995 | 667 898 123 $ US | #132 |
| 1994 | 544 298 175 $ US | #126 |
| 1993 | 382 686 043 $ US | #129 |
| 1992 | 431 906 454 $ US | #124 |
| 1991 | 603 327 625 $ US | #118 |
| 1990 | 632 068 929 $ US | #116 |
| 1989 | 568 480 363 $ US | #104 |
| 1988 | 615 941 855 $ US | #100 |
| 1987 | 618 370 339 $ US | #97 |
| 1986 | 650 009 597 $ US | #92 |
| 1985 | 563 391 028 $ US | #93 |
| 1984 | 542 696 591 $ US | #89 |
| 1983 | 614 032 310 $ US | #89 |
| 1982 | 648 640 501 $ US | #90 |
| 1981 | 572 218 353 $ US | #94 |
| 1980 | 482 428 348 $ US | #97 |
| 1979 | 393 063 713 $ US | #92 |
| 1978 | 360 360 616 $ US | #89 |
| 1977 | 406 019 479 $ US | #84 |
| 1976 | 416 962 601 $ US | #79 |
| 1975 | 293 406 802 $ US | #82 |
| 1974 | 251 014 222 $ US | #81 |
| 1973 | 157 860 291 $ US | #81 |
| 1972 | 133 106 293 $ US | #83 |
| 1971 | 57 029 505 $ US | #93 |
| 1970 | 53 340 246 $ US | #92 |
| 1969 | 47 902 224 $ US | - |
| 1968 | 47 194 756 $ US | - |
| 1967 | 45 475 865 $ US | - |
| 1966 | 38 755 999 $ US | - |
| 1965 | 38 130 099 $ US | - |
| 1964 | 35 079 689 $ US | - |
| 1963 | 34 317 089 $ US | - |
| 1962 | 35 270 342 $ US | - |
| 1961 | 29 741 476 $ US | - |
En 2025, les importations de biens et services de la Mauritanie s'élevaient à 6,33 milliards de dollars, contre 29,7 millions de dollars en 1961. Elles se classaient au 134e rang mondial, en hausse par rapport au 136e rang en 2024. Leur meilleur rang a été le 79e, occupé pour la dernière fois en 1976.
En 2025, les importations de biens et services de la Mauritanie étaient les 29es plus élevées de 50 pays situés en Afrique. En 2025, les importations de la Mauritanie dépassaient ses exportations de 1,67 milliard de dollars, soit un déficit commercial. Le commerce de la Mauritanie, exportations et importations réunies, équivalait à 94,0 % de son PIB en 2025, au 69e rang mondial.
Importations de biens de la Mauritanie par catégorie, 2025
Importations de biens, 2025: 6,04 Md $US
En 2025, la première catégorie des importations de biens de la Mauritanie était « machines, électronique et véhicules », avec 33,8 %, suivie de « pétrole, gaz, minerais et autres matières premières », avec 31,6 %.
Origines des importations de biens de la Mauritanie : les 10 premières, 2025
| Rang | Pays | Importations de biens | Part | |
|---|---|---|---|---|
| 1 |
 Espagne |
783 M $US | 13 % | |
| 2 |
 EAU |
778 M $US | 12,9 % | |
| 3 |
 Belgique |
653 M $US | 10,8 % | |
| 4 |
 Chine |
546 M $US | 9,03 % | |
| 5 |
 États-Unis |
523 M $US | 8,65 % | |
| 6 |
 France |
317 M $US | 5,25 % | vs France |
| 7 |
 Japon |
252 M $US | 4,18 % | |
| 8 |
 Brésil |
216 M $US | 3,58 % | |
| 9 |
 Turquie |
197 M $US | 3,26 % | |
| 10 |
 Allemagne |
188 M $US | 3,11 % | |
| Autres partenaires et non précisés | 1,59 Md $US | 26,3 % |
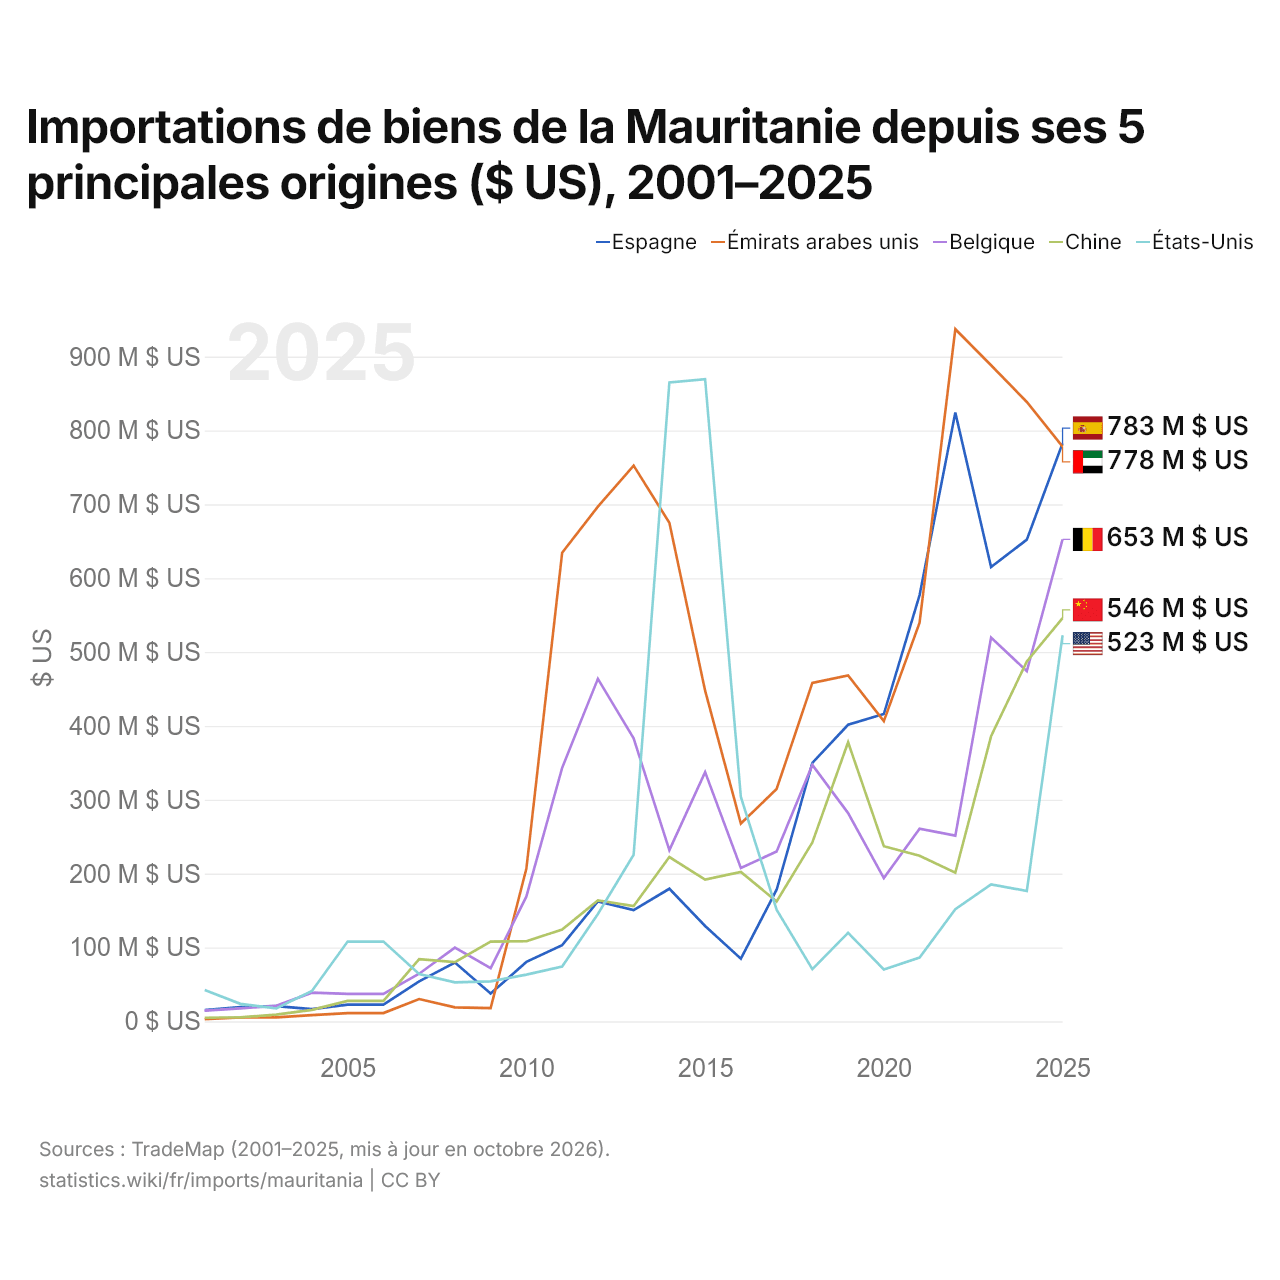
Importations de biens de la Mauritanie depuis ses 5 principales origines ($ US), 2001–2025
| Année | $ US | ||||
|---|---|---|---|---|---|
| Espagne | Émirats arabes unis | Belgique | Chine | États-Unis | |
| 2025 | 782 682 000 $ US | 778 027 000 $ US | 652 529 000 $ US | 545 839 000 $ US | 522 531 000 $ US |
| 2024 | 652 071 000 $ US | 838 547 000 $ US | 474 143 000 $ US | 487 243 000 $ US | 176 506 000 $ US |
| 2023 | 615 044 000 $ US | 888 308 000 $ US | 519 559 000 $ US | 385 928 000 $ US | 185 497 000 $ US |
| 2022 | 824 186 000 $ US | 937 090 000 $ US | 251 408 000 $ US | 201 335 000 $ US | 151 911 000 $ US |
| 2021 | 577 089 000 $ US | 539 721 000 $ US | 260 765 000 $ US | 224 107 000 $ US | 86 384 000 $ US |
| 2020 | 416 041 000 $ US | 406 431 000 $ US | 193 912 000 $ US | 237 116 000 $ US | 70 188 000 $ US |
| 2019 | 401 587 000 $ US | 468 309 000 $ US | 281 895 000 $ US | 377 888 000 $ US | 119 846 000 $ US |
| 2018 | 349 880 000 $ US | 458 179 000 $ US | 347 168 000 $ US | 242 197 000 $ US | 70 735 000 $ US |
| 2017 | 178 142 000 $ US | 314 504 000 $ US | 229 909 000 $ US | 162 309 000 $ US | 151 264 000 $ US |
| 2016 | 84 753 000 $ US | 267 781 000 $ US | 207 583 000 $ US | 202 200 000 $ US | 303 664 000 $ US |
| 2015 | 129 008 000 $ US | 447 674 000 $ US | 337 424 000 $ US | 191 783 000 $ US | 869 497 000 $ US |
| 2014 | 179 477 000 $ US | 674 930 000 $ US | 231 698 000 $ US | 222 399 000 $ US | 864 924 000 $ US |
| 2013 | 150 517 000 $ US | 752 419 000 $ US | 383 066 000 $ US | 156 063 000 $ US | 225 429 000 $ US |
| 2012 | 162 232 000 $ US | 696 816 000 $ US | 463 669 000 $ US | 163 610 000 $ US | 145 441 000 $ US |
| 2011 | 103 052 000 $ US | 634 374 000 $ US | 343 177 000 $ US | 124 133 000 $ US | 74 258 000 $ US |
| 2010 | 80 507 000 $ US | 206 795 000 $ US | 169 049 000 $ US | 108 392 000 $ US | 63 293 000 $ US |
| 2009 | 37 644 000 $ US | 17 835 000 $ US | 72 119 000 $ US | 107 938 000 $ US | 54 112 000 $ US |
| 2008 | 79 615 000 $ US | 18 908 000 $ US | 99 727 000 $ US | 80 157 000 $ US | 52 721 000 $ US |
| 2007 | 54 094 000 $ US | 30 181 000 $ US | 64 453 000 $ US | 84 170 000 $ US | 64 127 000 $ US |
| 2006 | 22 564 000 $ US | 11 205 000 $ US | 37 269 000 $ US | 27 732 000 $ US | 107 999 000 $ US |
| 2005 | 22 564 000 $ US | 11 205 000 $ US | 37 269 000 $ US | 27 732 000 $ US | 107 999 000 $ US |
| 2004 | 16 522 000 $ US | 8 438 000 $ US | 38 809 000 $ US | 15 513 000 $ US | 41 162 000 $ US |
| 2003 | 20 489 000 $ US | 5 326 000 $ US | 20 970 000 $ US | 8 997 000 $ US | 17 509 000 $ US |
| 2002 | 19 445 000 $ US | 5 235 000 $ US | 17 535 000 $ US | 5 473 000 $ US | 23 705 000 $ US |
| 2001 | 15 184 000 $ US | 2 769 000 $ US | 14 536 000 $ US | 4 827 000 $ US | 42 469 000 $ US |
En 2025, les importations de biens s'élevaient à 783 millions de dollars en provenance de l'Espagne, 778 millions de dollars en provenance des Émirats arabes unis, 653 millions de dollars en provenance de la Belgique, 546 millions de dollars en provenance de la Chine et 523 millions de dollars en provenance des États-Unis.
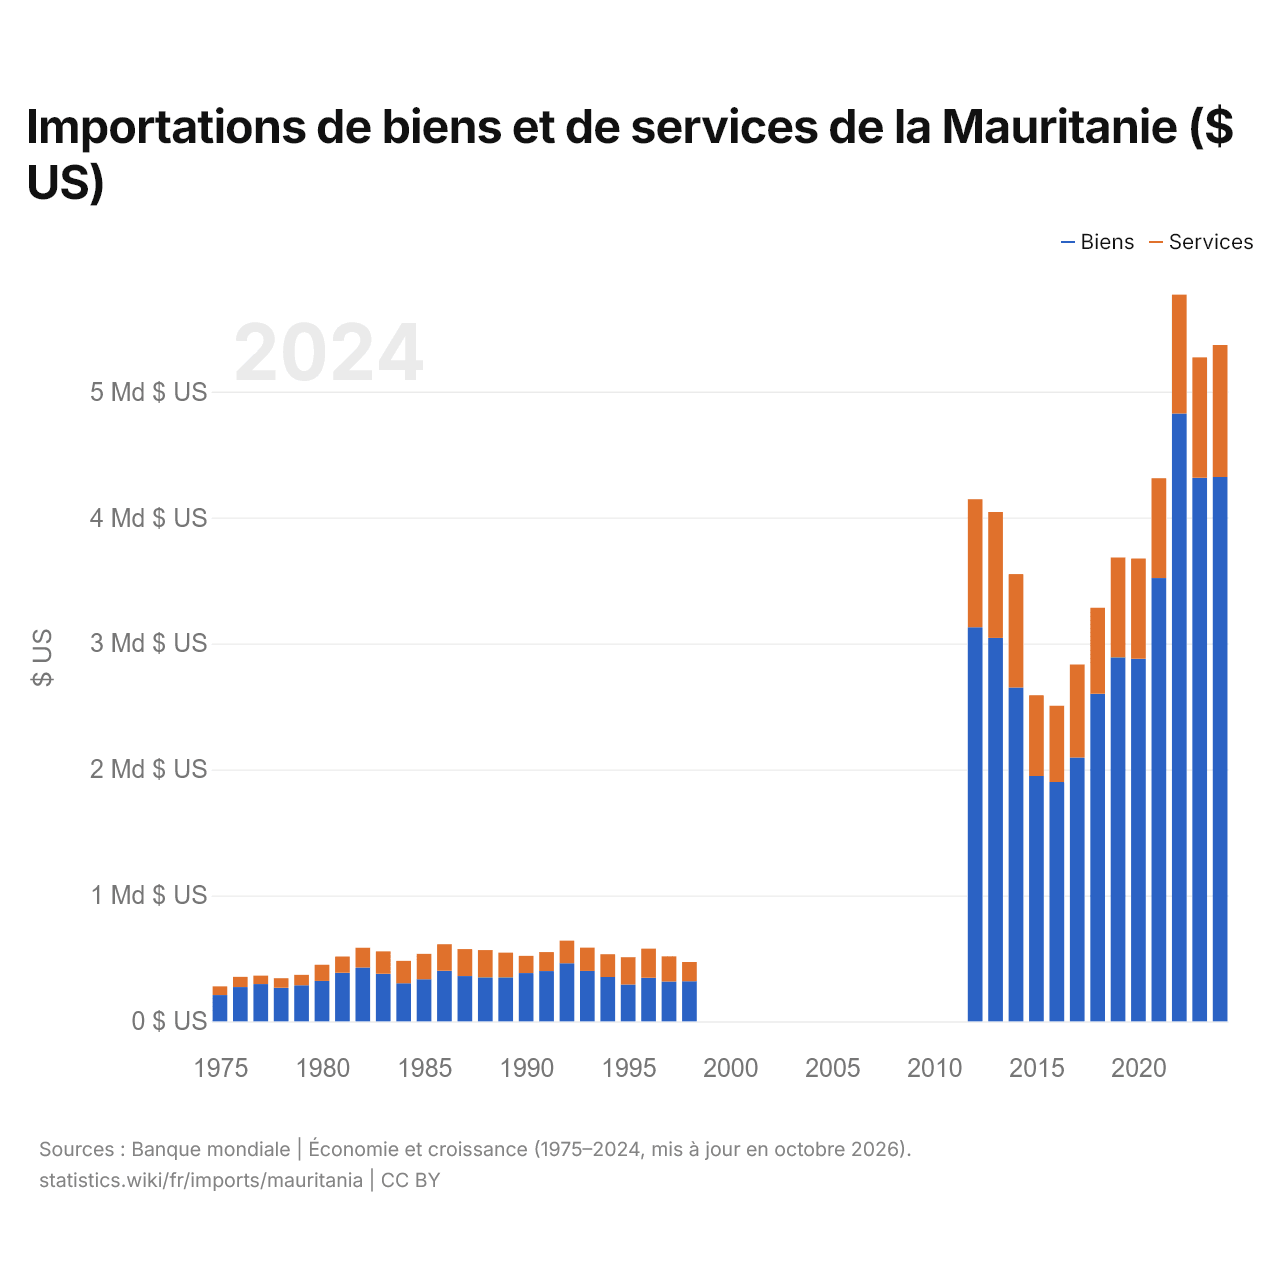
Importations de biens et de services de la Mauritanie ($ US)
| Année | $ US | |
|---|---|---|
| Biens | Services | |
| 2024 | 4 321 587 419 $ US | 1 048 065 826 $ US |
| 2023 | 4 315 557 759 $ US | 955 736 803 $ US |
| 2022 | 4 826 557 759 $ US | 943 008 664 $ US |
| 2021 | 3 519 466 035 $ US | 792 868 434 $ US |
| 2020 | 2 878 853 980 $ US | 795 835 958 $ US |
| 2019 | 2 889 457 235 $ US | 793 481 589 $ US |
| 2018 | 2 601 454 256 $ US | 682 481 300 $ US |
| 2017 | 2 093 931 424 $ US | 739 686 355 $ US |
| 2016 | 1 900 061 699 $ US | 605 386 960 $ US |
| 2015 | 1 948 002 121 $ US | 640 745 973 $ US |
| 2014 | 2 650 402 611 $ US | 900 329 555 $ US |
| 2013 | 3 044 334 096 $ US | 999 404 906 $ US |
| 2012 | 3 128 825 830 $ US | 1 016 668 566 $ US |
| 2011 | - | - |
| 2010 | - | - |
| 2009 | - | - |
| 2008 | - | - |
| 2007 | - | - |
| 2006 | - | - |
| 2005 | - | - |
| 2004 | - | - |
| 2003 | - | - |
| 2002 | - | - |
| 2001 | - | - |
| 2000 | - | - |
| 1999 | - | - |
| 1998 | 318 666 849 $ US | 152 534 145 $ US |
| 1997 | 316 463 254 $ US | 199 956 098 $ US |
| 1996 | 346 104 235 $ US | 231 275 430 $ US |
| 1995 | 292 559 818 $ US | 216 986 681 $ US |
| 1994 | 352 271 900 $ US | 181 072 223 $ US |
| 1993 | 400 369 739 $ US | 184 941 400 $ US |
| 1992 | 461 271 965 $ US | 179 071 377 $ US |
| 1991 | 399 105 100 $ US | 150 953 374 $ US |
| 1990 | 382 910 097 $ US | 136 845 762 $ US |
| 1989 | 349 327 522 $ US | 196 036 171 $ US |
| 1988 | 348 853 432 $ US | 217 045 165 $ US |
| 1987 | 359 185 147 $ US | 214 528 391 $ US |
| 1986 | 401 196 639 $ US | 211 146 218 $ US |
| 1985 | 333 904 132 $ US | 201 777 259 $ US |
| 1984 | 302 115 877 $ US | 177 780 680 $ US |
| 1983 | 378 240 642 $ US | 177 170 310 $ US |
| 1982 | 426 566 650 $ US | 157 545 515 $ US |
| 1981 | 386 223 794 $ US | 128 126 995 $ US |
| 1980 | 321 273 974 $ US | 127 760 364 $ US |
| 1979 | 286 016 234 $ US | 83 172 632 $ US |
| 1978 | 267 099 919 $ US | 75 255 890 $ US |
| 1977 | 295 522 306 $ US | 67 190 085 $ US |
| 1976 | 272 021 056 $ US | 80 893 336 $ US |
| 1975 | 208 494 522 $ US | 69 181 113 $ US |
Les importations de biens de la Mauritanie s'élèvent à 4,32 milliards de dollars (2024) et celles de services à 1,05 milliard de dollars ; les services représentent 19,5 % du total, contre 24,9 % en 1975.
La Mauritanie dans le classement mondial des importations, 2025
| Rang | Pays | Importations | Part mondiale | |
|---|---|---|---|---|
| 131 |
 Syrie |
6,80 Md $US (2022) | 0,02 % | |
| 132 |
 Bahamas |
6,56 Md $US (2024) | 0,02 % | |
| 133 |
 Madagascar |
6,46 Md $US | 0,02 % | |
| 134 |
 Mauritanie |
6,33 Md $US | 0,02 % | |
| 135 |
 Gabon |
6,30 Md $US | 0,02 % | |
| 136 |
 Monténégro |
6,07 Md $US | 0,02 % | |
| 137 |
 Rwanda |
5,75 Md $US | 0,02 % |
Importations de biens et services de la Mauritanie, % du PIB, 1961–2025
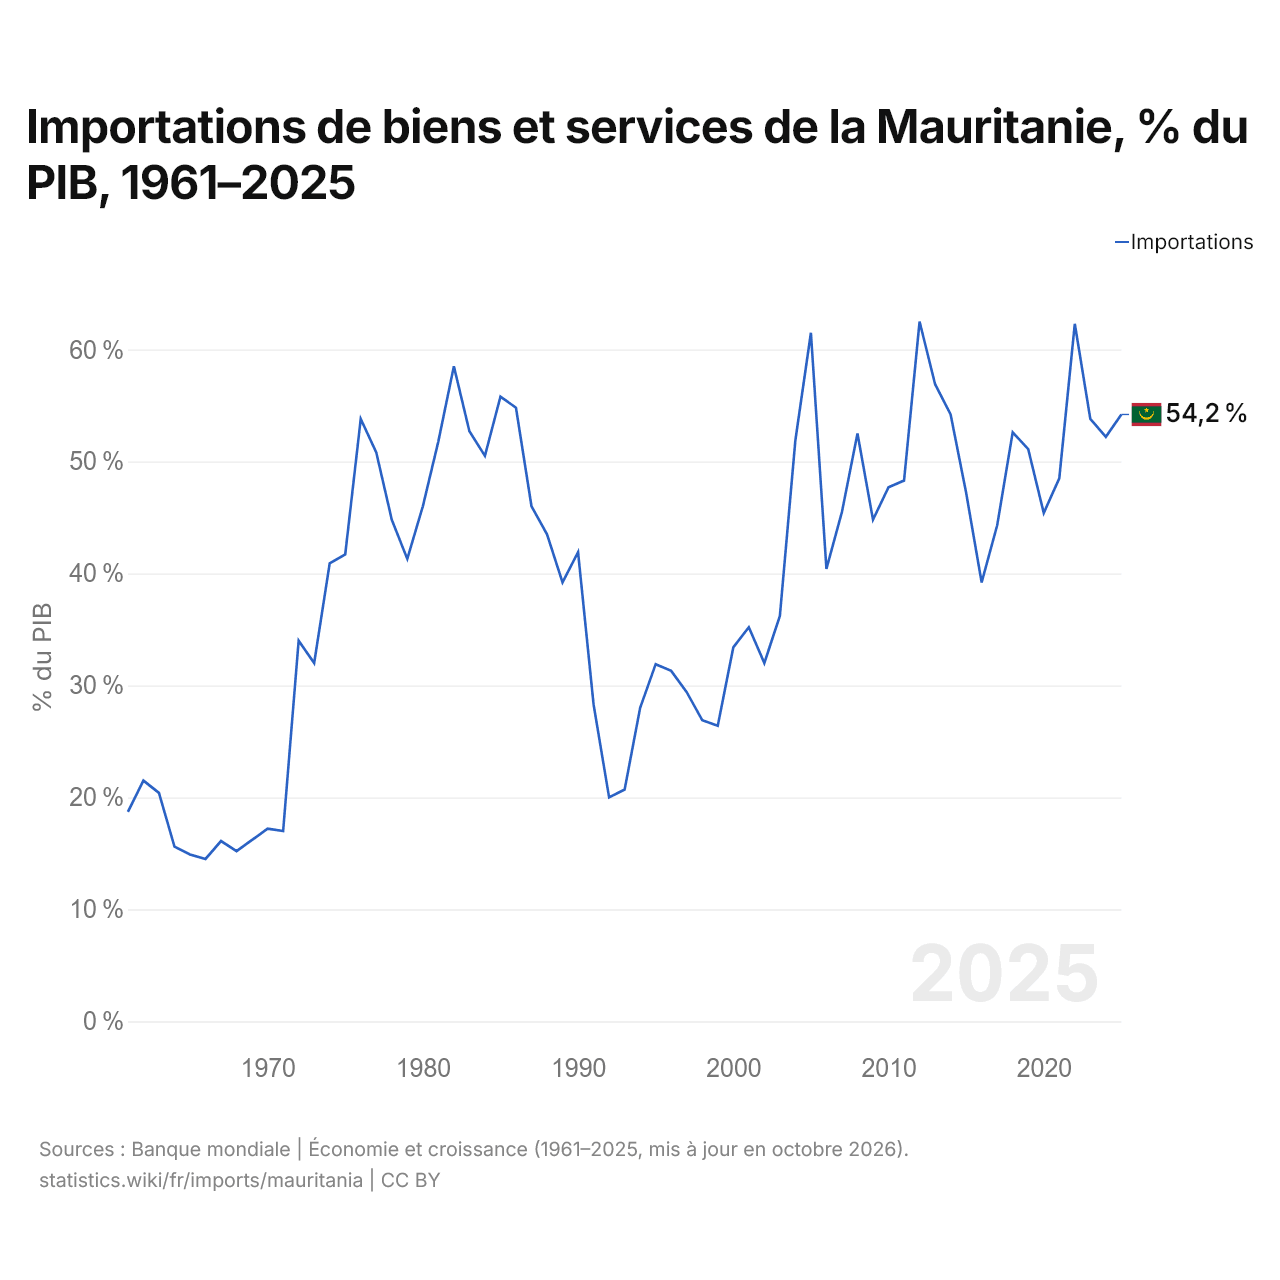
En 2025, les importations de biens et services de la Mauritanie équivalaient à 54,2 % de son PIB, contre 18,7 % en 1961. La part la plus élevée a été de 62,5 %, en 2012.
Comparer les importations de la Mauritanie avec celles d'autres pays
Sources :
- Banque mondiale | Économie et croissance (1961–2025, mis à jour en octobre 2026)
- TradeMap (2001–2025, mis à jour en octobre 2026)
Creative Commons Attribution (CC BY) : vous pouvez copier, partager, adapter et réutiliser ce contenu, y compris à des fins commerciales, à condition de citer statistics.wiki et d’indiquer les modifications apportées. Les sources citées ci-dessus peuvent avoir leurs propres conditions de licence.