
Importations de biens et services de Maurice par année ($ US), 1976–2025
| Année | $ US | Rang mondial |
|---|---|---|
| Importations | Rang mondial | |
| 2025 | 12 103 211 066 $ US | #114 |
| 2024 | 11 697 830 481 $ US | #112 |
| 2023 | 11 015 762 508 $ US | #110 |
| 2022 | 10 431 237 060 $ US | #108 |
| 2021 | 8 649 785 320 $ US | #114 |
| 2020 | 7 606 361 594 $ US | #110 |
| 2019 | 9 899 441 321 $ US | #104 |
| 2018 | 9 718 132 632 $ US | #106 |
| 2017 | 9 258 119 622 $ US | #106 |
| 2016 | 8 325 979 802 $ US | #106 |
| 2015 | 8 339 604 127 $ US | #108 |
| 2014 | 9 298 757 802 $ US | #108 |
| 2013 | 8 992 240 669 $ US | #107 |
| 2012 | 7 651 255 049 $ US | #114 |
| 2011 | 7 482 769 252 $ US | #115 |
| 2010 | 6 211 295 331 $ US | #112 |
| 2009 | 5 166 991 032 $ US | #114 |
| 2008 | 6 416 653 411 $ US | #111 |
| 2007 | 5 284 084 362 $ US | #109 |
| 2006 | 4 812 434 640 $ US | #102 |
| 2005 | 4 167 176 195 $ US | #102 |
| 2004 | 3 627 941 100 $ US | #102 |
| 2003 | 3 147 414 250 $ US | #99 |
| 2002 | 2 818 319 872 $ US | #100 |
| 2001 | 2 850 845 016 $ US | #98 |
| 2000 | 2 854 809 974 $ US | #97 |
| 1999 | 2 905 445 797 $ US | #97 |
| 1998 | 2 773 474 377 $ US | #99 |
| 1997 | 2 778 044 511 $ US | #96 |
| 1996 | 2 842 088 789 $ US | #93 |
| 1995 | 2 467 917 731 $ US | #91 |
| 1994 | 2 329 184 031 $ US | #88 |
| 1993 | 2 097 741 815 $ US | #88 |
| 1992 | 2 016 679 338 $ US | #88 |
| 1991 | 1 886 942 169 $ US | #90 |
| 1990 | 1 914 627 321 $ US | #88 |
| 1989 | 1 560 745 158 $ US | #85 |
| 1988 | 1 487 454 164 $ US | #83 |
| 1987 | 1 175 706 233 $ US | #86 |
| 1986 | 787 666 569 $ US | #89 |
| 1985 | 596 406 679 $ US | #89 |
| 1984 | 541 291 286 $ US | #90 |
| 1983 | 512 463 481 $ US | #95 |
| 1982 | 538 880 024 $ US | #95 |
| 1981 | 630 445 199 $ US | #92 |
| 1980 | 695 184 410 $ US | #89 |
| 1979 | 659 151 682 $ US | #82 |
| 1978 | 564 148 119 $ US | #81 |
| 1977 | 489 609 384 $ US | #80 |
| 1976 | 405 895 361 $ US | #81 |
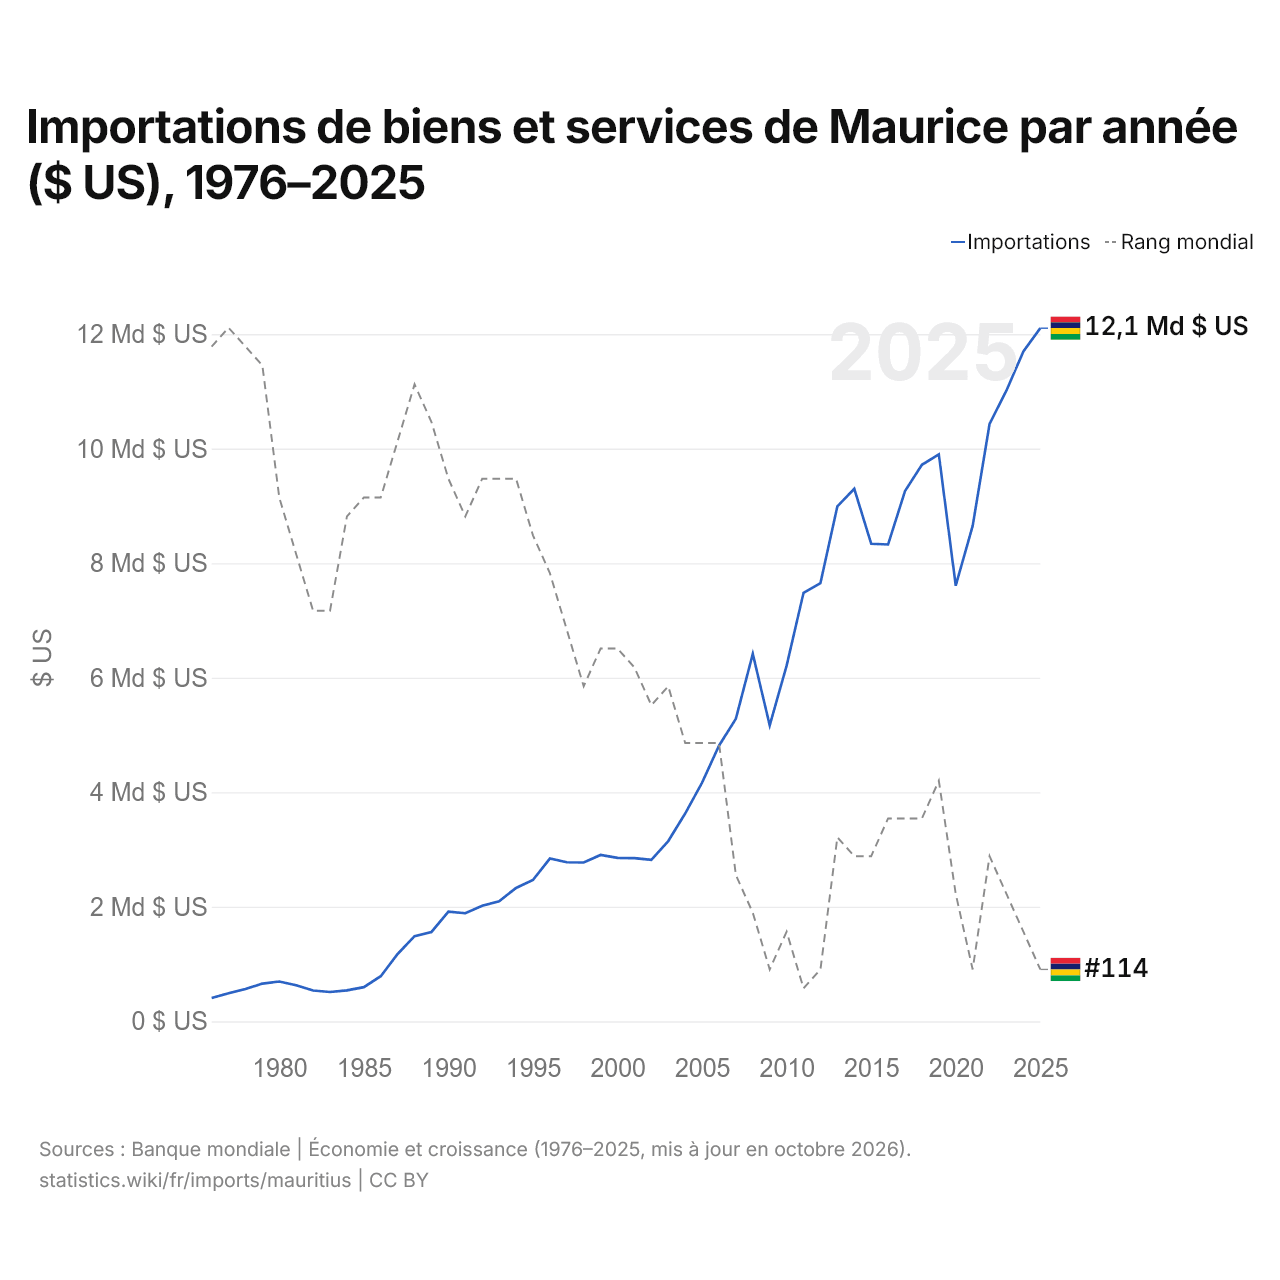
En 2025, les importations de biens et services de Maurice s'élevaient à 12,1 milliards de dollars, contre 406 millions de dollars en 1976. Elles se classaient au 114e rang mondial, en baisse par rapport au 112e rang en 2024. Leur meilleur rang a été le 80e, occupé pour la dernière fois en 1977.
En 2025, les importations de biens et services de Maurice étaient les 19es plus élevées de 50 pays situés en Afrique. En 2025, les importations de Maurice dépassaient ses exportations de 1,59 milliard de dollars, soit un déficit commercial. Le commerce de Maurice, exportations et importations réunies, équivalait à 139,9 % de son PIB en 2025, au 25e rang mondial.
Importations de biens de Maurice par catégorie, 2025
Importations de biens, 2025: 6,97 Md $US
En 2025, la première catégorie des importations de biens de Maurice était « pétrole, gaz, minerais et autres matières premières », avec 25,1 %, suivie de « machines, électronique et véhicules », avec 24,8 %.
Origines des importations de biens de Maurice : les 10 premières, 2025
| Rang | Pays | Importations de biens | Part | |
|---|---|---|---|---|
| 1 |
 Chine |
1,21 Md $US | 17,4 % | |
| 2 |
 EAU |
756 M $US | 10,9 % | |
| 3 |
 Inde |
568 M $US | 8,15 % | |
| 4 |
 Afrique du Sud |
451 M $US | 6,48 % | |
| 5 |
 France |
414 M $US | 5,94 % | vs France |
| 6 |
 Oman |
377 M $US | 5,41 % | |
| 7 |
 Allemagne |
231 M $US | 3,31 % | |
| 8 |
 Japon |
216 M $US | 3,1 % | |
| 9 |
 Brésil |
173 M $US | 2,48 % | |
| 10 |
 États-Unis |
153 M $US | 2,19 % | |
| Autres partenaires et non précisés | 2,41 Md $US | 34,7 % |
Importations de biens de Maurice depuis ses 5 principales origines ($ US), 2001–2025
| Année | $ US | ||||
|---|---|---|---|---|---|
| Chine | Émirats arabes unis | Inde | Afrique du Sud | France | |
| 2025 | 1 213 651 000 $ US | 756 225 000 $ US | 568 024 000 $ US | 451 340 000 $ US | 414 134 000 $ US |
| 2024 | 1 188 303 000 $ US | 847 206 000 $ US | 746 330 000 $ US | 500 527 000 $ US | 406 783 000 $ US |
| 2023 | 996 690 000 $ US | 698 281 000 $ US | 644 950 000 $ US | 458 821 000 $ US | 385 443 000 $ US |
| 2022 | 1 065 540 000 $ US | 595 196 000 $ US | 643 155 000 $ US | 599 144 000 $ US | 371 559 000 $ US |
| 2021 | 917 794 000 $ US | 455 864 000 $ US | 807 955 000 $ US | 413 375 000 $ US | 346 744 000 $ US |
| 2020 | 703 646 000 $ US | 521 022 000 $ US | 404 513 000 $ US | 324 996 000 $ US | 307 639 000 $ US |
| 2019 | 934 919 000 $ US | 407 574 000 $ US | 776 221 000 $ US | 452 235 000 $ US | 392 858 000 $ US |
| 2018 | 928 288 000 $ US | 188 778 000 $ US | 1 027 932 000 $ US | 519 854 000 $ US | 461 715 000 $ US |
| 2017 | 804 103 000 $ US | 102 206 000 $ US | 823 045 000 $ US | 409 070 000 $ US | 389 684 000 $ US |
| 2016 | 824 422 000 $ US | 86 546 000 $ US | 767 916 000 $ US | 348 428 000 $ US | 365 467 000 $ US |
| 2015 | 814 341 000 $ US | 68 596 000 $ US | 810 609 000 $ US | 288 689 000 $ US | 319 554 000 $ US |
| 2014 | 906 105 000 $ US | 104 946 000 $ US | 1 212 289 000 $ US | 369 833 000 $ US | 431 191 000 $ US |
| 2013 | 792 130 000 $ US | 97 024 000 $ US | 1 299 895 000 $ US | 333 322 000 $ US | 441 329 000 $ US |
| 2012 | 931 450 000 $ US | 100 986 000 $ US | 1 301 552 000 $ US | 377 909 000 $ US | 479 448 000 $ US |
| 2011 | 724 255 000 $ US | 69 363 000 $ US | 1 207 848 000 $ US | 365 235 000 $ US | 465 035 000 $ US |
| 2010 | 586 239 000 $ US | 37 874 000 $ US | 983 630 000 $ US | 370 539 000 $ US | 388 592 000 $ US |
| 2009 | 468 856 000 $ US | 25 311 000 $ US | 703 226 000 $ US | 321 809 000 $ US | 438 523 000 $ US |
| 2008 | 538 644 000 $ US | 20 283 000 $ US | 1 116 639 000 $ US | 377 175 000 $ US | 363 740 000 $ US |
| 2007 | 443 713 000 $ US | 47 737 000 $ US | 825 945 000 $ US | 286 782 000 $ US | 415 594 000 $ US |
| 2006 | 314 709 000 $ US | 104 284 000 $ US | 494 573 000 $ US | 267 491 000 $ US | 521 563 000 $ US |
| 2005 | 310 247 000 $ US | 121 429 000 $ US | 218 666 000 $ US | 270 782 000 $ US | 241 566 000 $ US |
| 2004 | 256 849 000 $ US | 63 028 000 $ US | 253 565 000 $ US | 310 665 000 $ US | 252 245 000 $ US |
| 2003 | 199 707 000 $ US | 17 392 000 $ US | 195 052 000 $ US | 288 771 000 $ US | 286 067 000 $ US |
| 2002 | 182 914 000 $ US | 57 874 000 $ US | 157 958 000 $ US | 272 463 000 $ US | 241 070 000 $ US |
| 2001 | 142 412 000 $ US | 36 063 000 $ US | 159 667 000 $ US | 275 362 000 $ US | 188 242 000 $ US |
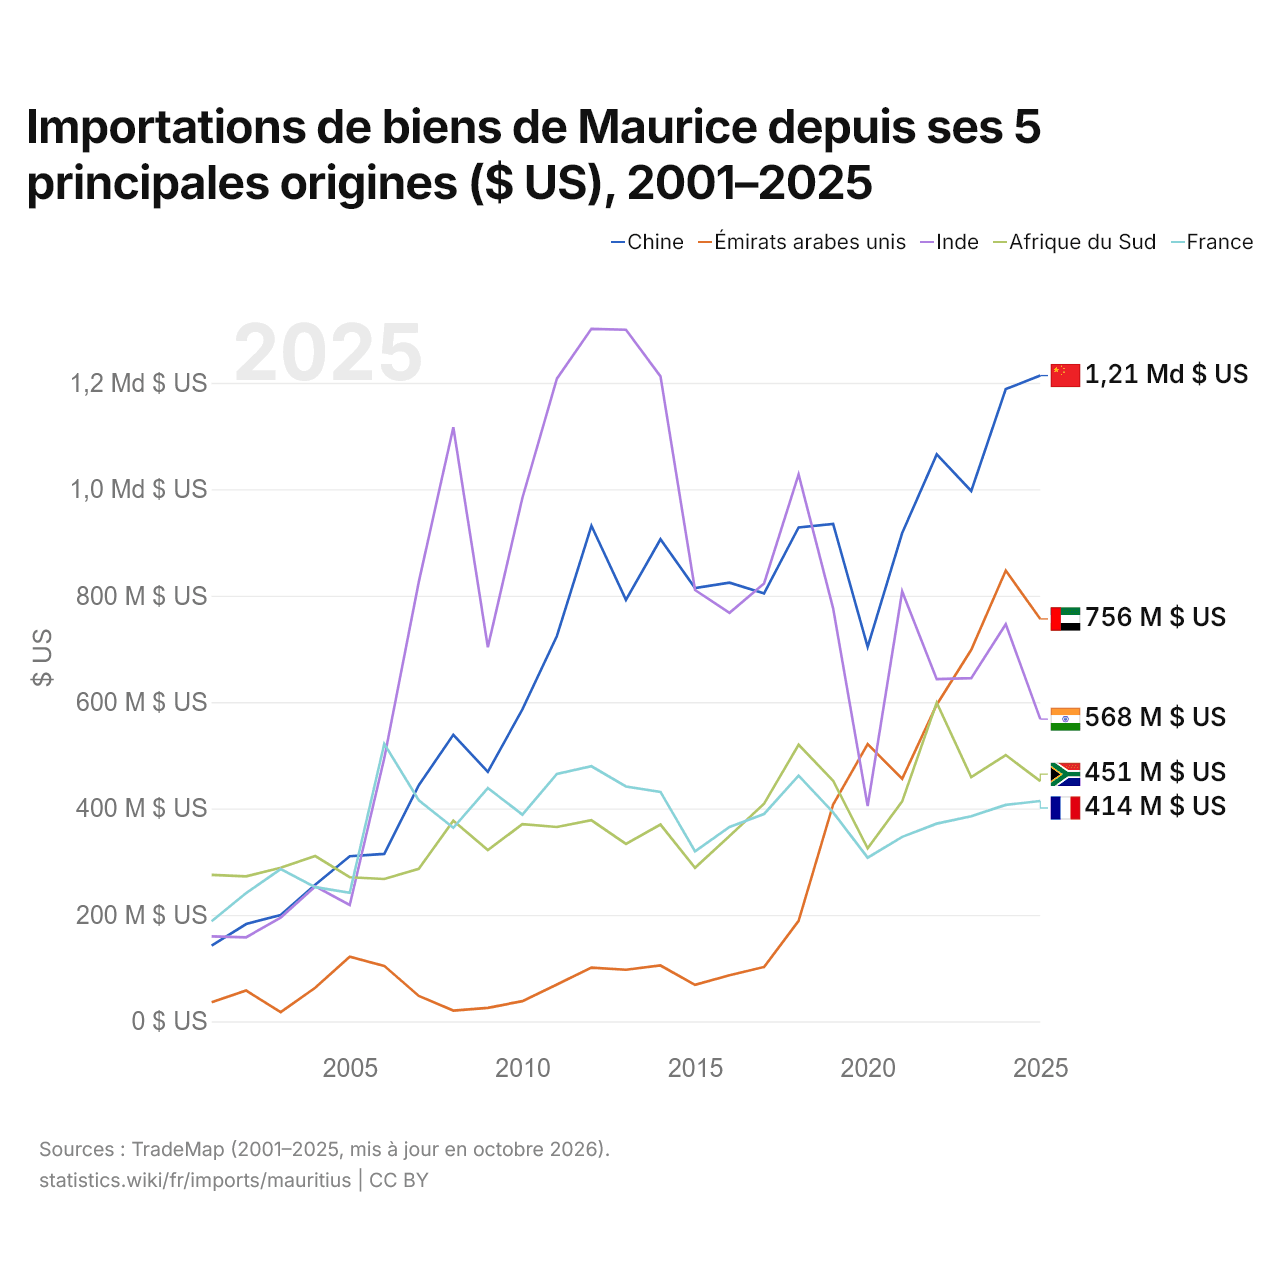
En 2025, les importations de biens s'élevaient à 1,21 milliard de dollars en provenance de la Chine, 756 millions de dollars en provenance des Émirats arabes unis, 568 millions de dollars en provenance de l'Inde, 451 millions de dollars en provenance de l'Afrique du Sud et 414 millions de dollars en provenance de la France. Le premier rang des cinq fournisseurs de Maurice est occupé par la Chine depuis 2019. Le changement le plus récent dans leur ordre remonte à 2023, quand les importations de Maurice en provenance des Émirats arabes unis ont dépassé celles en provenance de l'Inde.
Importations de biens et de services de Maurice ($ US)
| Année | $ US | |
|---|---|---|
| Biens | Services | |
| 2024 | 6 345 507 724 $ US | 2 280 055 521 $ US |
| 2023 | 5 895 871 041 $ US | 2 132 522 694 $ US |
| 2022 | 6 005 093 431 $ US | 2 047 044 010 $ US |
| 2021 | 4 644 442 857 $ US | 1 412 192 943 $ US |
| 2020 | 3 914 640 434 $ US | 1 307 417 479 $ US |
| 2019 | 5 293 585 945 $ US | 2 070 984 742 $ US |
| 2018 | 5 380 746 638 $ US | 2 145 851 515 $ US |
| 2017 | 4 990 109 379 $ US | 2 179 360 589 $ US |
| 2016 | 4 407 446 280 $ US | 2 052 058 297 $ US |
| 2015 | 4 524 114 794 $ US | 2 041 060 567 $ US |
| 2014 | 5 353 894 555 $ US | 2 123 615 253 $ US |
| 2013 | 5 139 046 466 $ US | 2 210 688 950 $ US |
| 2012 | 5 104 770 500 $ US | 2 443 385 569 $ US |
| 2011 | 4 917 361 939 $ US | 2 470 079 082 $ US |
| 2010 | 4 156 740 347 $ US | 1 978 884 434 $ US |
| 2009 | 3 503 926 834 $ US | 1 607 258 838 $ US |
| 2008 | 4 385 993 314 $ US | 1 919 929 153 $ US |
| 2007 | 3 655 656 548 $ US | 1 569 373 351 $ US |
| 2006 | 3 408 815 876 $ US | 1 316 861 478 $ US |
| 2005 | 2 935 200 756 $ US | 1 197 749 447 $ US |
| 2004 | 2 572 585 606 $ US | 1 023 321 076 $ US |
| 2003 | 2 201 072 974 $ US | 906 287 381 $ US |
| 2002 | 2 012 562 578 $ US | 792 727 190 $ US |
| 2001 | 1 845 970 237 $ US | 810 095 316 $ US |
| 2000 | 1 944 356 996 $ US | 762 533 077 $ US |
| 1999 | 2 107 853 728 $ US | 728 227 570 $ US |
| 1998 | 1 933 342 086 $ US | 718 011 558 $ US |
| 1997 | 2 036 115 021 $ US | 656 305 763 $ US |
| 1996 | 2 136 274 659 $ US | 672 941 561 $ US |
| 1995 | 1 812 229 732 $ US | 641 308 922 $ US |
| 1994 | 1 773 905 878 $ US | 546 369 692 $ US |
| 1993 | 1 576 040 378 $ US | 521 701 437 $ US |
| 1992 | 1 493 907 908 $ US | 522 771 387 $ US |
| 1991 | 1 438 509 868 $ US | 448 432 260 $ US |
| 1990 | 1 494 806 057 $ US | 420 965 051 $ US |
| 1989 | 1 217 657 975 $ US | 340 333 076 $ US |
| 1988 | 1 177 803 534 $ US | 307 120 439 $ US |
| 1987 | 925 438 693 $ US | 247 006 250 $ US |
| 1986 | 622 068 698 $ US | 164 558 223 $ US |
| 1985 | 465 274 907 $ US | 130 484 195 $ US |
| 1984 | 414 989 976 $ US | 126 301 297 $ US |
| 1983 | 385 778 476 $ US | 126 685 005 $ US |
| 1982 | 396 687 070 $ US | 140 905 307 $ US |
| 1981 | 475 911 170 $ US | 149 946 148 $ US |
| 1980 | 515 857 567 $ US | 173 991 313 $ US |
| 1979 | 484 297 326 $ US | 172 952 008 $ US |
| 1978 | 418 446 362 $ US | 143 754 741 $ US |
| 1977 | 367 774 573 $ US | 120 624 006 $ US |
| 1976 | 307 414 849 $ US | 66 601 562 $ US |
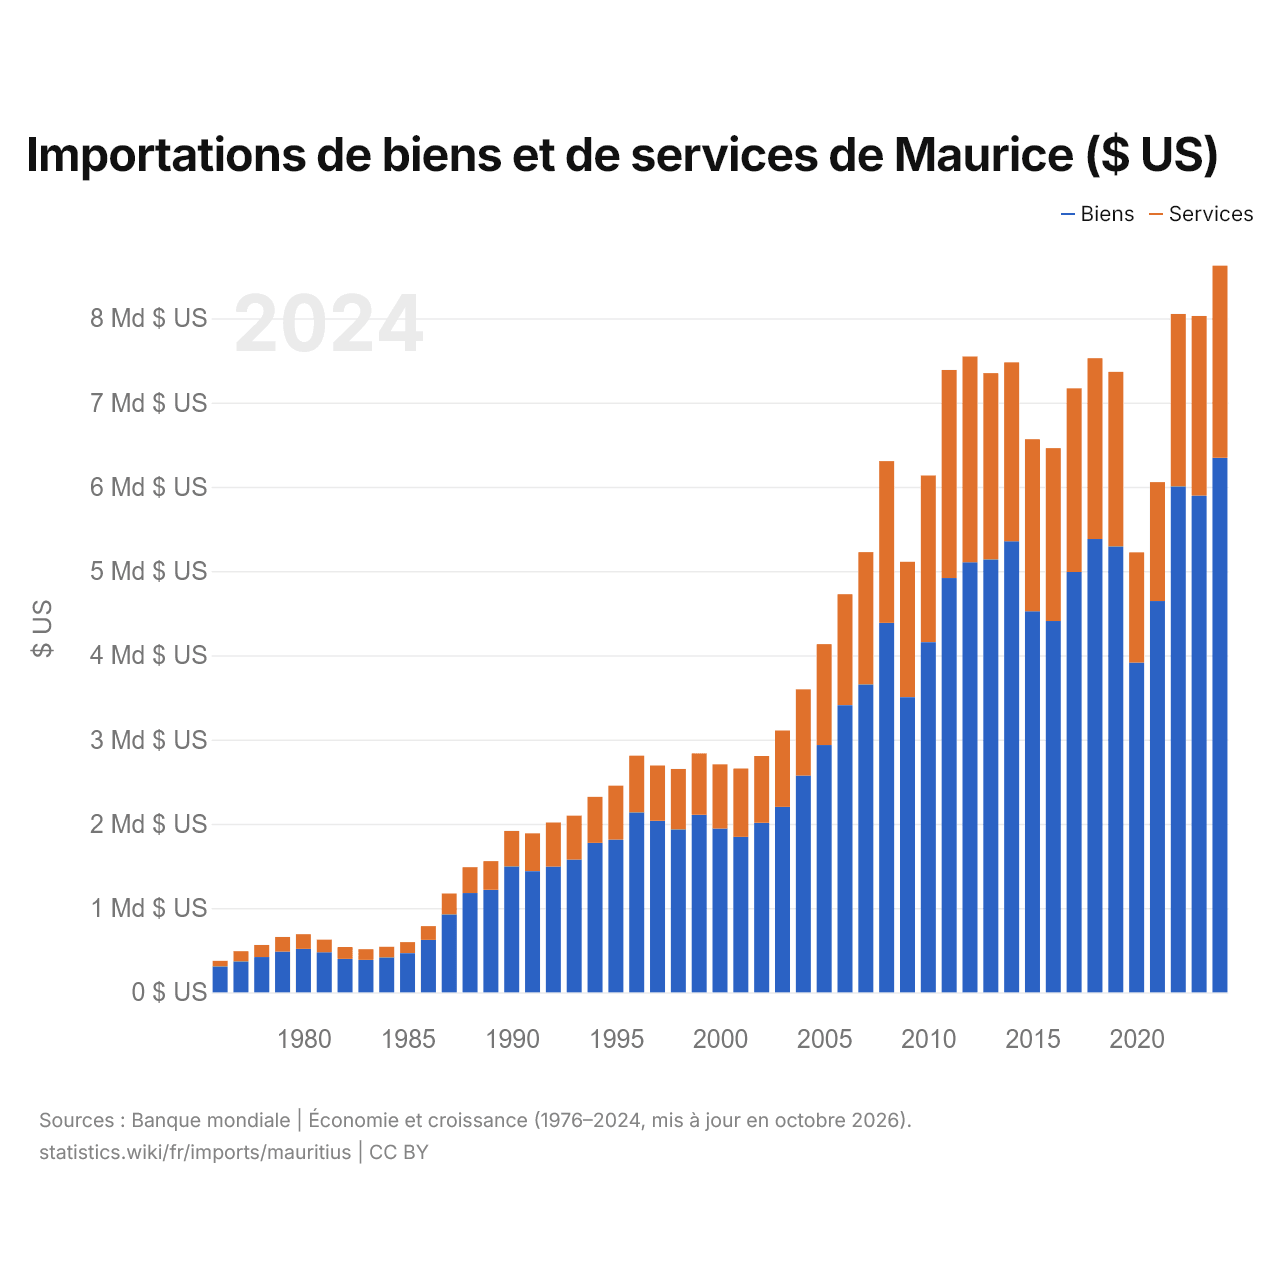
Les importations de biens de Maurice s'élèvent à 6,35 milliards de dollars (2024) et celles de services à 2,28 milliards de dollars ; les services représentent 26,4 % du total, contre 17,8 % en 1976.
Maurice dans le classement mondial des importations, 2025
| Rang | Pays | Importations | Part mondiale | |
|---|---|---|---|---|
| 111 |
 Mozambique |
12,4 Md $US | 0,04 % | |
| 112 |
 Moldavie |
12,4 Md $US | 0,04 % | |
| 113 |
 Nicaragua |
12,2 Md $US | 0,04 % | |
| 114 |
 Maurice |
12,1 Md $US | 0,04 % | |
| 115 |
 Afghanistan |
12,1 Md $US (2024) | 0,04 % | |
| 116 |
 Cameroun |
12,0 Md $US | 0,04 % | |
| 117 |
 Guyana |
11,0 Md $US (2023) | 0,04 % |
Importations de biens et services de Maurice, % du PIB, 1976–2025
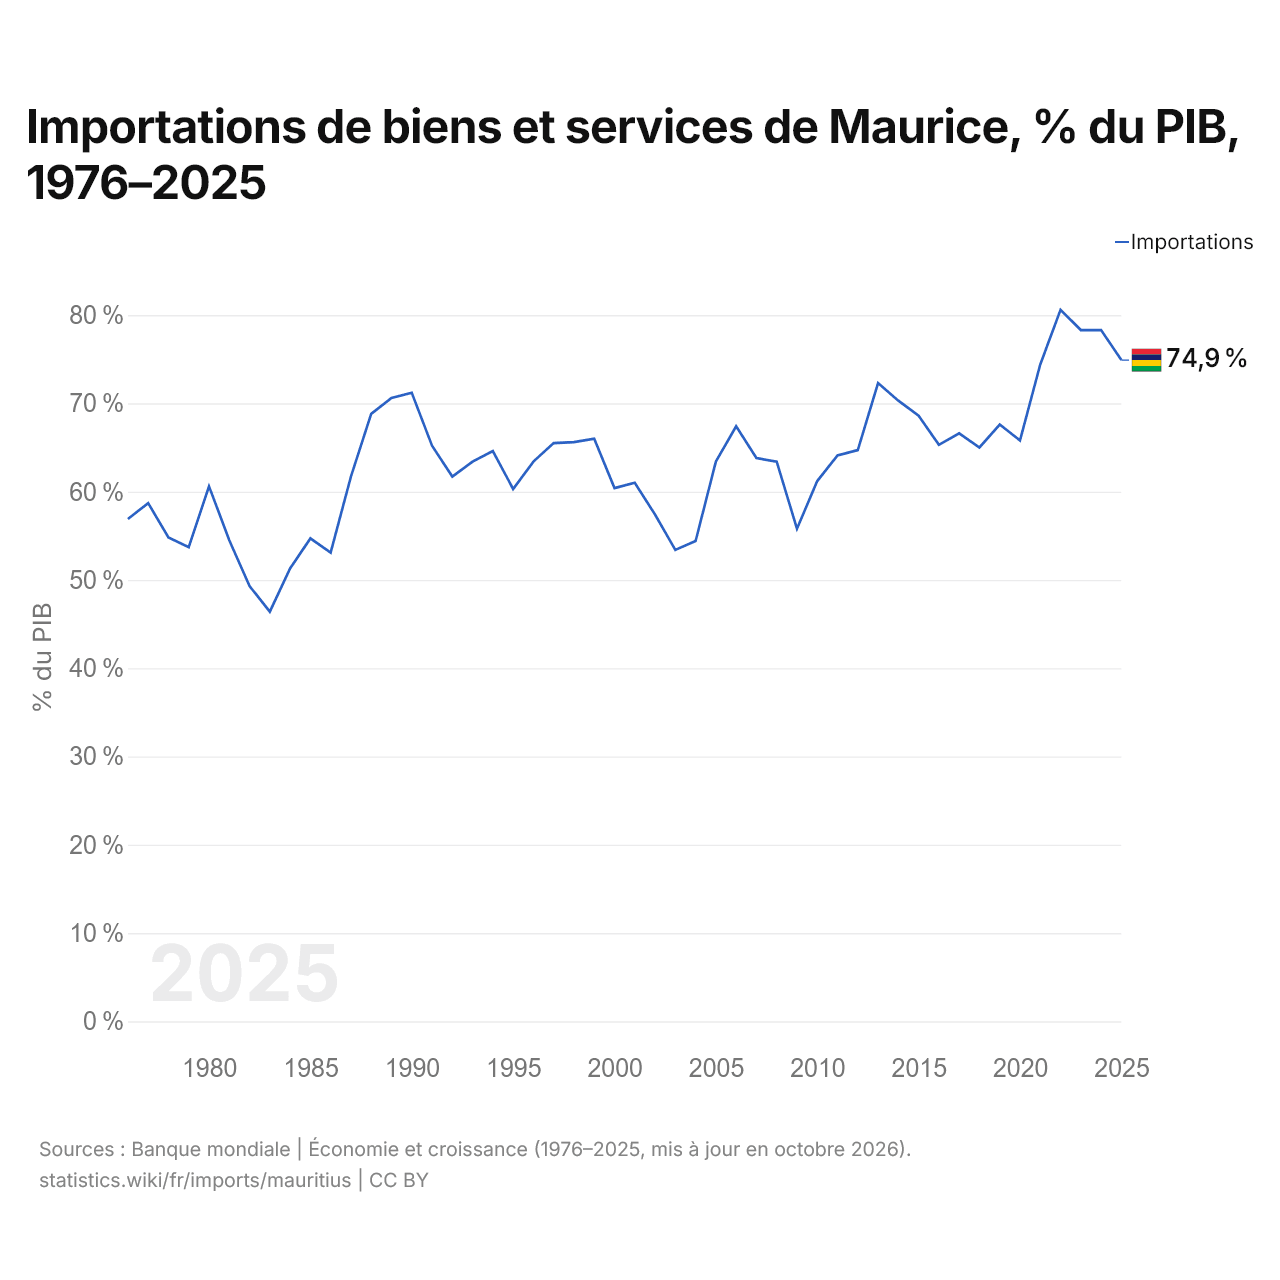
En 2025, les importations de biens et services de Maurice équivalaient à 74,9 % de son PIB, contre 56,9 % en 1976. La part la plus élevée a été de 80,6 %, en 2022.
Comparer les importations de Maurice avec celles d'autres pays
Sources :
- TradeMap (2001–2025, mis à jour en octobre 2026)
- Banque mondiale | Économie et croissance (1976–2025, mis à jour en octobre 2026)
Creative Commons Attribution (CC BY) : vous pouvez copier, partager, adapter et réutiliser ce contenu, y compris à des fins commerciales, à condition de citer statistics.wiki et d’indiquer les modifications apportées. Les sources citées ci-dessus peuvent avoir leurs propres conditions de licence.