
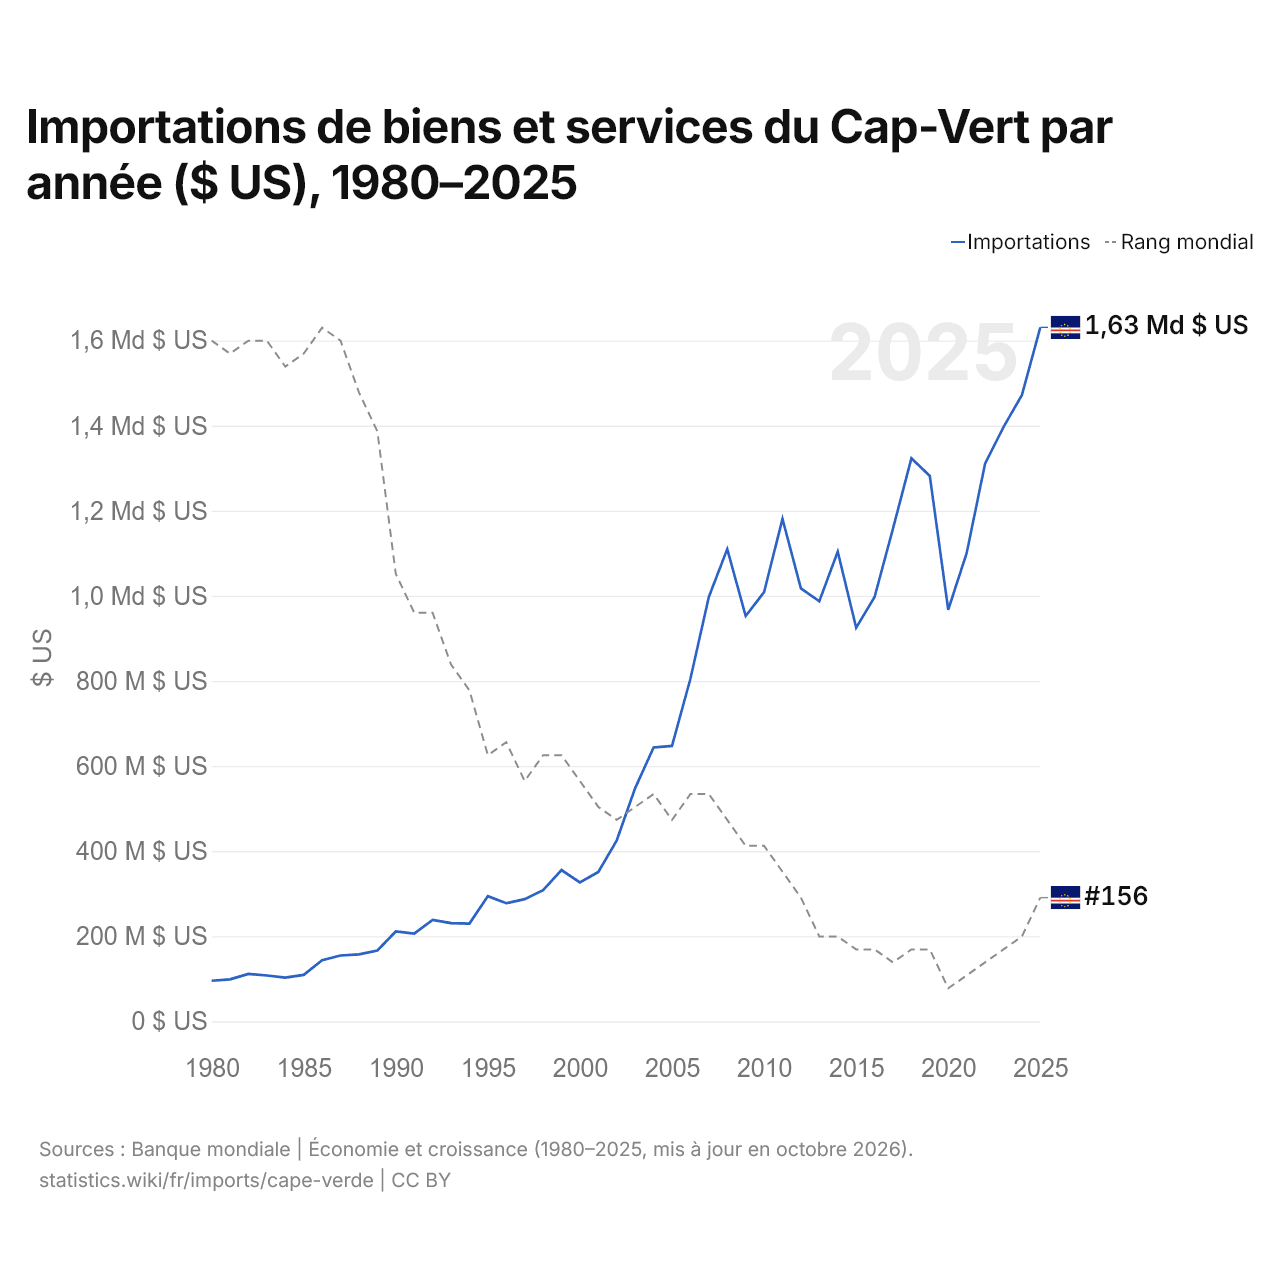
Importations de biens et services du Cap-Vert par année ($ US), 1980–2025
| Année | $ US | Rang mondial |
|---|---|---|
| Importations | Rang mondial | |
| 2025 | 1 630 785 621 $ US | #156 |
| 2024 | 1 471 461 002 $ US | #159 |
| 2023 | 1 396 322 814 $ US | #160 |
| 2022 | 1 310 225 013 $ US | #161 |
| 2021 | 1 099 895 576 $ US | #162 |
| 2020 | 967 252 868 $ US | #163 |
| 2019 | 1 281 435 257 $ US | #160 |
| 2018 | 1 323 093 455 $ US | #160 |
| 2017 | 1 157 777 243 $ US | #161 |
| 2016 | 997 132 828 $ US | #160 |
| 2015 | 925 207 213 $ US | #160 |
| 2014 | 1 103 776 763 $ US | #159 |
| 2013 | 987 126 463 $ US | #159 |
| 2012 | 1 017 500 236 $ US | #156 |
| 2011 | 1 180 649 422 $ US | #154 |
| 2010 | 1 008 442 096 $ US | #152 |
| 2009 | 952 528 352 $ US | #152 |
| 2008 | 1 109 653 505 $ US | #150 |
| 2007 | 997 366 408 $ US | #148 |
| 2006 | 805 032 687 $ US | #148 |
| 2005 | 647 187 056 $ US | #150 |
| 2004 | 643 415 992 $ US | #148 |
| 2003 | 548 170 327 $ US | #149 |
| 2002 | 425 325 210 $ US | #150 |
| 2001 | 351 111 188 $ US | #149 |
| 2000 | 326 304 705 $ US | #147 |
| 1999 | 355 408 993 $ US | #145 |
| 1998 | 308 372 216 $ US | #145 |
| 1997 | 287 190 631 $ US | #147 |
| 1996 | 277 548 406 $ US | #144 |
| 1995 | 294 133 736 $ US | #145 |
| 1994 | 229 787 767 $ US | #140 |
| 1993 | 230 719 808 $ US | #138 |
| 1992 | 238 072 378 $ US | #134 |
| 1991 | 205 936 310 $ US | #134 |
| 1990 | 211 201 178 $ US | #131 |
| 1989 | 166 386 034 $ US | #120 |
| 1988 | 157 247 386 $ US | #117 |
| 1987 | 154 640 256 $ US | #113 |
| 1986 | 143 832 316 $ US | #112 |
| 1985 | 109 057 058 $ US | #114 |
| 1984 | 102 579 320 $ US | #115 |
| 1983 | 107 746 680 $ US | #113 |
| 1982 | 111 363 313 $ US | #113 |
| 1981 | 98 597 399 $ US | #114 |
| 1980 | 95 270 962 $ US | #113 |
En 2025, les importations de biens et services du Cap-Vert s'élevaient à 1,63 milliard de dollars, contre 95,3 millions de dollars en 1980. Elles se classaient au 156e rang mondial, en hausse par rapport au 159e rang en 2024. Leur meilleur rang a été le 112e, occupé pour la dernière fois en 1986.
En 2025, les importations de biens et services du Cap-Vert étaient les 43es plus élevées de 50 pays situés en Afrique. En 2025, les importations du Cap-Vert dépassaient ses exportations de 348 millions de dollars, soit un déficit commercial. Le commerce du Cap-Vert, exportations et importations réunies, équivalait à 95,3 % de son PIB en 2025, au 67e rang mondial.
Importations de biens du Cap-Vert par catégorie, 2025
Importations de biens, 2025: 1,11 Md $US
En 2025, la première catégorie des importations de biens du Cap-Vert était « machines, électronique et véhicules », avec 25,2 %, suivie de « pétrole, gaz, minerais et autres matières premières », avec 16,9 %.
Origines des importations de biens du Cap-Vert : les 10 premières, 2025
| Rang | Pays | Importations de biens | Part | |
|---|---|---|---|---|
| 1 |
 Portugal |
530 M $US | 47,7 % | |
| 2 |
 Espagne |
118 M $US | 10,6 % | |
| 3 |
 Chine |
85,6 M $US | 7,71 % | |
| 4 |
 Brésil |
49,9 M $US | 4,49 % | |
| 5 |
 Pays-Bas |
37,0 M $US | 3,34 % | |
| 6 |
 Togo |
32,4 M $US | 2,92 % | |
| 7 |
 Italie |
28,6 M $US | 2,57 % | |
| 8 |
 France |
22,6 M $US | 2,03 % | vs France |
| 9 |
 États-Unis |
20,8 M $US | 1,87 % | |
| 10 |
 Belgique |
17,3 M $US | 1,56 % | vs Belgique |
| Autres partenaires et non précisés | 169 M $US | 15,2 % |
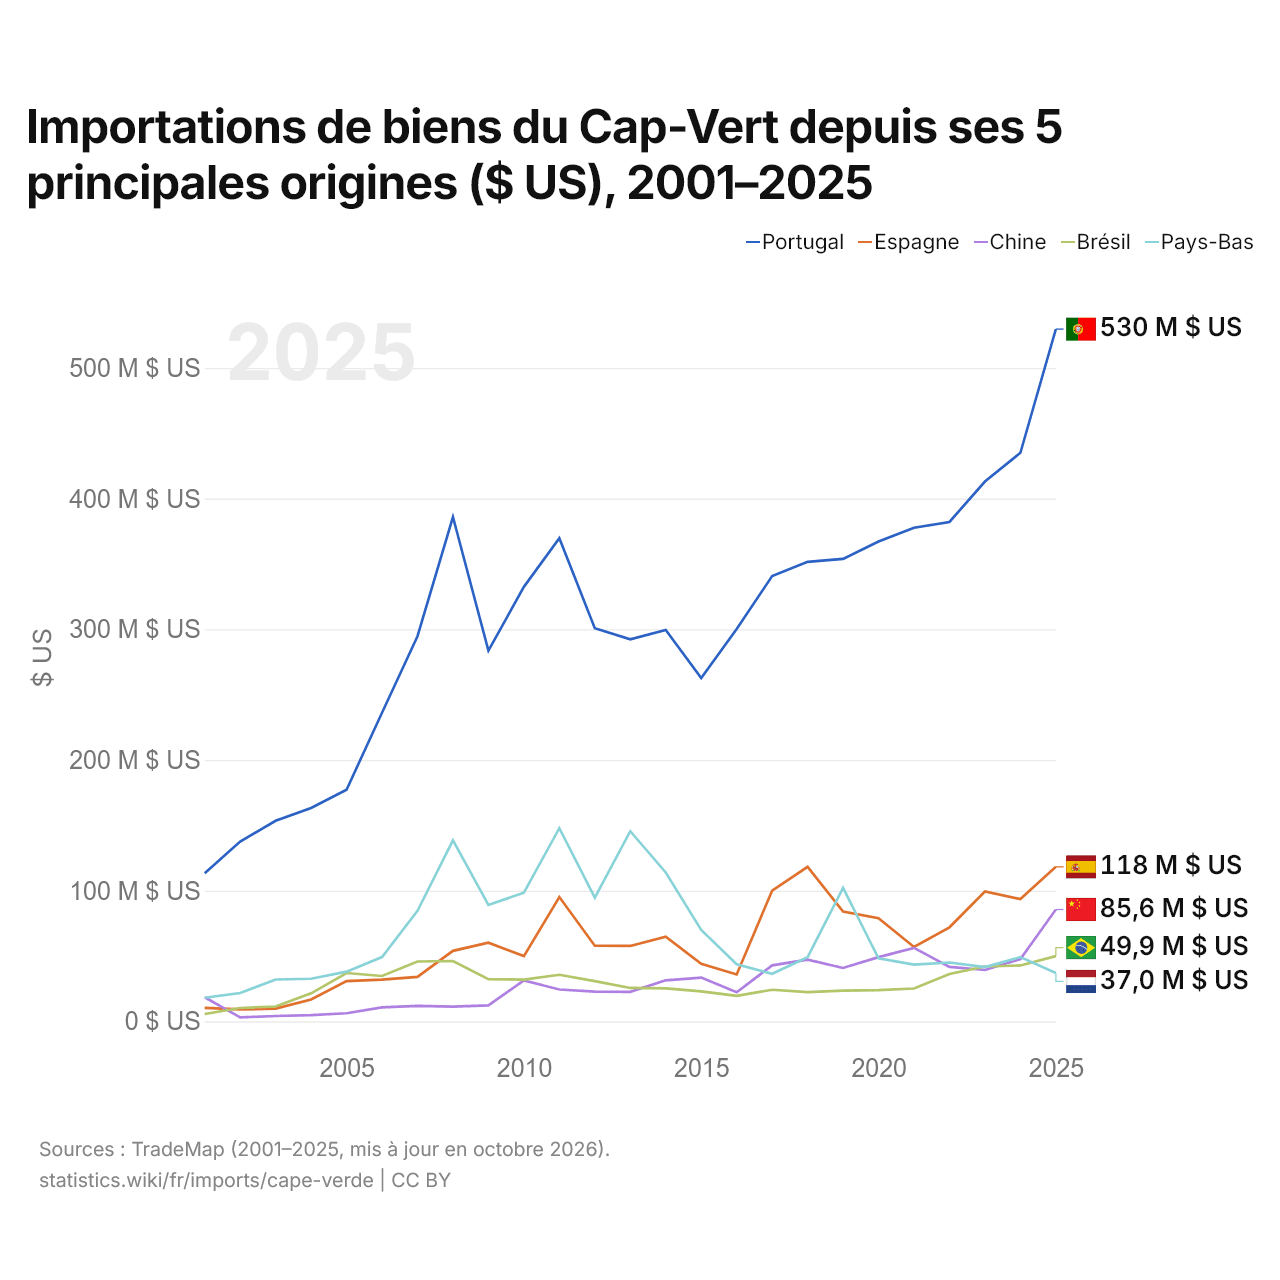
Importations de biens du Cap-Vert depuis ses 5 principales origines ($ US), 2001–2025
| Année | $ US | ||||
|---|---|---|---|---|---|
| Portugal | Espagne | Chine | Brésil | Pays-Bas | |
| 2025 | 529 696 000 $ US | 118 214 000 $ US | 85 576 000 $ US | 49 873 000 $ US | 37 043 000 $ US |
| 2024 | 435 043 000 $ US | 93 509 000 $ US | 47 677 000 $ US | 42 776 000 $ US | 49 147 000 $ US |
| 2023 | 413 077 000 $ US | 99 302 000 $ US | 39 263 000 $ US | 41 927 000 $ US | 41 543 000 $ US |
| 2022 | 382 115 000 $ US | 71 937 000 $ US | 41 641 000 $ US | 36 250 000 $ US | 45 040 000 $ US |
| 2021 | 377 691 000 $ US | 56 873 000 $ US | 56 168 000 $ US | 25 144 000 $ US | 43 425 000 $ US |
| 2020 | 367 187 000 $ US | 78 950 000 $ US | 49 129 000 $ US | 23 940 000 $ US | 48 162 000 $ US |
| 2019 | 353 807 000 $ US | 83 985 000 $ US | 40 821 000 $ US | 23 476 000 $ US | 102 195 000 $ US |
| 2018 | 351 593 000 $ US | 118 201 000 $ US | 47 254 000 $ US | 22 386 000 $ US | 49 125 000 $ US |
| 2017 | 340 712 000 $ US | 100 032 000 $ US | 42 846 000 $ US | 24 187 000 $ US | 36 409 000 $ US |
| 2016 | 300 167 000 $ US | 35 899 000 $ US | 22 277 000 $ US | 19 440 000 $ US | 43 689 000 $ US |
| 2015 | 262 615 000 $ US | 44 018 000 $ US | 33 485 000 $ US | 22 954 000 $ US | 69 983 000 $ US |
| 2014 | 299 516 000 $ US | 64 798 000 $ US | 31 360 000 $ US | 25 200 000 $ US | 113 925 000 $ US |
| 2013 | 292 246 000 $ US | 57 695 000 $ US | 22 555 000 $ US | 25 538 000 $ US | 145 480 000 $ US |
| 2012 | 300 800 000 $ US | 57 884 000 $ US | 22 704 000 $ US | 30 776 000 $ US | 94 567 000 $ US |
| 2011 | 369 663 000 $ US | 95 112 000 $ US | 24 352 000 $ US | 35 606 000 $ US | 147 805 000 $ US |
| 2010 | 332 467 000 $ US | 49 904 000 $ US | 31 358 000 $ US | 31 906 000 $ US | 98 431 000 $ US |
| 2009 | 283 655 000 $ US | 60 124 000 $ US | 12 255 000 $ US | 32 305 000 $ US | 89 056 000 $ US |
| 2008 | 385 893 000 $ US | 53 925 000 $ US | 11 300 000 $ US | 46 192 000 $ US | 138 544 000 $ US |
| 2007 | 294 669 000 $ US | 33 976 000 $ US | 11 802 000 $ US | 45 784 000 $ US | 84 514 000 $ US |
| 2006 | 236 127 000 $ US | 31 877 000 $ US | 10 709 000 $ US | 34 707 000 $ US | 49 153 000 $ US |
| 2005 | 177 238 000 $ US | 30 743 000 $ US | 6 209 000 $ US | 36 993 000 $ US | 38 017 000 $ US |
| 2004 | 163 231 000 $ US | 16 725 000 $ US | 4 780 000 $ US | 21 416 000 $ US | 32 553 000 $ US |
| 2003 | 153 506 000 $ US | 9 764 000 $ US | 4 078 000 $ US | 11 338 000 $ US | 31 978 000 $ US |
| 2002 | 137 563 000 $ US | 9 089 000 $ US | 3 072 000 $ US | 10 198 000 $ US | 21 628 000 $ US |
| 2001 | 113 376 000 $ US | 10 307 000 $ US | 18 404 000 $ US | 5 583 000 $ US | 18 065 000 $ US |
En 2025, les importations de biens s'élevaient à 530 millions de dollars en provenance du Portugal, 118 millions de dollars en provenance de l'Espagne, 85,6 millions de dollars en provenance de la Chine, 49,9 millions de dollars en provenance du Brésil et 37 millions de dollars en provenance des Pays-Bas. Le premier rang des cinq fournisseurs du Cap-Vert est occupé par le Portugal chaque année depuis 2001. Le changement le plus récent dans leur ordre remonte à 2025, quand les importations du Cap-Vert en provenance du Brésil ont dépassé celles en provenance des Pays-Bas.
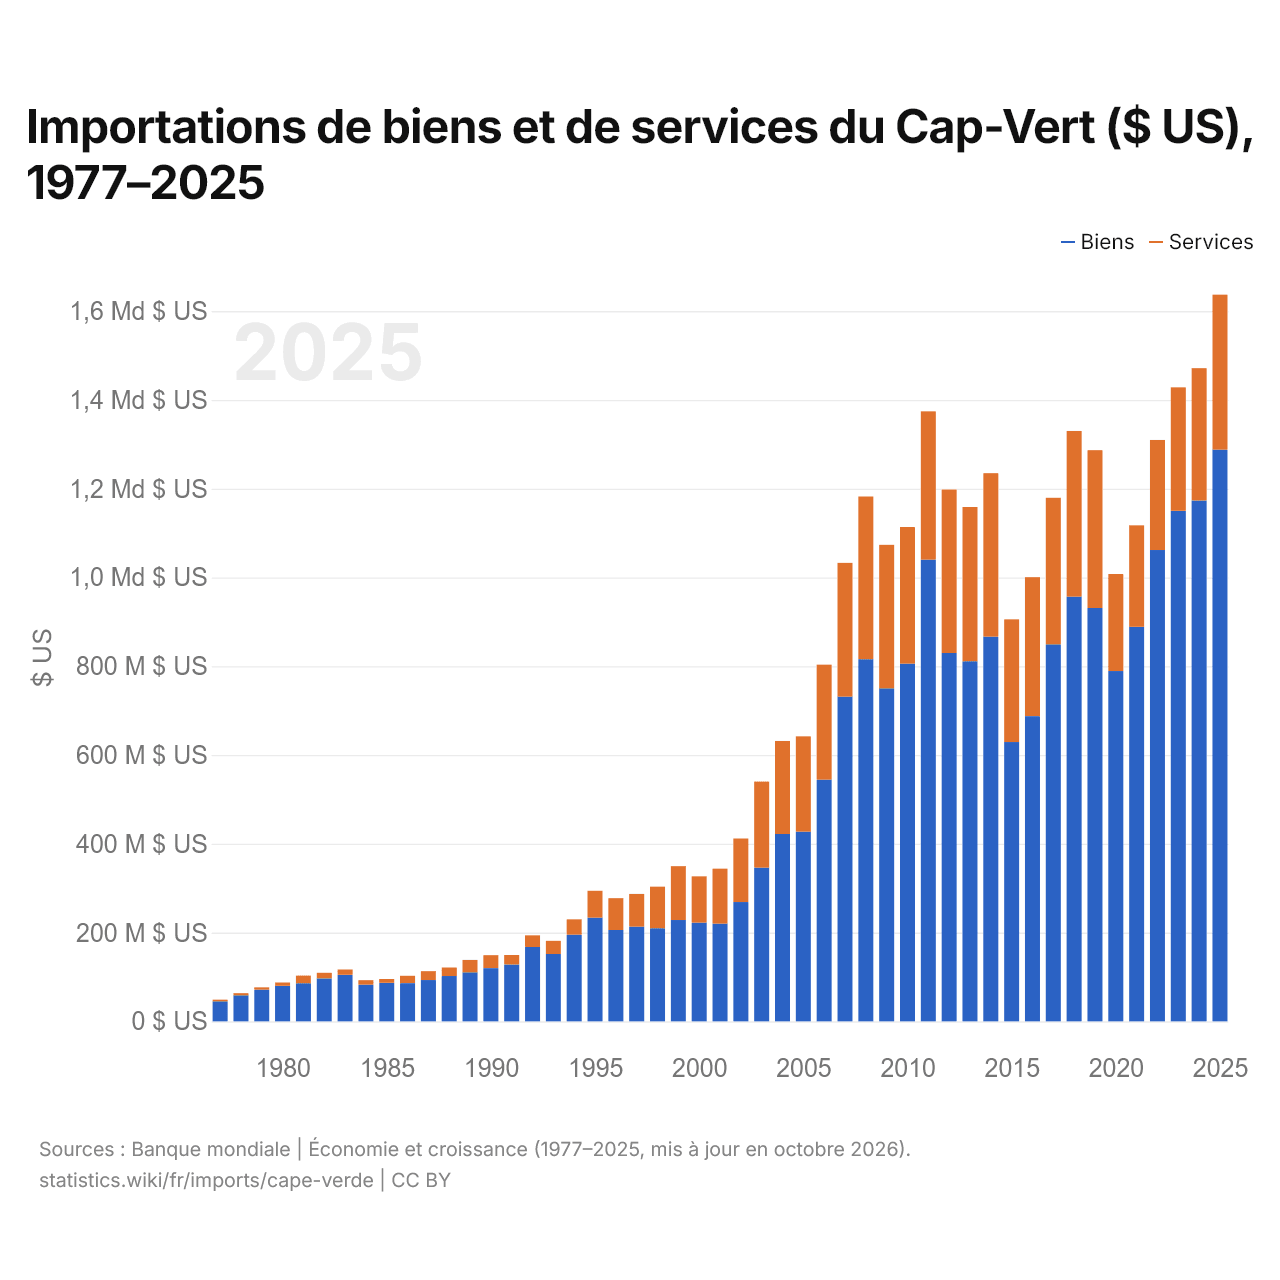
Importations de biens et de services du Cap-Vert ($ US), 1977–2025
| Année | $ US | |
|---|---|---|
| Biens | Services | |
| 2025 | 1 287 773 522 $ US | 349 296 695 $ US |
| 2024 | 1 173 415 469 $ US | 297 890 401 $ US |
| 2023 | 1 150 126 618 $ US | 278 311 807 $ US |
| 2022 | 1 061 785 041 $ US | 247 992 301 $ US |
| 2021 | 888 853 073 $ US | 228 606 704 $ US |
| 2020 | 789 113 320 $ US | 218 534 974 $ US |
| 2019 | 931 220 571 $ US | 355 434 687 $ US |
| 2018 | 956 957 922 $ US | 373 053 389 $ US |
| 2017 | 849 341 581 $ US | 330 238 295 $ US |
| 2016 | 687 435 655 $ US | 313 045 501 $ US |
| 2015 | 629 178 643 $ US | 276 447 821 $ US |
| 2014 | 866 701 991 $ US | 368 250 812 $ US |
| 2013 | 811 291 226 $ US | 347 296 342 $ US |
| 2012 | 829 856 042 $ US | 368 297 292 $ US |
| 2011 | 1 040 267 089 $ US | 333 881 952 $ US |
| 2010 | 805 639 464 $ US | 307 853 355 $ US |
| 2009 | 750 301 672 $ US | 323 146 907 $ US |
| 2008 | 815 843 296 $ US | 366 454 400 $ US |
| 2007 | 731 479 395 $ US | 301 380 020 $ US |
| 2006 | 544 594 364 $ US | 258 984 441 $ US |
| 2005 | 427 276 653 $ US | 214 671 150 $ US |
| 2004 | 422 093 841 $ US | 209 514 942 $ US |
| 2003 | 346 517 050 $ US | 193 570 126 $ US |
| 2002 | 268 741 629 $ US | 143 183 593 $ US |
| 2001 | 220 206 018 $ US | 123 659 995 $ US |
| 2000 | 222 345 362 $ US | 104 320 935 $ US |
| 1999 | 228 240 434 $ US | 121 395 894 $ US |
| 1998 | 209 790 571 $ US | 93 529 602 $ US |
| 1997 | 213 608 092 $ US | 73 398 097 $ US |
| 1996 | 205 755 034 $ US | 71 793 131 $ US |
| 1995 | 233 614 591 $ US | 60 518 000 $ US |
| 1994 | 195 157 618 $ US | 34 630 372 $ US |
| 1993 | 151 727 419 $ US | 29 618 809 $ US |
| 1992 | 167 636 065 $ US | 26 206 753 $ US |
| 1991 | 128 069 226 $ US | 21 287 852 $ US |
| 1990 | 119 829 362 $ US | 29 117 823 $ US |
| 1989 | 110 524 645 $ US | 27 807 942 $ US |
| 1988 | 102 045 444 $ US | 19 126 930 $ US |
| 1987 | 92 980 370 $ US | 20 171 989 $ US |
| 1986 | 85 934 334 $ US | 16 775 861 $ US |
| 1985 | 86 735 299 $ US | 8 598 556 $ US |
| 1984 | 82 466 680 $ US | 10 452 660 $ US |
| 1983 | 104 588 308 $ US | 12 203 248 $ US |
| 1982 | 96 709 172 $ US | 12 618 939 $ US |
| 1981 | 85 902 631 $ US | 17 168 205 $ US |
| 1980 | 79 965 318 $ US | 7 469 835 $ US |
| 1979 | 71 247 295 $ US | 5 479 123 $ US |
| 1978 | 58 748 055 $ US | 4 619 621 $ US |
| 1977 | 45 079 535 $ US | 3 656 764 $ US |
En 2025, les importations de biens du Cap-Vert s'élevaient à 1,29 milliard de dollars et celles de services à 349 millions de dollars ; les services représentaient 21,3 % du total, contre 7,5 % en 1977.
Le Cap-Vert dans le classement mondial des importations, 2025
| Rang | Pays | Importations | Part mondiale | |
|---|---|---|---|---|
| 153 |
 Seychelles |
2,21 Md $US | 0,007 % | |
| 154 |
 Sierra Leone |
2,11 Md $US | 0,006 % | |
| 155 |
 Belize |
1,73 Md $US | 0,005 % | |
| 156 |
 Cap-Vert |
1,63 Md $US | 0,005 % | |
| 157 |
 Bhoutan |
1,60 Md $US (2024) | 0,005 % | |
| 158 |
 Timor oriental |
1,58 Md $US (2024) | 0,005 % | |
| 159 |
 Gambie |
1,28 Md $US | 0,004 % |
Importations de biens et services du Cap-Vert, % du PIB, 1980–2025
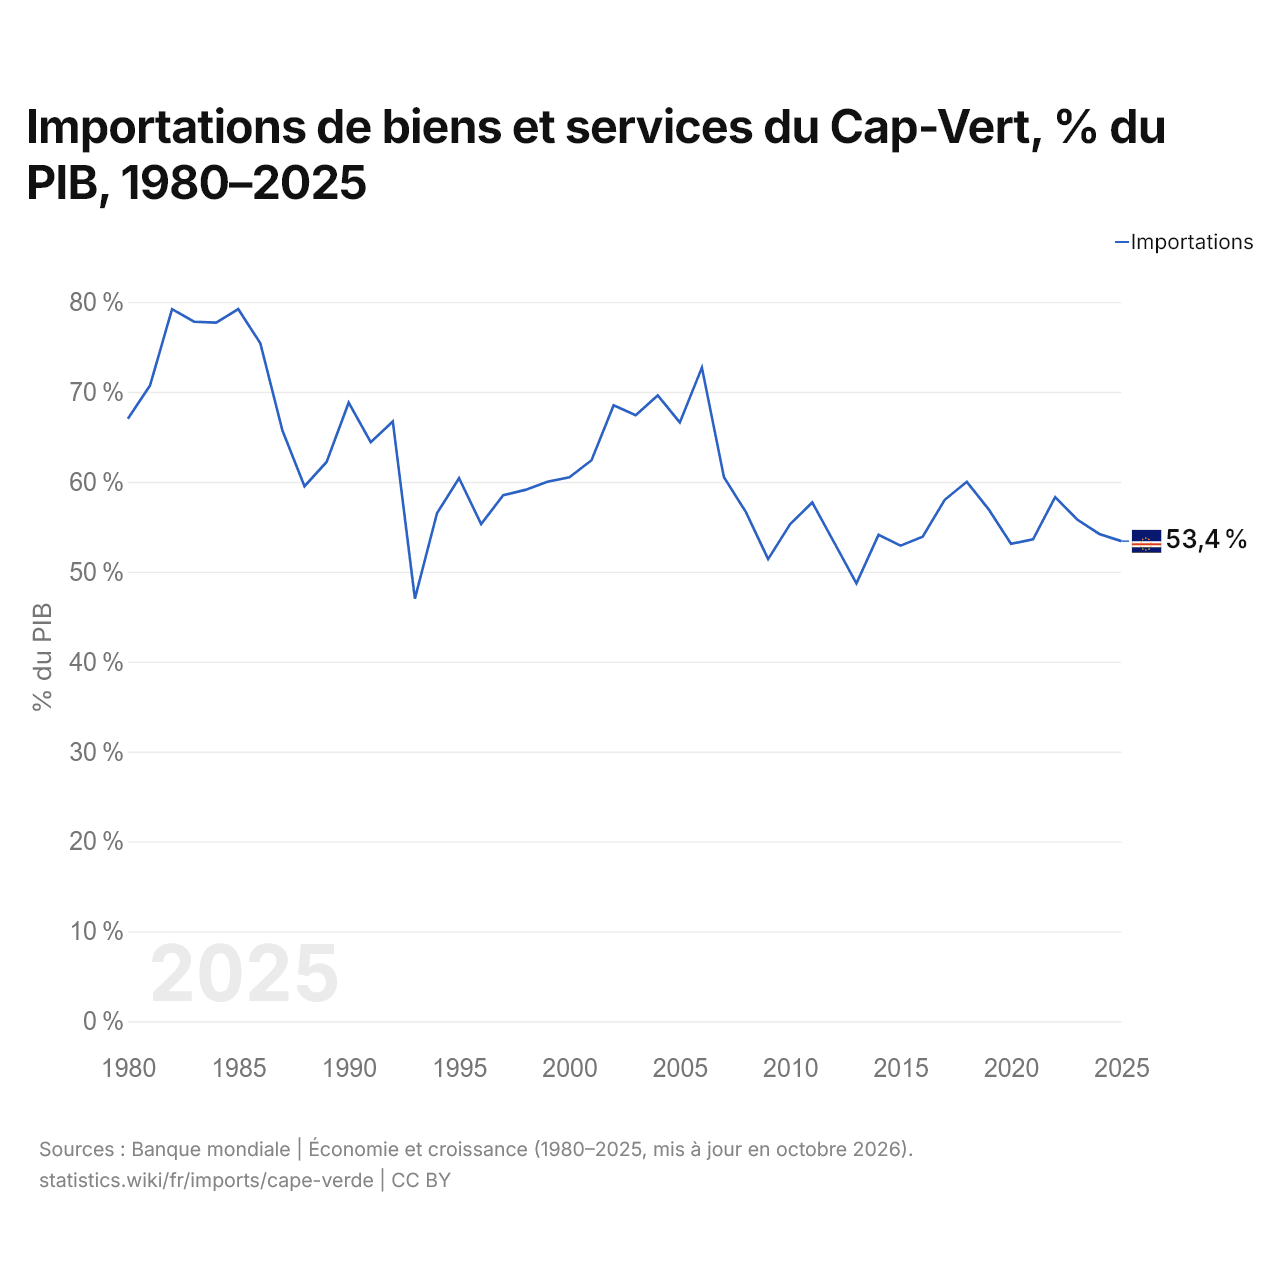
En 2025, les importations de biens et services du Cap-Vert équivalaient à 53,4 % de son PIB, contre 67,0 % en 1980. La part la plus élevée a été de 79,2 %, en 1982.
Comparer les importations du Cap-Vert avec celles d'autres pays
Sources :
- Banque mondiale | Économie et croissance (1977–2025, mis à jour en octobre 2026)
- TradeMap (2001–2025, mis à jour en octobre 2026)
Creative Commons Attribution (CC BY) : vous pouvez copier, partager, adapter et réutiliser ce contenu, y compris à des fins commerciales, à condition de citer statistics.wiki et d’indiquer les modifications apportées. Les sources citées ci-dessus peuvent avoir leurs propres conditions de licence.