
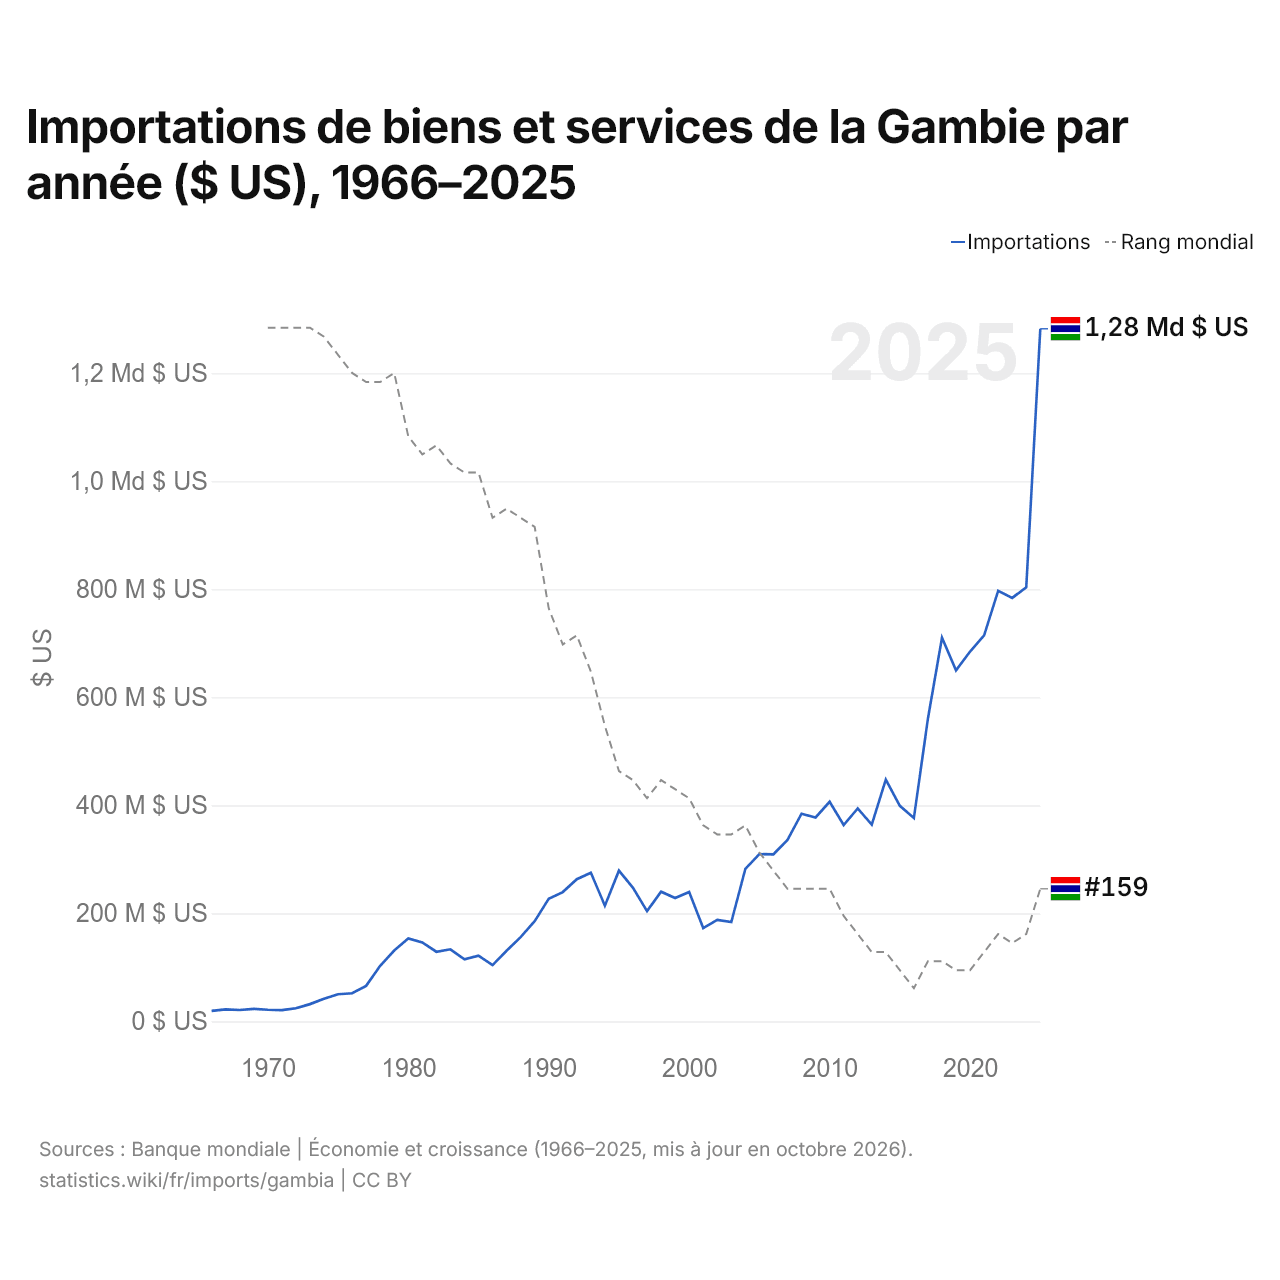
Importations de biens et services de la Gambie par année ($ US), 1966–2025
| Année | $ US | Rang mondial |
|---|---|---|
| Importations | Rang mondial | |
| 2025 | 1 282 337 369 $ US | #159 |
| 2024 | 803 756 501 $ US | #164 |
| 2023 | 783 973 746 $ US | #165 |
| 2022 | 797 057 190 $ US | #164 |
| 2021 | 714 636 610 $ US | #166 |
| 2020 | 684 780 894 $ US | #168 |
| 2019 | 649 852 995 $ US | #168 |
| 2018 | 710 441 024 $ US | #167 |
| 2017 | 560 621 586 $ US | #167 |
| 2016 | 376 466 241 $ US | #170 |
| 2015 | 399 003 139 $ US | #168 |
| 2014 | 447 782 688 $ US | #166 |
| 2013 | 364 299 281 $ US | #166 |
| 2012 | 394 206 041 $ US | #164 |
| 2011 | 363 423 204 $ US | #162 |
| 2010 | 406 576 421 $ US | #159 |
| 2009 | 377 490 757 $ US | #159 |
| 2008 | 384 411 745 $ US | #159 |
| 2007 | 336 061 371 $ US | #159 |
| 2006 | 309 274 034 $ US | #157 |
| 2005 | 309 496 623 $ US | #155 |
| 2004 | 282 217 002 $ US | #152 |
| 2003 | 183 930 191 $ US | #153 |
| 2002 | 187 843 015 $ US | #153 |
| 2001 | 172 598 262 $ US | #152 |
| 2000 | 239 267 448 $ US | #149 |
| 1999 | 228 252 567 $ US | #148 |
| 1998 | 240 030 743 $ US | #147 |
| 1997 | 204 004 699 $ US | #149 |
| 1996 | 247 310 341 $ US | #147 |
| 1995 | 279 038 983 $ US | #146 |
| 1994 | 214 068 047 $ US | #141 |
| 1993 | 275 121 124 $ US | #135 |
| 1992 | 263 205 386 $ US | #131 |
| 1991 | 239 289 621 $ US | #132 |
| 1990 | 226 977 004 $ US | #128 |
| 1989 | 185 466 421 $ US | #119 |
| 1988 | 155 878 662 $ US | #118 |
| 1987 | 130 802 612 $ US | #117 |
| 1986 | 104 144 840 $ US | #118 |
| 1985 | 121 704 015 $ US | #113 |
| 1984 | 114 897 722 $ US | #113 |
| 1983 | 133 367 481 $ US | #112 |
| 1982 | 128 848 575 $ US | #110 |
| 1981 | 146 042 851 $ US | #111 |
| 1980 | 153 325 164 $ US | #109 |
| 1979 | 131 009 534 $ US | #102 |
| 1978 | 102 907 354 $ US | #103 |
| 1977 | 65 617 860 $ US | #103 |
| 1976 | 52 005 933 $ US | #102 |
| 1975 | 50 235 171 $ US | #100 |
| 1974 | 41 877 707 $ US | #98 |
| 1973 | 31 865 390 $ US | #97 |
| 1972 | 24 111 330 $ US | #97 |
| 1971 | 20 720 647 $ US | #97 |
| 1970 | 21 393 730 $ US | #97 |
| 1969 | 23 077 141 $ US | - |
| 1968 | 20 988 898 $ US | - |
| 1967 | 22 035 303 $ US | - |
| 1966 | 19 266 443 $ US | - |
En 2025, les importations de biens et services de la Gambie s'élevaient à 1,28 milliard de dollars, contre 19,3 millions de dollars en 1966. Elles se classaient au 159e rang mondial, en hausse par rapport au 164e rang en 2024. Leur meilleur rang a été le 97e, occupé pour la dernière fois en 1973.
En 2025, les importations de biens et services de la Gambie étaient les 44es plus élevées de 50 pays situés en Afrique. En 2025, les importations de la Gambie dépassaient ses exportations de 952 millions de dollars, soit un déficit commercial. Le commerce de la Gambie, exportations et importations réunies, équivalait à 62,2 % de son PIB en 2025, au 117e rang mondial.
Importations de biens de la Gambie par catégorie
Importations de biens, 2024: 988 M $US
La première catégorie des importations de biens de la Gambie est « pétrole, gaz, minerais et autres matières premières », avec 41,2 %, suivie de « machines, électronique et véhicules », avec 19,2 %.
Origines des importations de biens de la Gambie : les 10 premières
| Rang | Pays | Importations de biens | Part | |
|---|---|---|---|---|
| 1 |
 Sénégal |
209 M $US | 21,2 % | vs Sénégal |
| 2 |
 Chine |
86,0 M $US | 8,7 % | |
| 3 |
 Russie |
50,9 M $US | 5,15 % | |
| 4 |
 Inde |
49,8 M $US | 5,04 % | |
| 5 |
 Liberia |
40,5 M $US | 4,09 % | |
| 6 |
 Belgique |
39,7 M $US | 4,02 % | |
| 7 |
 Brésil |
39,2 M $US | 3,97 % | |
| 8 |
 Égypte |
39,0 M $US | 3,94 % | |
| 9 |
 Nigeria |
38,0 M $US | 3,85 % | |
| 10 |
 Espagne |
35,0 M $US | 3,54 % | |
| Autres partenaires et non précisés | 361 M $US | 36,5 % |
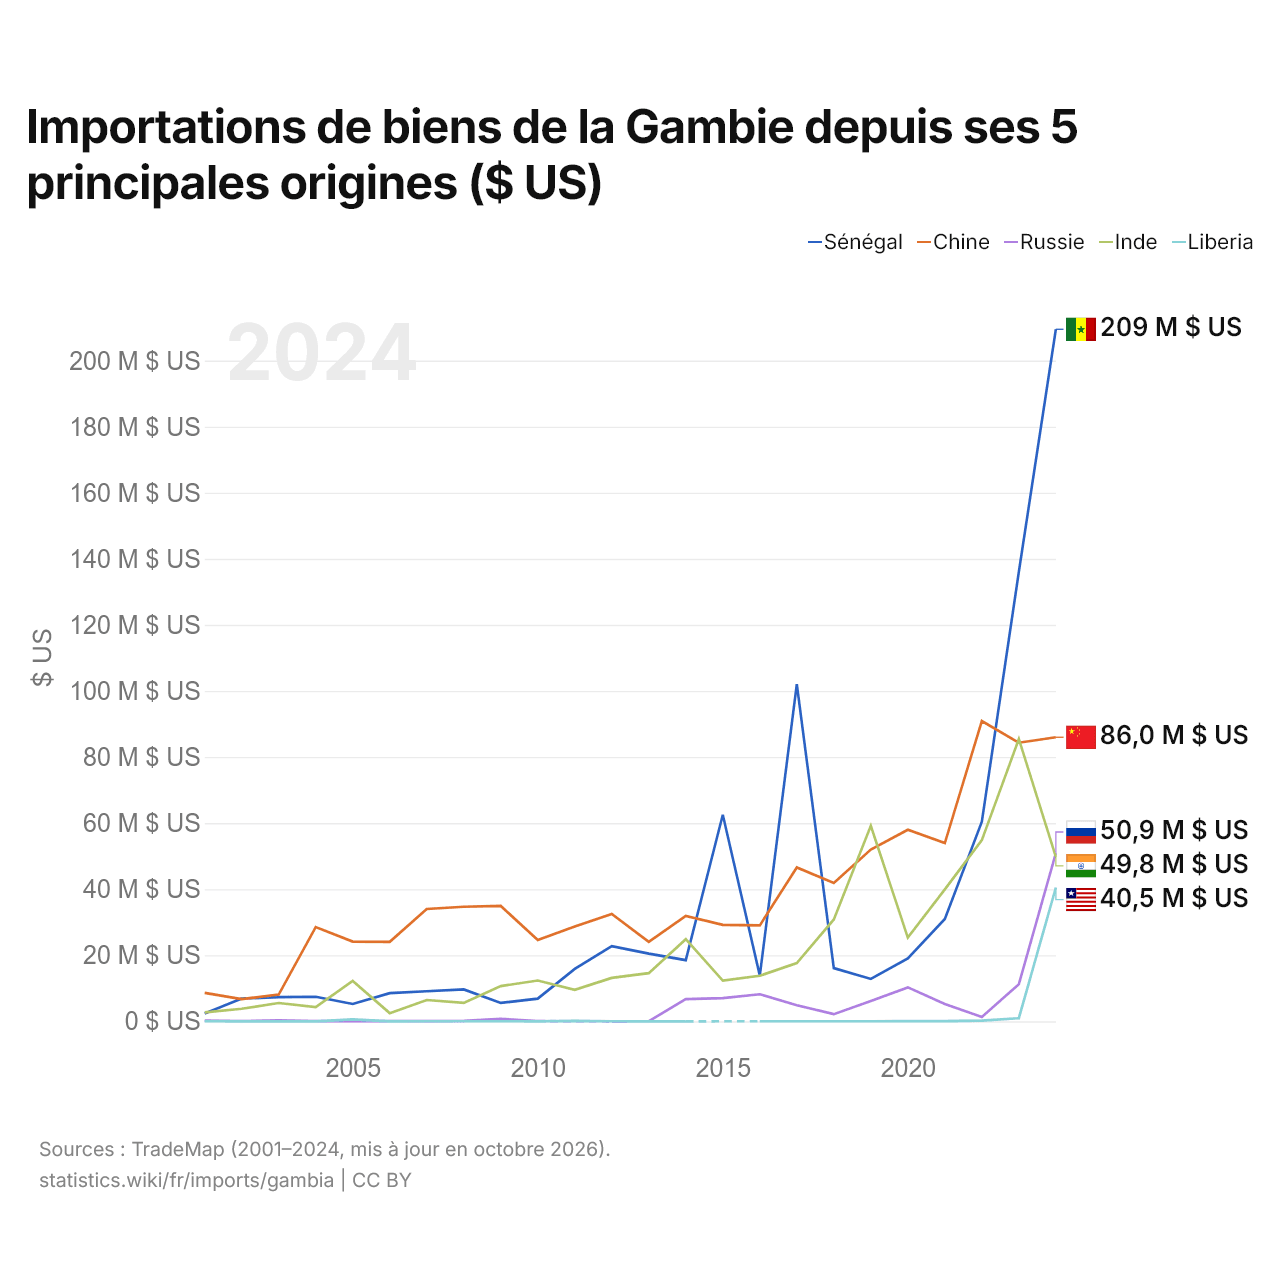
Importations de biens de la Gambie depuis ses 5 principales origines ($ US)
| Année | $ US | ||||
|---|---|---|---|---|---|
| Sénégal | Chine | Russie | Inde | Liberia | |
| 2024 | 209 471 000 $ US | 85 995 000 $ US | 50 949 000 $ US | 49 803 000 $ US | 40 473 000 $ US |
| 2023 | 136 078 000 $ US | 84 329 000 $ US | 11 229 000 $ US | 85 452 000 $ US | 940 000 $ US |
| 2022 | 60 414 000 $ US | 90 897 000 $ US | 1 335 000 $ US | 54 827 000 $ US | 224 000 $ US |
| 2021 | 31 005 000 $ US | 53 963 000 $ US | 5 257 000 $ US | 39 918 000 $ US | 66 000 $ US |
| 2020 | 19 052 000 $ US | 57 973 000 $ US | 10 277 000 $ US | 25 347 000 $ US | 52 000 $ US |
| 2019 | 12 835 000 $ US | 51 996 000 $ US | 6 122 000 $ US | 59 201 000 $ US | 19 000 $ US |
| 2018 | 16 107 000 $ US | 41 893 000 $ US | 2 171 000 $ US | 30 846 000 $ US | 31 000 $ US |
| 2017 | 102 070 000 $ US | 46 578 000 $ US | 4 879 000 $ US | 17 632 000 $ US | 18 000 $ US |
| 2016 | 13 827 000 $ US | 29 042 000 $ US | 8 203 000 $ US | 13 791 000 $ US | 34 000 $ US |
| 2015 | 62 528 000 $ US | 29 211 000 $ US | 7 003 000 $ US | 12 306 000 $ US | - |
| 2014 | 18 529 000 $ US | 31 912 000 $ US | 6 740 000 $ US | 24 862 000 $ US | 1 000 $ US |
| 2013 | 20 502 000 $ US | 24 047 000 $ US | 23 000 $ US | 14 571 000 $ US | 12 000 $ US |
| 2012 | 22 742 000 $ US | 32 507 000 $ US | 9 000 $ US | 13 153 000 $ US | 13 000 $ US |
| 2011 | 15 871 000 $ US | 28 691 000 $ US | - | 9 545 000 $ US | 147 000 $ US |
| 2010 | 6 869 000 $ US | 24 604 000 $ US | 44 000 $ US | 12 353 000 $ US | 6 000 $ US |
| 2009 | 5 568 000 $ US | 34 929 000 $ US | 779 000 $ US | 10 671 000 $ US | 22 000 $ US |
| 2008 | 9 674 000 $ US | 34 693 000 $ US | 137 000 $ US | 5 563 000 $ US | 21 000 $ US |
| 2007 | 9 106 000 $ US | 34 008 000 $ US | 72 000 $ US | 6 452 000 $ US | 31 000 $ US |
| 2006 | 8 544 000 $ US | 24 058 000 $ US | 67 000 $ US | 2 480 000 $ US | 6 000 $ US |
| 2005 | 5 260 000 $ US | 24 132 000 $ US | 88 000 $ US | 12 232 000 $ US | 576 000 $ US |
| 2004 | 7 432 000 $ US | 28 530 000 $ US | 40 000 $ US | 4 299 000 $ US | 3 000 $ US |
| 2003 | 7 320 000 $ US | 8 091 000 $ US | 326 000 $ US | 5 538 000 $ US | 12 000 $ US |
| 2002 | 6 896 000 $ US | 6 721 000 $ US | 97 000 $ US | 3 806 000 $ US | 12 000 $ US |
| 2001 | 2 373 000 $ US | 8 633 000 $ US | 258 000 $ US | 2 689 000 $ US | 19 000 $ US |
Les importations de biens s'élèvent à 209 millions de dollars en provenance du Sénégal (2024), 86 millions de dollars en provenance de la Chine (2024), 50,9 millions de dollars en provenance de la Russie (2024), 49,8 millions de dollars en provenance de l'Inde (2024) et 40,5 millions de dollars en provenance du Liberia (2024). Le premier rang des cinq fournisseurs de la Gambie est occupé par le Sénégal depuis 2023. Le changement le plus récent dans leur ordre remonte à 2024, quand les importations de la Gambie en provenance de la Russie ont dépassé celles en provenance de l'Inde.
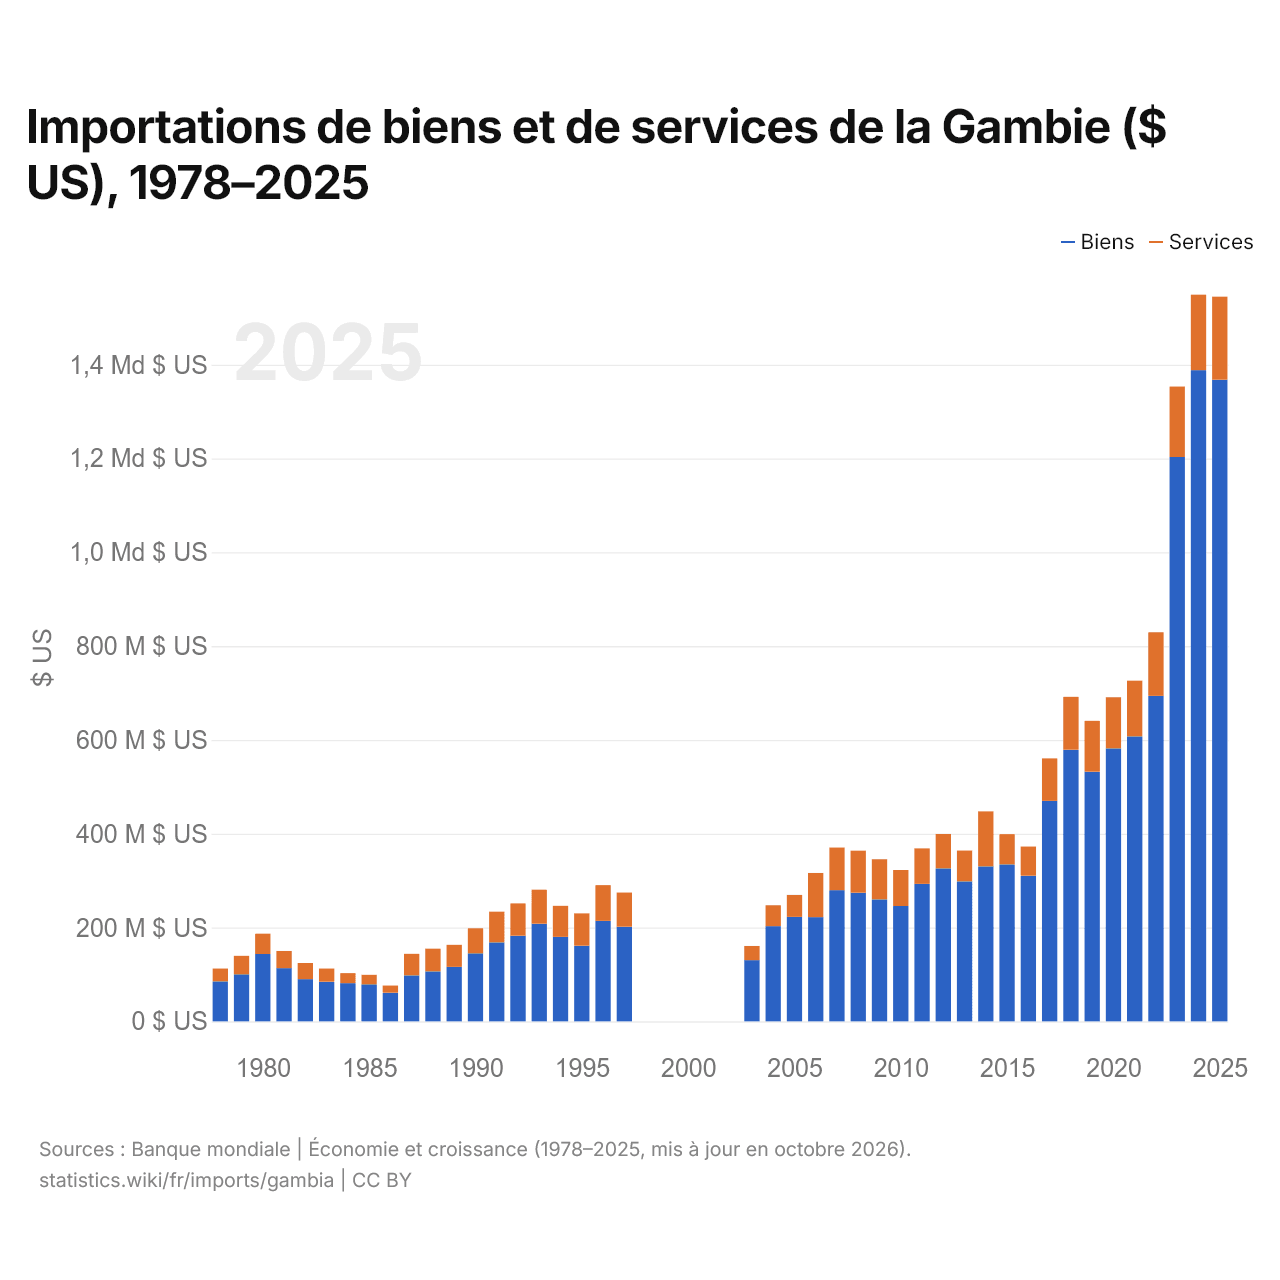
Importations de biens et de services de la Gambie ($ US), 1978–2025
| Année | $ US | |
|---|---|---|
| Biens | Services | |
| 2025 | 1 368 143 152 $ US | 176 880 083 $ US |
| 2024 | 1 388 324 740 $ US | 160 904 229 $ US |
| 2023 | 1 203 280 719 $ US | 150 189 735 $ US |
| 2022 | 693 994 580 $ US | 135 521 836 $ US |
| 2021 | 607 359 368 $ US | 118 870 379 $ US |
| 2020 | 581 815 543 $ US | 109 163 931 $ US |
| 2019 | 532 470 804 $ US | 108 077 506 $ US |
| 2018 | 579 056 167 $ US | 112 664 909 $ US |
| 2017 | 469 970 465 $ US | 90 674 148 $ US |
| 2016 | 310 504 707 $ US | 62 115 785 $ US |
| 2015 | 334 386 544 $ US | 64 620 158 $ US |
| 2014 | 330 419 020 $ US | 117 303 708 $ US |
| 2013 | 298 288 538 $ US | 65 909 981 $ US |
| 2012 | 325 935 525 $ US | 73 528 349 $ US |
| 2011 | 292 985 196 $ US | 75 820 659 $ US |
| 2010 | 245 762 741 $ US | 76 855 516 $ US |
| 2009 | 259 958 865 $ US | 85 689 837 $ US |
| 2008 | 274 213 163 $ US | 89 664 492 $ US |
| 2007 | 279 566 039 $ US | 90 978 163 $ US |
| 2006 | 222 215 138 $ US | 94 075 640 $ US |
| 2005 | 222 607 885 $ US | 46 882 402 $ US |
| 2004 | 202 769 690 $ US | 44 732 469 $ US |
| 2003 | 130 456 325 $ US | 30 250 318 $ US |
| 2002 | - | - |
| 2001 | - | - |
| 2000 | - | - |
| 1999 | - | - |
| 1998 | - | - |
| 1997 | 201 741 802 $ US | 72 737 047 $ US |
| 1996 | 214 276 088 $ US | 76 030 092 $ US |
| 1995 | 161 416 309 $ US | 68 773 238 $ US |
| 1994 | 179 945 858 $ US | 66 421 959 $ US |
| 1993 | 208 175 628 $ US | 72 376 524 $ US |
| 1992 | 182 559 807 $ US | 68 738 714 $ US |
| 1991 | 168 217 830 $ US | 65 675 112 $ US |
| 1990 | 145 005 855 $ US | 53 487 805 $ US |
| 1989 | 116 264 305 $ US | 46 934 279 $ US |
| 1988 | 106 563 044 $ US | 48 467 425 $ US |
| 1987 | 98 043 649 $ US | 45 765 011 $ US |
| 1986 | 60 912 890 $ US | 15 467 213 $ US |
| 1985 | 78 936 816 $ US | 20 352 483 $ US |
| 1984 | 81 424 463 $ US | 21 193 853 $ US |
| 1983 | 84 378 891 $ US | 28 147 773 $ US |
| 1982 | 89 862 016 $ US | 34 422 210 $ US |
| 1981 | 113 407 385 $ US | 36 650 132 $ US |
| 1980 | 143 464 533 $ US | 43 306 649 $ US |
| 1979 | 100 274 526 $ US | 39 445 762 $ US |
| 1978 | 85 115 858 $ US | 27 476 989 $ US |
En 2025, les importations de biens de la Gambie s'élevaient à 1,37 milliard de dollars et celles de services à 177 millions de dollars ; les services représentaient 11,4 % du total, contre 24,4 % en 1978.
La Gambie dans le classement mondial des importations, 2025
| Rang | Pays | Importations | Part mondiale | |
|---|---|---|---|---|
| 156 |
 Cap-Vert |
1,63 Md $US | 0,005 % | |
| 157 |
 Bhoutan |
1,60 Md $US (2024) | 0,005 % | |
| 158 |
 Timor oriental |
1,58 Md $US (2024) | 0,005 % | |
| 159 |
 Gambie |
1,28 Md $US | 0,004 % | |
| 160 |
 Antigua-et-Barbuda |
1,18 Md $US (2022) | 0,004 % | |
| 161 |
 Îles Salomon |
1,12 Md $US (2024) | 0,004 % | |
| 162 |
 RCA |
1,03 Md $US | 0,003 % |
Importations de biens et services de la Gambie, % du PIB, 1966–2025
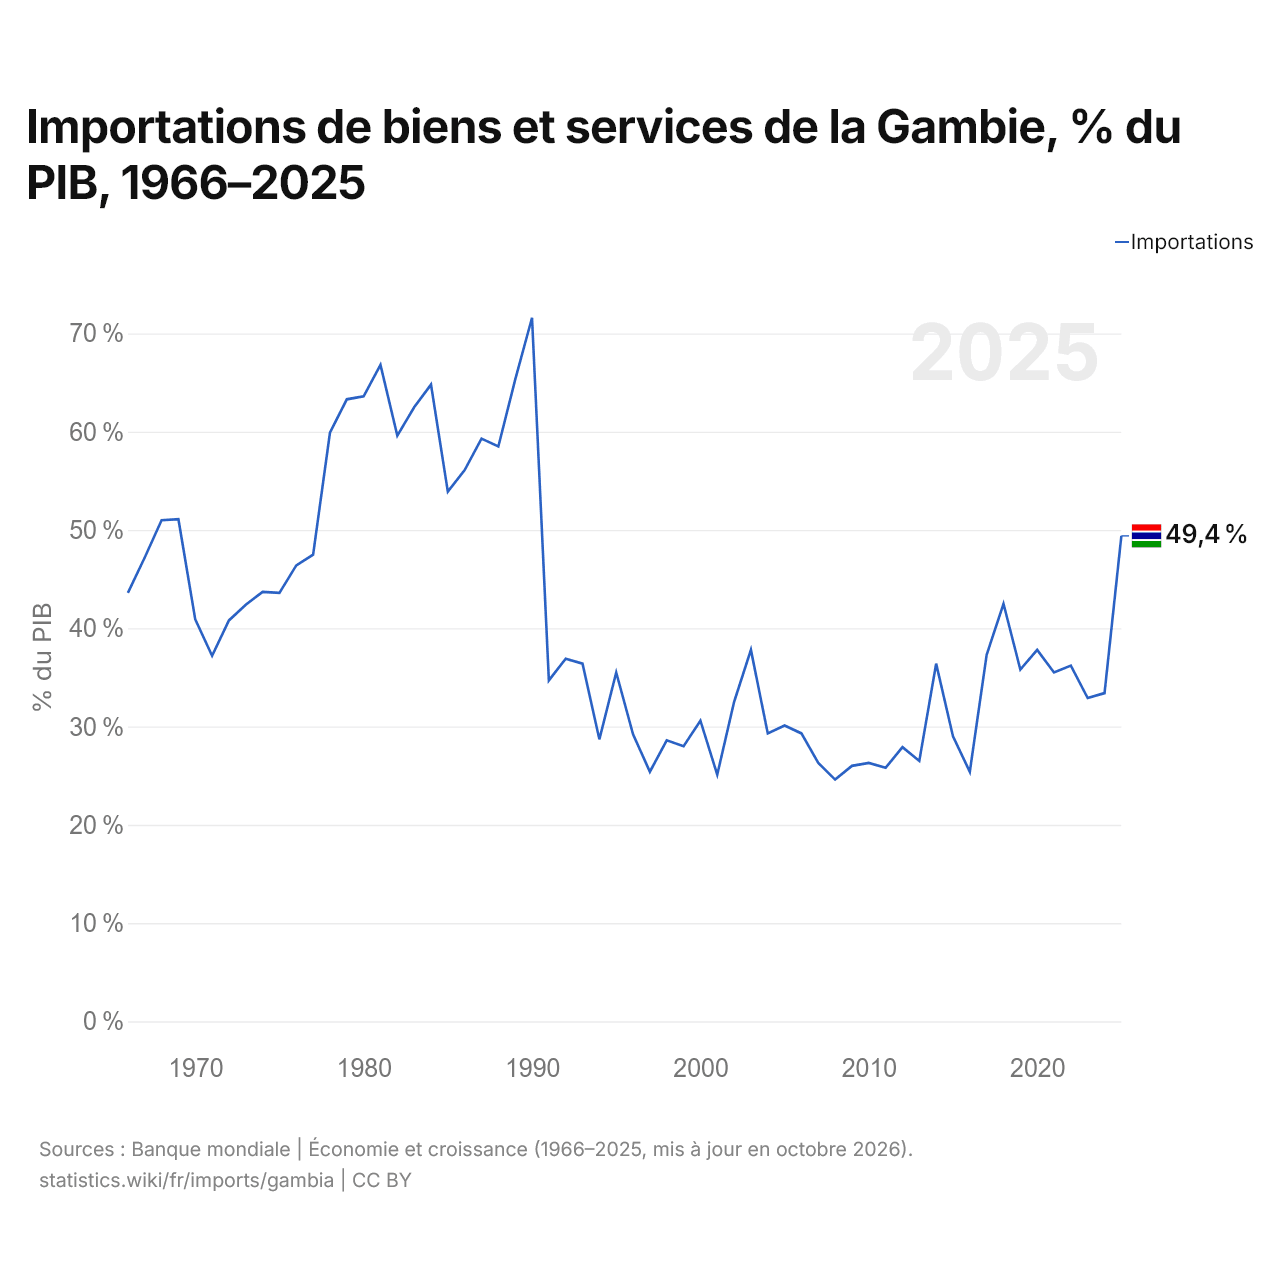
En 2025, les importations de biens et services de la Gambie équivalaient à 49,4 % de son PIB, contre 43,6 % en 1966. La part la plus élevée a été de 71,6 %, en 1990.
Comparer les importations de la Gambie avec celles d'autres pays
Sources :
- Banque mondiale | Économie et croissance (1966–2025, mis à jour en octobre 2026)
- TradeMap (2001–2024, mis à jour en octobre 2026)
Creative Commons Attribution (CC BY) : vous pouvez copier, partager, adapter et réutiliser ce contenu, y compris à des fins commerciales, à condition de citer statistics.wiki et d’indiquer les modifications apportées. Les sources citées ci-dessus peuvent avoir leurs propres conditions de licence.