
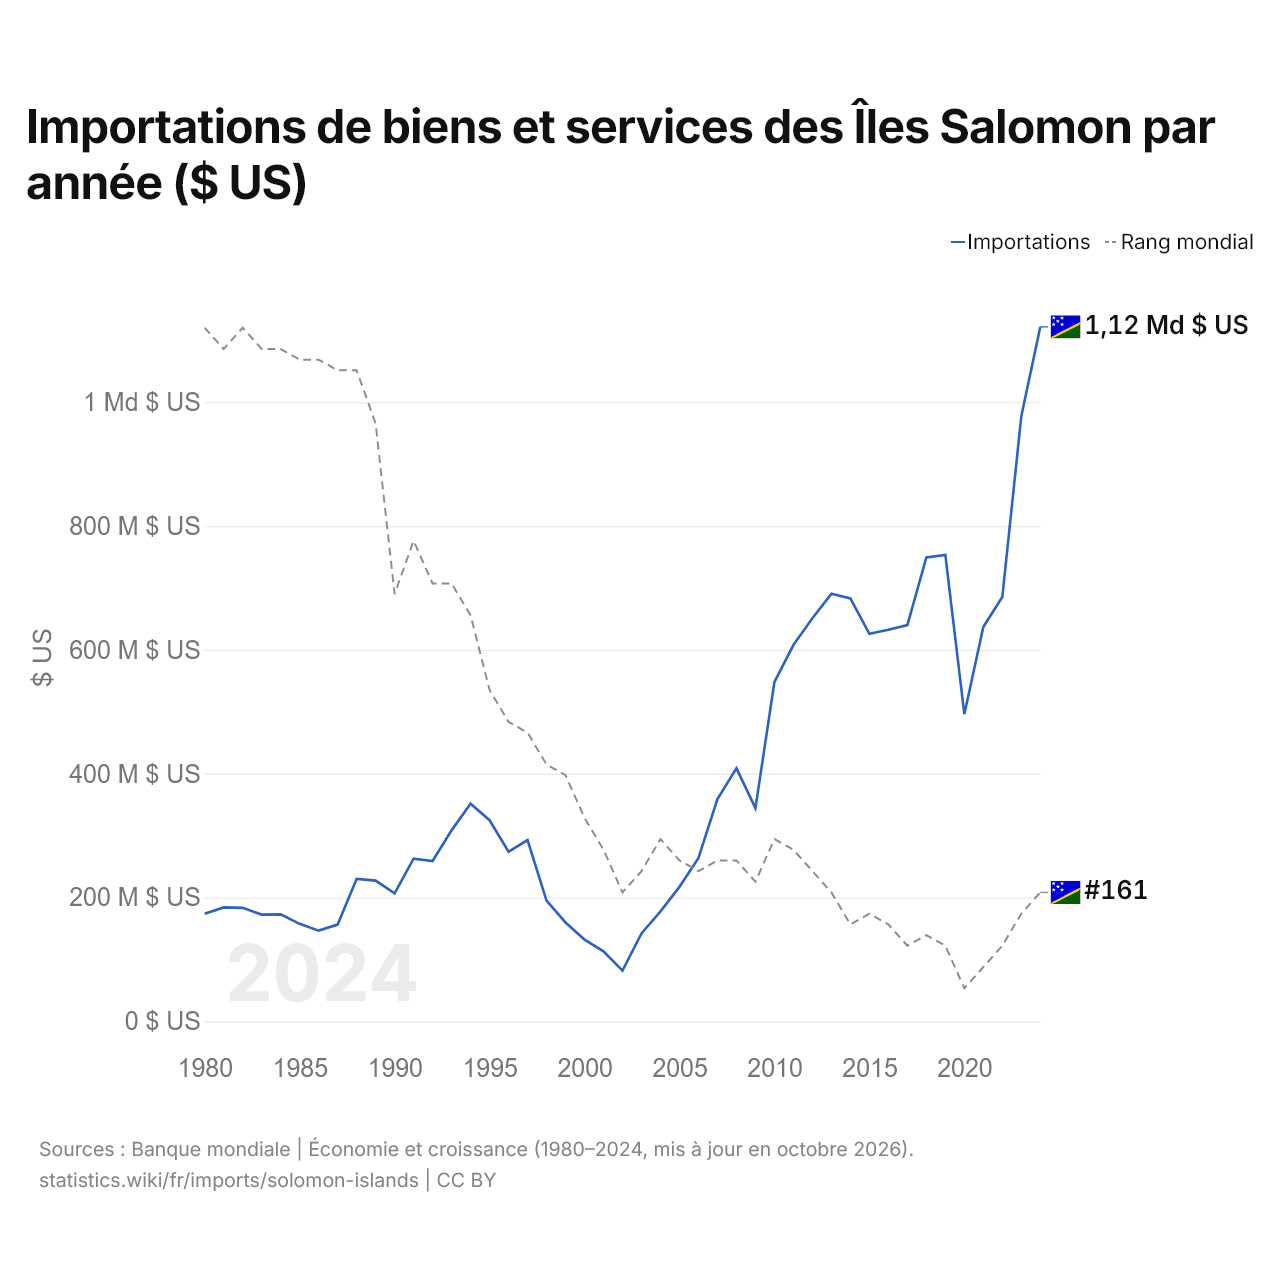
Importations de biens et services des Îles Salomon par année ($ US)
| Année | $ US | Rang mondial |
|---|---|---|
| Importations | Rang mondial | |
| 2024 | 1 121 200 955 $ US | #161 |
| 2023 | 977 101 704 $ US | #163 |
| 2022 | 684 987 596 $ US | #166 |
| 2021 | 636 797 050 $ US | #168 |
| 2020 | 495 896 249 $ US | #170 |
| 2019 | 752 930 329 $ US | #166 |
| 2018 | 749 072 148 $ US | #165 |
| 2017 | 639 628 572 $ US | #166 |
| 2016 | 632 096 539 $ US | #164 |
| 2015 | 625 545 742 $ US | #163 |
| 2014 | 682 707 806 $ US | #164 |
| 2013 | 690 209 096 $ US | #161 |
| 2012 | 650 831 799 $ US | #159 |
| 2011 | 607 440 593 $ US | #157 |
| 2010 | 547 833 028 $ US | #156 |
| 2009 | 344 202 960 $ US | #160 |
| 2008 | 408 521 335 $ US | #158 |
| 2007 | 358 767 250 $ US | #158 |
| 2006 | 263 730 373 $ US | #159 |
| 2005 | 217 130 329 $ US | #158 |
| 2004 | 177 518 082 $ US | #156 |
| 2003 | 141 834 991 $ US | #159 |
| 2002 | 81 792 658 $ US | #161 |
| 2001 | 112 921 882 $ US | #157 |
| 2000 | 132 051 309 $ US | #154 |
| 1999 | 159 565 387 $ US | #150 |
| 1998 | 194 989 294 $ US | #149 |
| 1997 | 292 713 742 $ US | #146 |
| 1996 | 273 948 942 $ US | #145 |
| 1995 | 324 730 615 $ US | #142 |
| 1994 | 351 222 808 $ US | #135 |
| 1993 | 308 369 616 $ US | #132 |
| 1992 | 258 870 940 $ US | #132 |
| 1991 | 262 639 285 $ US | #128 |
| 1990 | 206 423 406 $ US | #133 |
| 1989 | 227 189 281 $ US | #117 |
| 1988 | 230 010 127 $ US | #112 |
| 1987 | 156 242 824 $ US | #112 |
| 1986 | 146 425 495 $ US | #111 |
| 1985 | 157 350 886 $ US | #111 |
| 1984 | 172 723 097 $ US | #110 |
| 1983 | 172 390 075 $ US | #110 |
| 1982 | 183 296 537 $ US | #108 |
| 1981 | 183 872 962 $ US | #110 |
| 1980 | 173 530 145 $ US | #108 |
Les importations de biens et services des Îles Salomon s'élèvent à 1,12 milliard de dollars (2024), contre 174 millions de dollars en 1980. Le minimum a été de 81,8 millions de dollars, en 2002. Elles se classent au 161e rang mondial, en hausse par rapport au 163e rang l'année précédente. Leur meilleur rang a été le 108e, occupé pour la dernière fois en 1982.
Les importations de biens et services des Îles Salomon sont les 4es plus élevées de 11 pays situés en Océanie. Les importations des Îles Salomon dépassent leurs exportations de 479 millions de dollars, soit un déficit commercial (2024). Le commerce des Îles Salomon, exportations et importations réunies, équivaut à 111,4 % de leur PIB (2024), au 45e rang mondial.
Importations de biens des Îles Salomon par catégorie, 2025
Importations de biens, 2025: 711 M $US
En 2025, la première catégorie des importations de biens des Îles Salomon était « machines, électronique et véhicules », avec 27,0 %, suivie de « pétrole, gaz, minerais et autres matières premières », avec 23,7 %.
Origines des importations de biens des Îles Salomon : les 10 premières, 2025
| Rang | Pays | Importations de biens | Part | |
|---|---|---|---|---|
| 1 |
 Chine |
221 M $US | 31,1 % | |
| 2 |
 Singapour |
114 M $US | 16 % | |
| 3 |
 Australie |
93,8 M $US | 13,2 % | |
| 4 |
 Vietnam |
30,6 M $US | 4,3 % | |
| 5 |
 Japon |
30,1 M $US | 4,23 % | |
| 6 |
 Indonésie |
28,0 M $US | 3,93 % | |
| 7 |
 Thaïlande |
22,7 M $US | 3,18 % | |
| 8 |
 Papouasie |
22,6 M $US | 3,17 % | |
| 9 |
 Malaisie |
22,2 M $US | 3,12 % | |
| 10 |
 Nouvelle-Zélande |
19,9 M $US | 2,79 % | |
| Autres partenaires et non précisés | 107 M $US | 15 % |
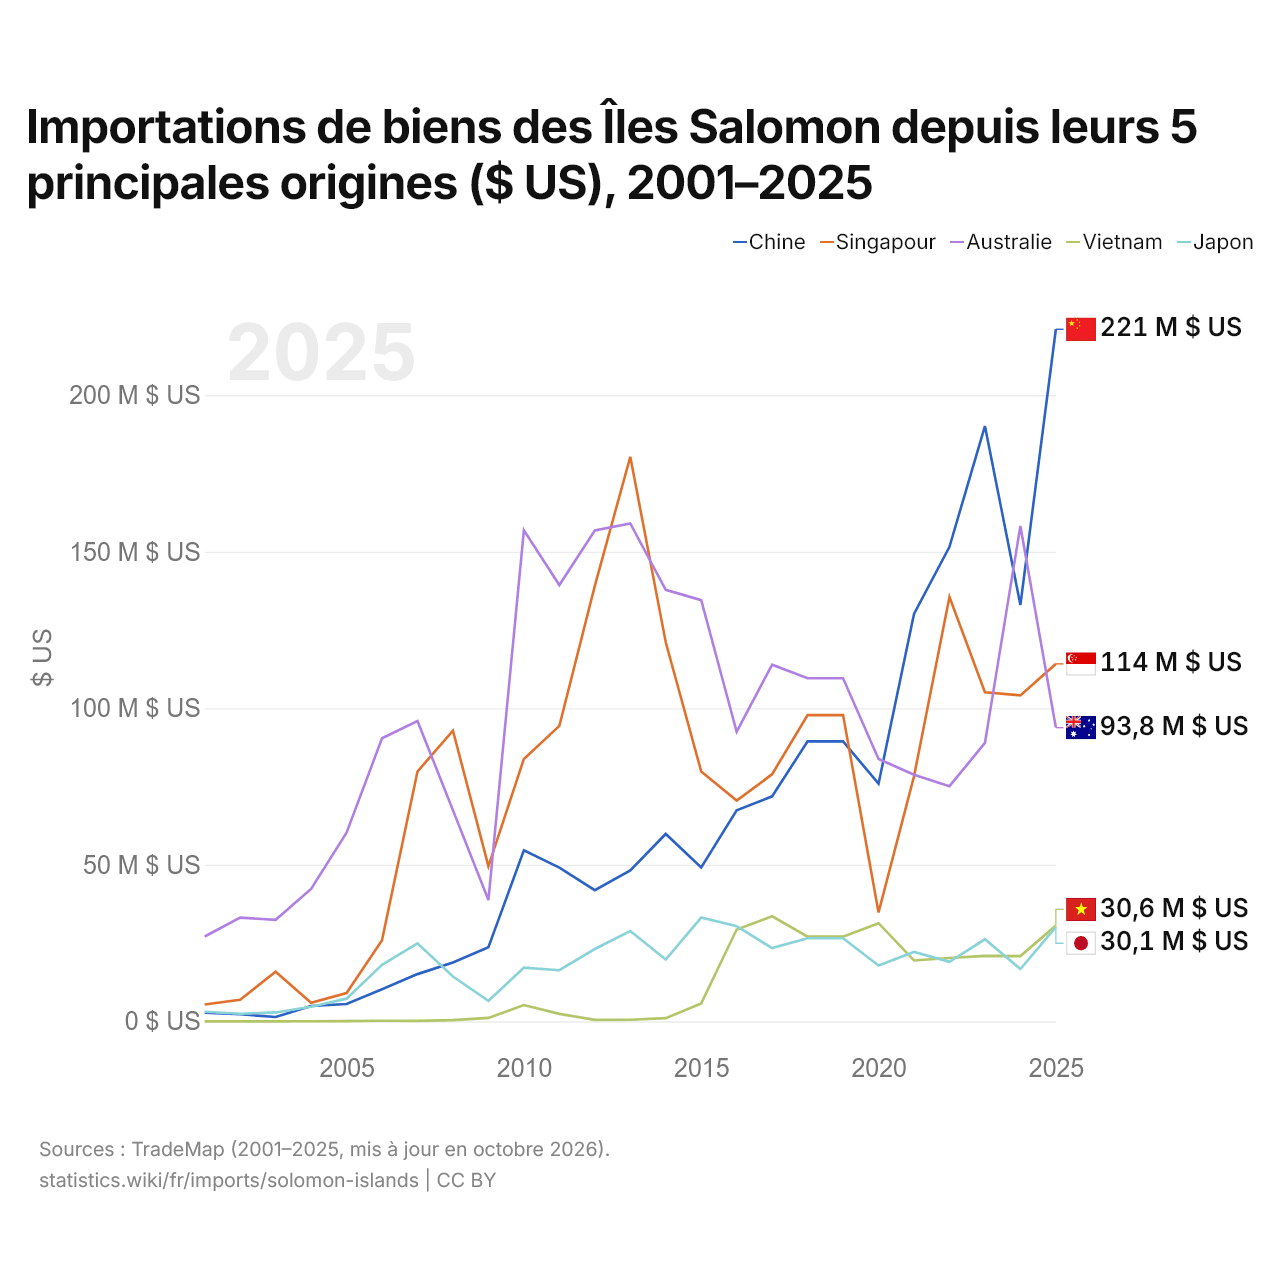
Importations de biens des Îles Salomon depuis leurs 5 principales origines ($ US), 2001–2025
| Année | $ US | ||||
|---|---|---|---|---|---|
| Chine | Singapour | Australie | Vietnam | Japon | |
| 2025 | 221 018 000 $ US | 114 154 000 $ US | 93 804 000 $ US | 30 563 000 $ US | 30 117 000 $ US |
| 2024 | 132 966 000 $ US | 104 081 000 $ US | 158 205 000 $ US | 20 842 000 $ US | 16 711 000 $ US |
| 2023 | 190 110 000 $ US | 105 109 000 $ US | 88 904 000 $ US | 20 897 000 $ US | 26 216 000 $ US |
| 2022 | 151 543 000 $ US | 135 499 000 $ US | 75 083 000 $ US | 20 222 000 $ US | 18 991 000 $ US |
| 2021 | 130 134 000 $ US | 78 238 000 $ US | 78 772 000 $ US | 19 442 000 $ US | 22 141 000 $ US |
| 2020 | 75 876 000 $ US | 34 780 000 $ US | 83 775 000 $ US | 31 347 000 $ US | 17 832 000 $ US |
| 2019 | 89 413 000 $ US | 97 817 000 $ US | 109 580 000 $ US | 27 031 000 $ US | 26 524 000 $ US |
| 2018 | 89 413 000 $ US | 97 817 000 $ US | 109 580 000 $ US | 27 031 000 $ US | 26 524 000 $ US |
| 2017 | 71 850 000 $ US | 78 922 000 $ US | 113 907 000 $ US | 33 539 000 $ US | 23 377 000 $ US |
| 2016 | 67 393 000 $ US | 70 486 000 $ US | 92 484 000 $ US | 29 326 000 $ US | 30 383 000 $ US |
| 2015 | 49 136 000 $ US | 79 799 000 $ US | 134 501 000 $ US | 5 708 000 $ US | 33 147 000 $ US |
| 2014 | 59 841 000 $ US | 121 061 000 $ US | 137 815 000 $ US | 1 017 000 $ US | 19 735 000 $ US |
| 2013 | 48 183 000 $ US | 180 294 000 $ US | 159 024 000 $ US | 508 000 $ US | 28 842 000 $ US |
| 2012 | 41 905 000 $ US | 139 090 000 $ US | 156 747 000 $ US | 456 000 $ US | 23 091 000 $ US |
| 2011 | 49 087 000 $ US | 94 358 000 $ US | 139 327 000 $ US | 2 400 000 $ US | 16 317 000 $ US |
| 2010 | 54 633 000 $ US | 83 808 000 $ US | 156 830 000 $ US | 5 211 000 $ US | 17 129 000 $ US |
| 2009 | 23 647 000 $ US | 49 555 000 $ US | 38 719 000 $ US | 1 082 000 $ US | 6 542 000 $ US |
| 2008 | 18 813 000 $ US | 92 819 000 $ US | 67 428 000 $ US | 401 000 $ US | 14 314 000 $ US |
| 2007 | 15 075 000 $ US | 79 779 000 $ US | 95 923 000 $ US | 162 000 $ US | 24 925 000 $ US |
| 2006 | 10 249 000 $ US | 25 925 000 $ US | 90 376 000 $ US | 180 000 $ US | 18 060 000 $ US |
| 2005 | 5 538 000 $ US | 9 036 000 $ US | 60 226 000 $ US | 74 000 $ US | 7 242 000 $ US |
| 2004 | 4 904 000 $ US | 5 908 000 $ US | 42 293 000 $ US | 27 000 $ US | 4 653 000 $ US |
| 2003 | 1 395 000 $ US | 15 852 000 $ US | 32 417 000 $ US | 7 000 $ US | 2 838 000 $ US |
| 2002 | 2 250 000 $ US | 6 899 000 $ US | 33 131 000 $ US | 6 000 $ US | 2 431 000 $ US |
| 2001 | 2 738 000 $ US | 5 370 000 $ US | 27 082 000 $ US | 2 000 $ US | 3 061 000 $ US |
En 2025, les importations de biens s'élevaient à 221 millions de dollars en provenance de la Chine, 114 millions de dollars en provenance de Singapour, 93,8 millions de dollars en provenance de l'Australie, 30,6 millions de dollars en provenance du Vietnam et 30,1 millions de dollars en provenance du Japon. Le changement le plus récent dans leur ordre remonte à 2025, quand les importations des Îles Salomon en provenance de Singapour ont dépassé celles en provenance de l'Australie.
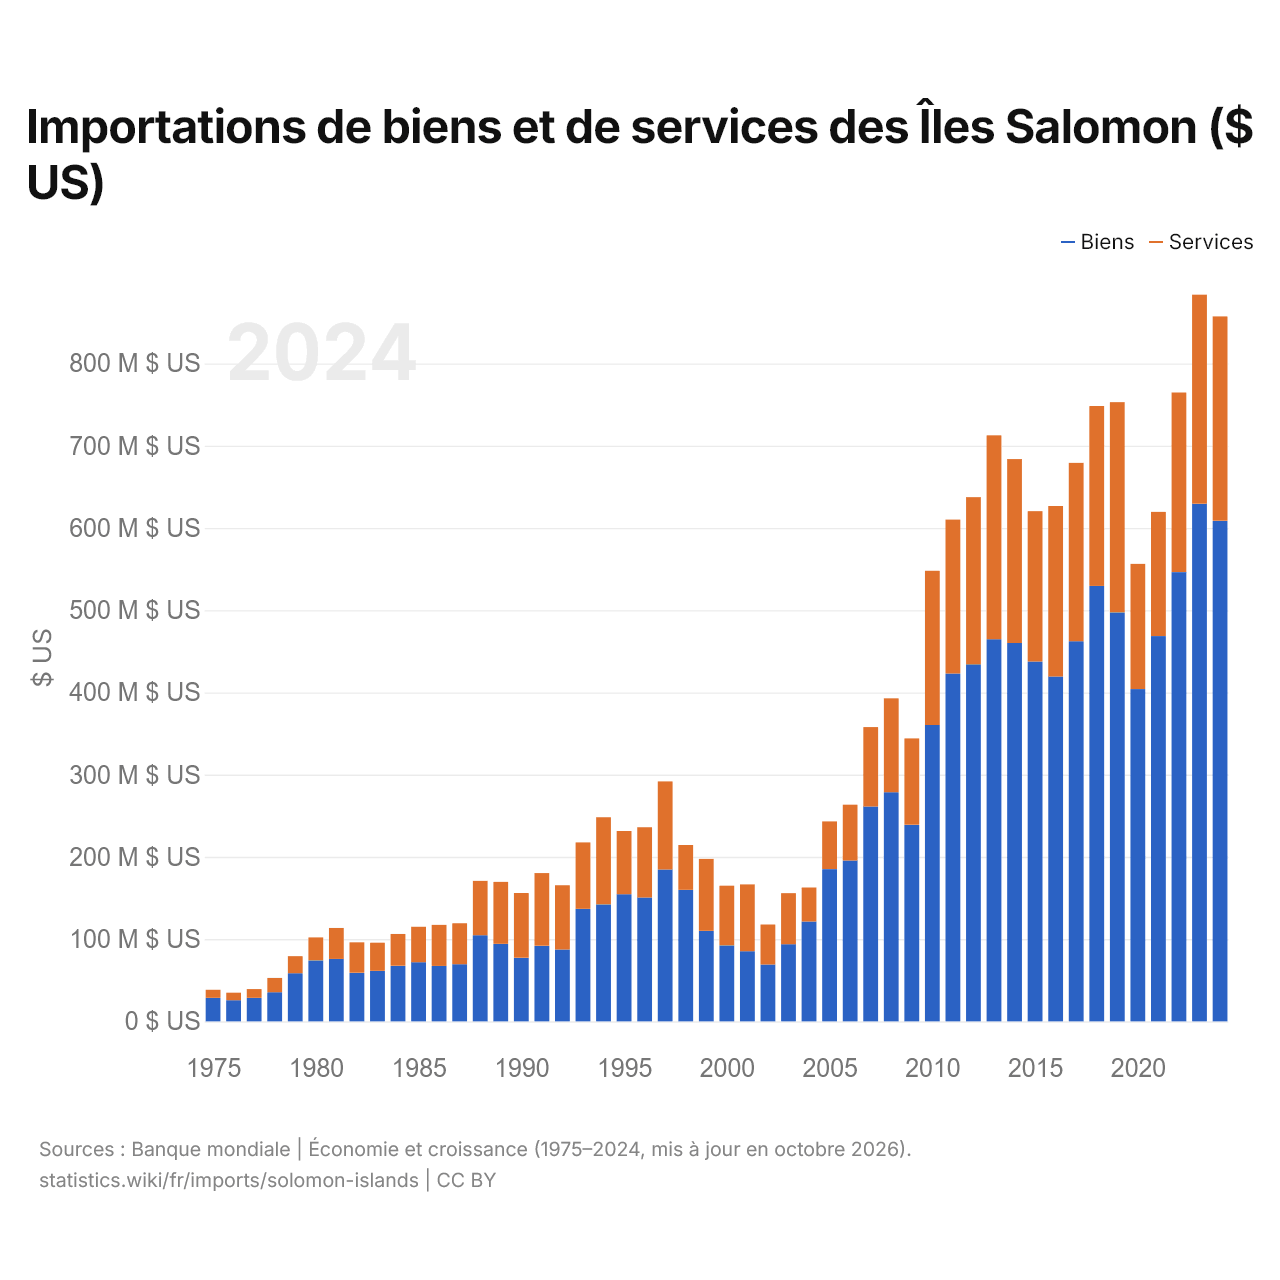
Importations de biens et de services des Îles Salomon ($ US)
| Année | $ US | |
|---|---|---|
| Biens | Services | |
| 2024 | 608 712 649 $ US | 248 415 612 $ US |
| 2023 | 629 457 452 $ US | 254 153 187 $ US |
| 2022 | 546 251 467 $ US | 218 389 763 $ US |
| 2021 | 468 455 948 $ US | 151 004 523 $ US |
| 2020 | 404 024 804 $ US | 152 235 430 $ US |
| 2019 | 497 282 604 $ US | 255 626 156 $ US |
| 2018 | 529 444 049 $ US | 218 767 652 $ US |
| 2017 | 462 136 305 $ US | 216 958 506 $ US |
| 2016 | 419 356 623 $ US | 207 267 820 $ US |
| 2015 | 437 476 638 $ US | 182 828 342 $ US |
| 2014 | 460 074 616 $ US | 223 635 546 $ US |
| 2013 | 464 579 248 $ US | 247 962 123 $ US |
| 2012 | 434 106 327 $ US | 203 315 765 $ US |
| 2011 | 423 036 437 $ US | 187 055 762 $ US |
| 2010 | 360 330 983 $ US | 187 540 936 $ US |
| 2009 | 239 039 382 $ US | 104 989 924 $ US |
| 2008 | 278 595 411 $ US | 114 173 023 $ US |
| 2007 | 261 137 692 $ US | 96 641 479 $ US |
| 2006 | 195 432 486 $ US | 67 964 544 $ US |
| 2005 | 185 089 310 $ US | 57 984 022 $ US |
| 2004 | 121 412 036 $ US | 41 301 632 $ US |
| 2003 | 93 846 693 $ US | 62 008 757 $ US |
| 2002 | 69 133 020 $ US | 48 604 346 $ US |
| 2001 | 85 341 092 $ US | 81 198 413 $ US |
| 2000 | 92 337 667 $ US | 72 588 921 $ US |
| 1999 | 110 042 251 $ US | 87 492 271 $ US |
| 1998 | 159 895 369 $ US | 54 530 550 $ US |
| 1997 | 184 533 431 $ US | 107 184 894 $ US |
| 1996 | 150 545 725 $ US | 85 465 332 $ US |
| 1995 | 154 525 970 $ US | 76 925 335 $ US |
| 1994 | 142 220 917 $ US | 105 944 101 $ US |
| 1993 | 136 868 412 $ US | 80 684 290 $ US |
| 1992 | 87 428 708 $ US | 78 036 952 $ US |
| 1991 | 91 979 004 $ US | 88 258 587 $ US |
| 1990 | 77 349 450 $ US | 78 693 970 $ US |
| 1989 | 94 277 024 $ US | 75 264 636 $ US |
| 1988 | 104 633 016 $ US | 66 217 957 $ US |
| 1987 | 69 485 638 $ US | 49 768 090 $ US |
| 1986 | 67 413 150 $ US | 49 899 512 $ US |
| 1985 | 71 854 670 $ US | 43 153 321 $ US |
| 1984 | 67 597 532 $ US | 38 627 161 $ US |
| 1983 | 61 468 364 $ US | 34 129 743 $ US |
| 1982 | 59 107 961 $ US | 36 968 220 $ US |
| 1981 | 75 847 572 $ US | 37 693 945 $ US |
| 1980 | 74 111 812 $ US | 27 957 627 $ US |
| 1979 | 58 431 969 $ US | 20 786 076 $ US |
| 1978 | 35 368 517 $ US | 17 398 106 $ US |
| 1977 | 28 608 919 $ US | 10 645 179 $ US |
| 1976 | 25 785 690 $ US | 9 043 322 $ US |
| 1975 | 28 539 012 $ US | 9 818 467 $ US |
Les importations de biens des Îles Salomon s'élèvent à 609 millions de dollars (2024) et celles de services à 248 millions de dollars ; les services représentent 29,0 % du total, contre 25,6 % en 1975.
Les Îles Salomon dans le classement mondial des importations
| Rang | Pays | Importations | Part mondiale | |
|---|---|---|---|---|
| 158 |
 Timor oriental |
1,58 Md $US | 0,005 % | |
| 159 |
 Gambie |
1,28 Md $US (2025) | 0,004 % | |
| 160 |
 Antigua-et-Barbuda |
1,18 Md $US (2022) | 0,004 % | |
| 161 |
 Îles Salomon |
1,12 Md $US | 0,004 % | |
| 162 |
 RCA |
1,03 Md $US (2025) | 0,003 % | |
| 163 |
 Burundi |
836 M $US (2023) | 0,003 % | |
| 164 |
 Soudan |
769 M $US (2025) | 0,002 % |
Importations de biens et services des Îles Salomon, % du PIB
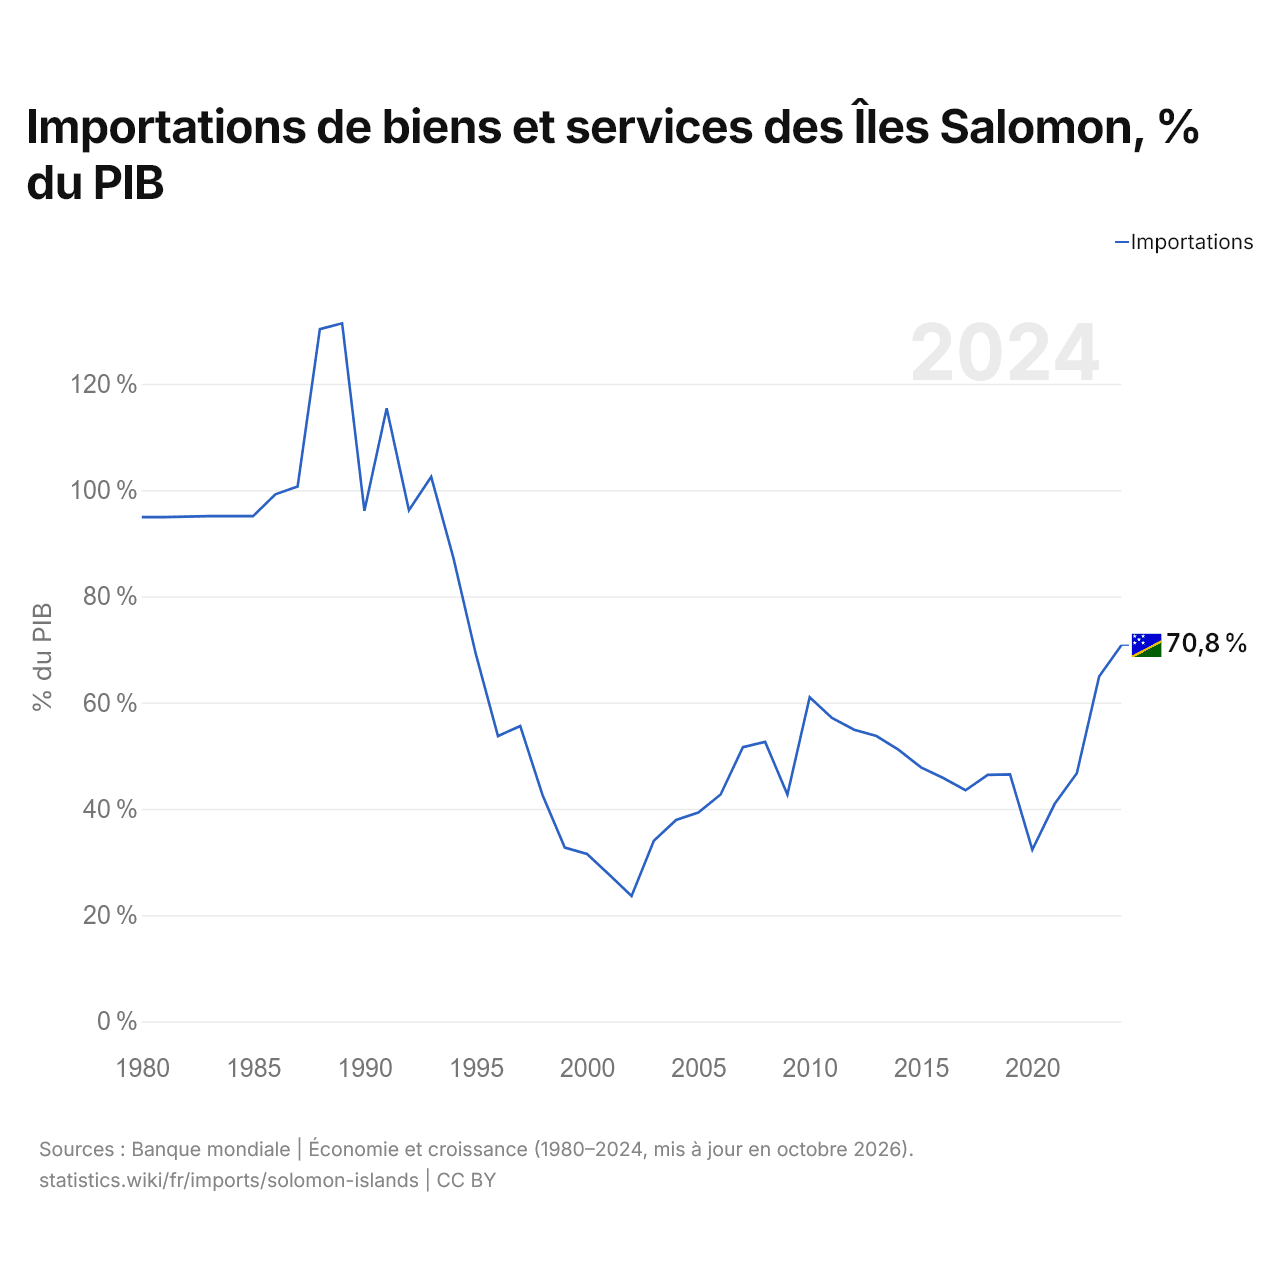
Les importations de biens et services des Îles Salomon équivalent à 70,8 % de leur PIB (2024), contre 94,9 % en 1980. La part la plus élevée a été de 131,4 %, en 1989.
Comparer les importations des Îles Salomon avec celles d'autres pays
Sources :
- Banque mondiale | Économie et croissance (1975–2025, mis à jour en octobre 2026)
- TradeMap (2001–2025, mis à jour en octobre 2026)
Creative Commons Attribution (CC BY) : vous pouvez copier, partager, adapter et réutiliser ce contenu, y compris à des fins commerciales, à condition de citer statistics.wiki et d’indiquer les modifications apportées. Les sources citées ci-dessus peuvent avoir leurs propres conditions de licence.