
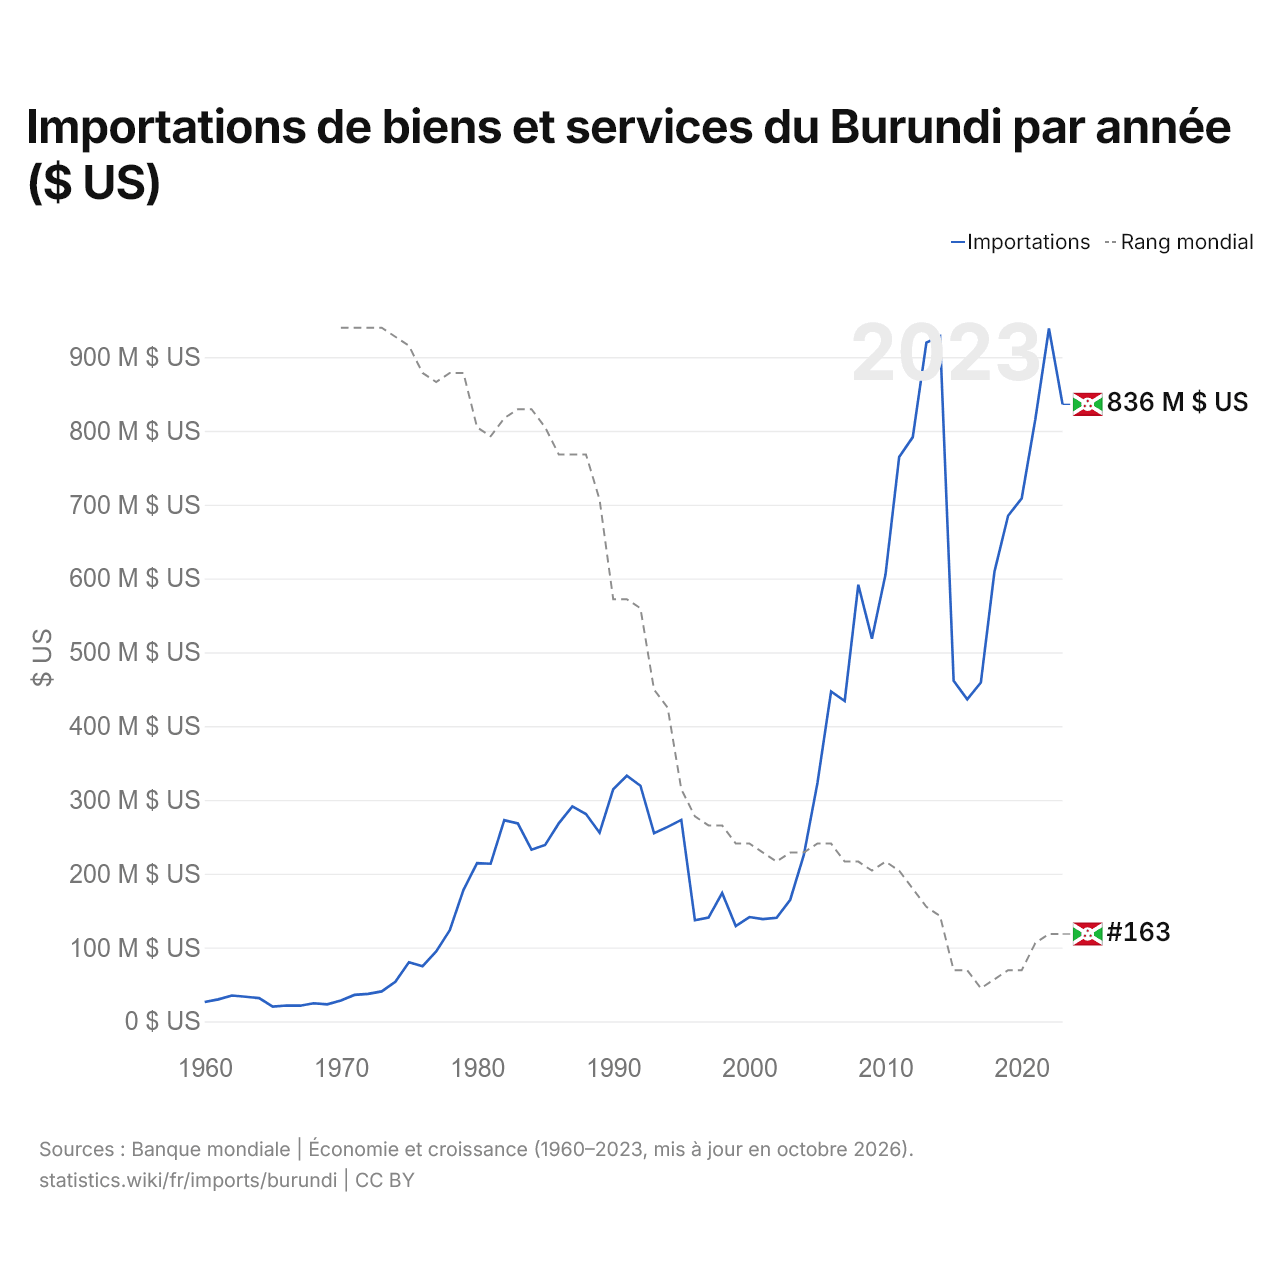
Importations de biens et services du Burundi par année ($ US)
| Année | $ US | Rang mondial |
|---|---|---|
| Importations | Rang mondial | |
| 2023 | 836 014 481 $ US | #163 |
| 2022 | 938 609 709 $ US | #163 |
| 2021 | 815 809 658 $ US | #164 |
| 2020 | 708 580 544 $ US | #167 |
| 2019 | 684 985 689 $ US | #167 |
| 2018 | 609 312 265 $ US | #168 |
| 2017 | 459 069 106 $ US | #169 |
| 2016 | 436 153 450 $ US | #167 |
| 2015 | 461 517 886 $ US | #167 |
| 2014 | 928 071 607 $ US | #161 |
| 2013 | 919 575 546 $ US | #160 |
| 2012 | 791 532 737 $ US | #158 |
| 2011 | 764 648 062 $ US | #156 |
| 2010 | 605 576 364 $ US | #155 |
| 2009 | 518 444 608 $ US | #156 |
| 2008 | 591 543 749 $ US | #155 |
| 2007 | 433 983 785 $ US | #155 |
| 2006 | 446 954 653 $ US | #153 |
| 2005 | 322 845 665 $ US | #153 |
| 2004 | 225 367 196 $ US | #154 |
| 2003 | 164 737 396 $ US | #154 |
| 2002 | 140 218 229 $ US | #155 |
| 2001 | 138 400 674 $ US | #154 |
| 2000 | 141 321 270 $ US | #153 |
| 1999 | 129 001 349 $ US | #153 |
| 1998 | 173 751 533 $ US | #151 |
| 1997 | 140 485 313 $ US | #151 |
| 1996 | 136 902 390 $ US | #150 |
| 1995 | 272 899 694 $ US | #147 |
| 1994 | 263 464 979 $ US | #138 |
| 1993 | 254 942 339 $ US | #136 |
| 1992 | 319 246 482 $ US | #127 |
| 1991 | 332 769 070 $ US | #126 |
| 1990 | 314 442 790 $ US | #126 |
| 1989 | 255 573 911 $ US | #115 |
| 1988 | 280 918 091 $ US | #110 |
| 1987 | 291 223 994 $ US | #110 |
| 1986 | 268 172 622 $ US | #110 |
| 1985 | 239 045 072 $ US | #107 |
| 1984 | 232 495 197 $ US | #105 |
| 1983 | 268 000 000 $ US | #105 |
| 1982 | 272 632 222 $ US | #106 |
| 1981 | 213 555 556 $ US | #108 |
| 1980 | 214 223 333 $ US | #107 |
| 1979 | 177 800 000 $ US | #101 |
| 1978 | 123 426 667 $ US | #101 |
| 1977 | 94 676 667 $ US | #102 |
| 1976 | 74 673 623 $ US | #101 |
| 1975 | 79 994 921 $ US | #98 |
| 1974 | 53 633 016 $ US | #97 |
| 1973 | 40 576 770 $ US | #96 |
| 1972 | 37 205 714 $ US | #96 |
| 1971 | 35 832 000 $ US | #96 |
| 1970 | 28 208 000 $ US | #96 |
| 1969 | 23 004 571 $ US | - |
| 1968 | 24 488 000 $ US | - |
| 1967 | 21 192 000 $ US | - |
| 1966 | 21 494 857 $ US | - |
| 1965 | 19 928 889 $ US | - |
| 1964 | 31 500 002 $ US | - |
| 1963 | 33 250 000 $ US | - |
| 1962 | 35 000 000 $ US | - |
| 1961 | 29 750 000 $ US | - |
| 1960 | 26 250 000 $ US | - |
Les importations de biens et services du Burundi s'élèvent à 836 millions de dollars (2023), contre 26,3 millions de dollars en 1960. Le maximum a été de 939 millions de dollars, en 2022. Elles se classent au 163e rang mondial, un rang qu'elles occupent depuis 2022. Leur meilleur rang a été le 96e, occupé pour la dernière fois en 1973.
Les importations de biens et services du Burundi sont les 46es plus élevées de 50 pays situés en Afrique. Les importations du Burundi dépassent ses exportations de 655 millions de dollars, soit un déficit commercial (2023). Le commerce du Burundi, exportations et importations réunies, équivaut à 29,7 % de son PIB (2023), au 167e rang mondial.
Importations de biens du Burundi par catégorie, 2025
Importations de biens, 2025: 1,31 Md $US
En 2025, la première catégorie des importations de biens du Burundi était « pétrole, gaz, minerais et autres matières premières », avec 29,3 %, suivie de « machines, électronique et véhicules », avec 19,3 %.
Origines des importations de biens du Burundi : les 10 premières, 2025
| Rang | Pays | Importations de biens | Part | |
|---|---|---|---|---|
| 1 |
 Chine |
301 M $US | 22,9 % | |
| 2 |
 Tanzanie |
168 M $US | 12,8 % | |
| 3 |
 EAU |
127 M $US | 9,7 % | |
| 4 |
 Arabie saoudite |
127 M $US | 9,69 % | |
| 5 |
 Inde |
93,4 M $US | 7,12 % | |
| 6 |
 Ouganda |
71,2 M $US | 5,43 % | vs Ouganda |
| 7 |
 Kenya |
61,0 M $US | 4,65 % | |
| 8 |
 Japon |
54,8 M $US | 4,17 % | |
| 9 |
 Belgique |
25,9 M $US | 1,98 % | |
| 10 |
 RDC |
25,2 M $US | 1,92 % | |
| Autres partenaires et non précisés | 257 M $US | 19,6 % |
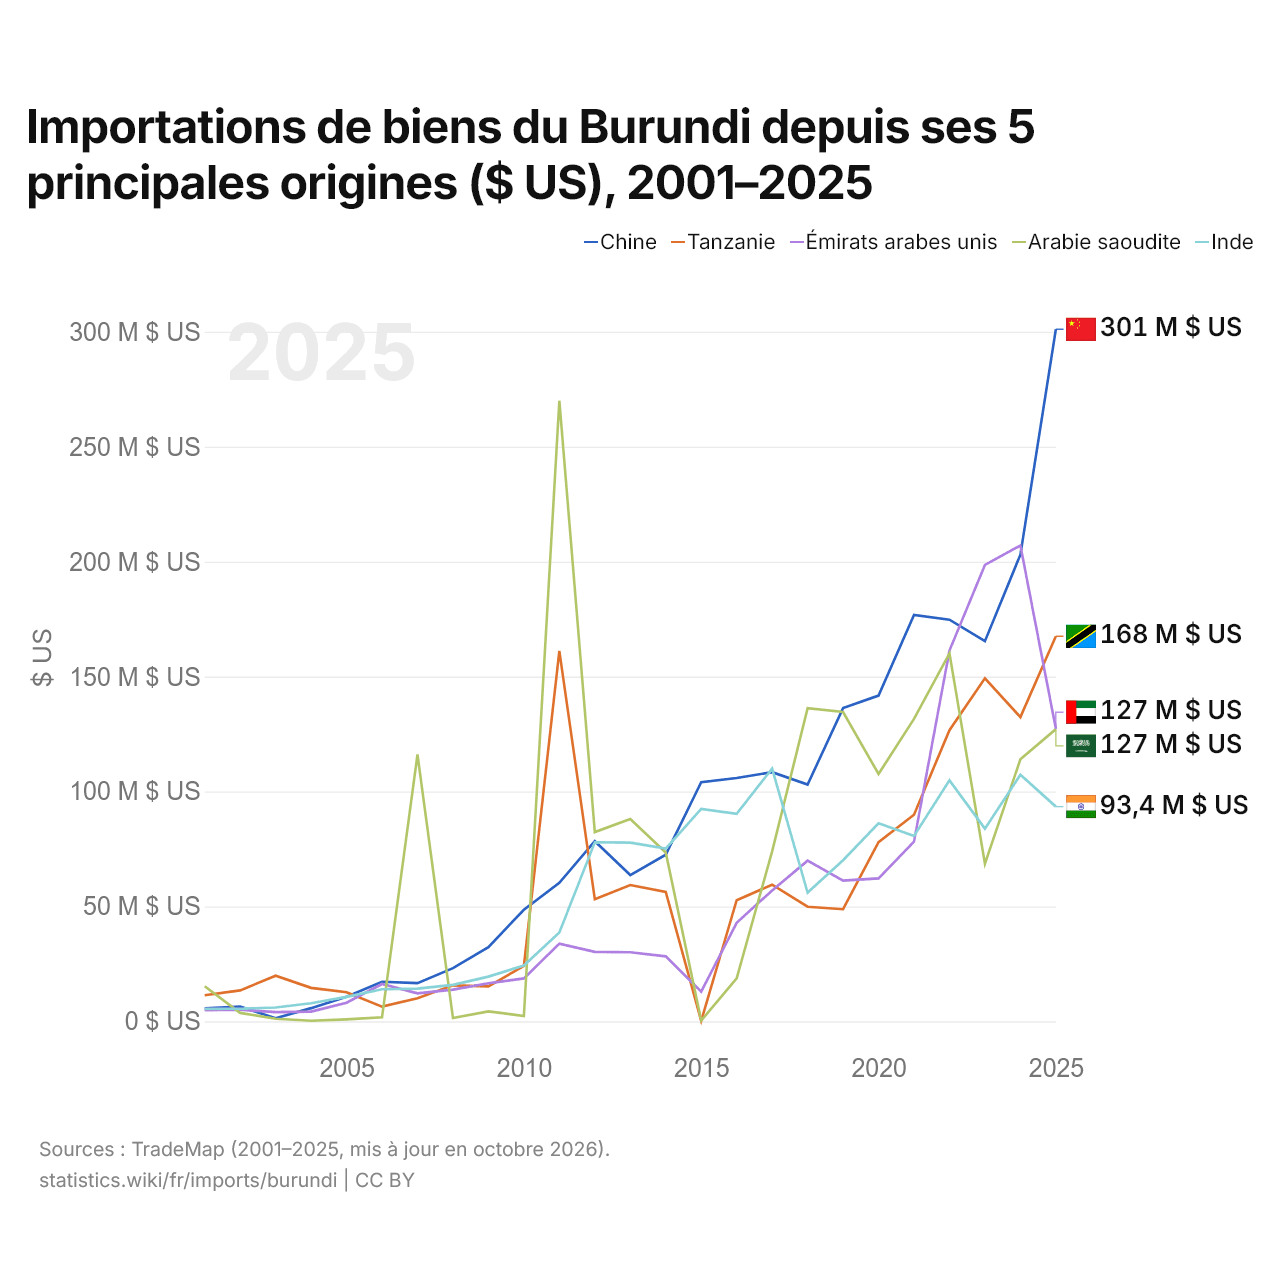
Importations de biens du Burundi depuis ses 5 principales origines ($ US), 2001–2025
| Année | $ US | ||||
|---|---|---|---|---|---|
| Chine | Tanzanie | Émirats arabes unis | Arabie saoudite | Inde | |
| 2025 | 301 102 000 $ US | 167 532 000 $ US | 127 268 000 $ US | 127 122 000 $ US | 93 410 000 $ US |
| 2024 | 203 031 000 $ US | 132 366 000 $ US | 206 992 000 $ US | 113 994 000 $ US | 107 270 000 $ US |
| 2023 | 165 402 000 $ US | 149 266 000 $ US | 198 570 000 $ US | 68 582 000 $ US | 83 818 000 $ US |
| 2022 | 174 739 000 $ US | 126 697 000 $ US | 161 312 000 $ US | 160 084 000 $ US | 104 832 000 $ US |
| 2021 | 176 764 000 $ US | 89 899 000 $ US | 78 181 000 $ US | 131 590 000 $ US | 80 622 000 $ US |
| 2020 | 141 732 000 $ US | 77 979 000 $ US | 62 201 000 $ US | 107 603 000 $ US | 86 155 000 $ US |
| 2019 | 136 273 000 $ US | 48 775 000 $ US | 61 188 000 $ US | 134 563 000 $ US | 70 069 000 $ US |
| 2018 | 103 007 000 $ US | 49 846 000 $ US | 69 902 000 $ US | 136 199 000 $ US | 56 010 000 $ US |
| 2017 | 108 415 000 $ US | 59 436 000 $ US | 56 962 000 $ US | 73 966 000 $ US | 109 963 000 $ US |
| 2016 | 105 857 000 $ US | 52 707 000 $ US | 42 892 000 $ US | 18 697 000 $ US | 90 323 000 $ US |
| 2015 | 104 052 000 $ US | 207 000 $ US | 12 921 000 $ US | 333 000 $ US | 92 426 000 $ US |
| 2014 | 72 488 000 $ US | 56 298 000 $ US | 28 273 000 $ US | 73 452 000 $ US | 75 161 000 $ US |
| 2013 | 63 620 000 $ US | 59 294 000 $ US | 30 073 000 $ US | 87 995 000 $ US | 77 760 000 $ US |
| 2012 | 78 392 000 $ US | 53 119 000 $ US | 30 250 000 $ US | 82 317 000 $ US | 77 898 000 $ US |
| 2011 | 60 273 000 $ US | 161 165 000 $ US | 33 811 000 $ US | 270 007 000 $ US | 38 634 000 $ US |
| 2010 | 48 572 000 $ US | 24 098 000 $ US | 18 685 000 $ US | 2 305 000 $ US | 24 315 000 $ US |
| 2009 | 32 279 000 $ US | 15 231 000 $ US | 16 559 000 $ US | 4 359 000 $ US | 19 449 000 $ US |
| 2008 | 23 152 000 $ US | 15 651 000 $ US | 13 771 000 $ US | 1 476 000 $ US | 15 859 000 $ US |
| 2007 | 16 598 000 $ US | 10 075 000 $ US | 12 198 000 $ US | 116 086 000 $ US | 14 235 000 $ US |
| 2006 | 17 221 000 $ US | 6 391 000 $ US | 16 258 000 $ US | 1 794 000 $ US | 13 950 000 $ US |
| 2005 | 10 727 000 $ US | 12 635 000 $ US | 8 101 000 $ US | 847 000 $ US | 10 643 000 $ US |
| 2004 | 5 735 000 $ US | 14 558 000 $ US | 4 234 000 $ US | 239 000 $ US | 7 882 000 $ US |
| 2003 | 1 364 000 $ US | 19 836 000 $ US | 3 995 000 $ US | 1 128 000 $ US | 6 032 000 $ US |
| 2002 | 6 429 000 $ US | 13 452 000 $ US | 5 055 000 $ US | 3 669 000 $ US | 5 461 000 $ US |
| 2001 | 5 679 000 $ US | 11 336 000 $ US | 4 908 000 $ US | 15 267 000 $ US | 5 434 000 $ US |
En 2025, les importations de biens s'élevaient à 301 millions de dollars en provenance de la Chine, 168 millions de dollars en provenance de la Tanzanie, 127 millions de dollars en provenance des Émirats arabes unis, 127 millions de dollars en provenance de l'Arabie saoudite et 93,4 millions de dollars en provenance de l'Inde. Le changement le plus récent dans leur ordre remonte à 2025, quand les importations du Burundi en provenance de la Tanzanie ont dépassé celles en provenance des Émirats arabes unis.
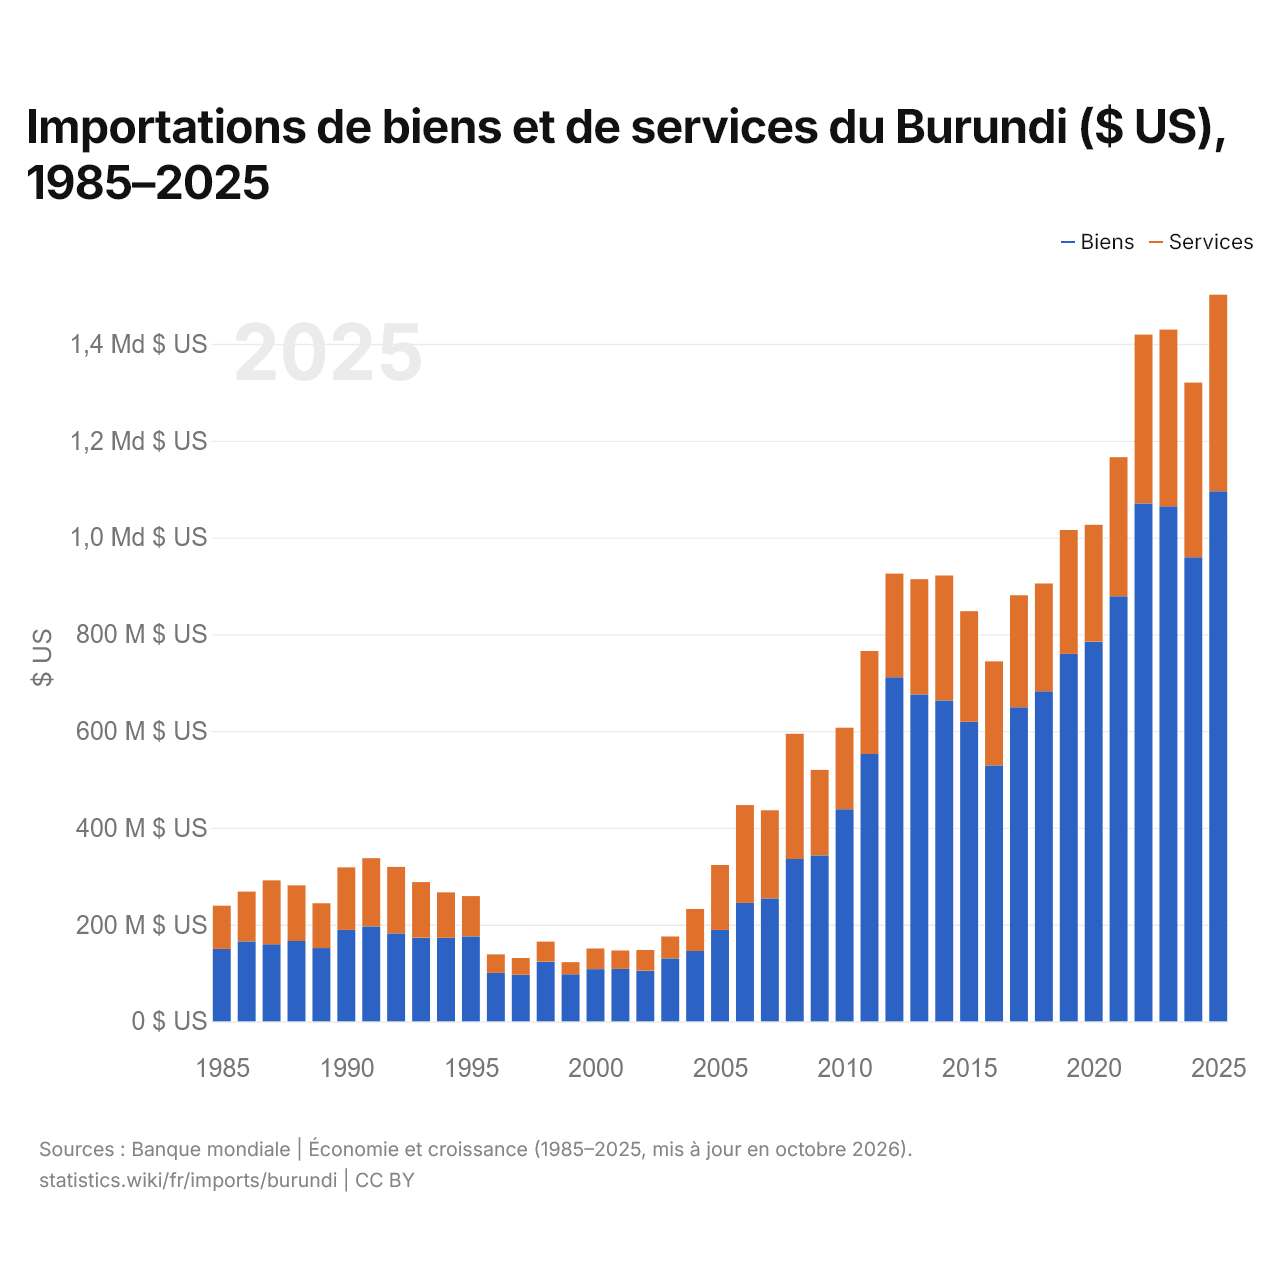
Importations de biens et de services du Burundi ($ US), 1985–2025
| Année | $ US | |
|---|---|---|
| Biens | Services | |
| 2025 | 1 095 414 168 $ US | 406 277 128 $ US |
| 2024 | 959 050 839 $ US | 360 956 738 $ US |
| 2023 | 1 064 360 967 $ US | 365 163 809 $ US |
| 2022 | 1 070 122 493 $ US | 348 973 226 $ US |
| 2021 | 878 551 205 $ US | 287 247 481 $ US |
| 2020 | 784 742 724 $ US | 241 321 925 $ US |
| 2019 | 759 303 568 $ US | 256 038 163 $ US |
| 2018 | 681 993 033 $ US | 222 832 747 $ US |
| 2017 | 648 990 352 $ US | 231 486 117 $ US |
| 2016 | 528 919 093 $ US | 215 003 022 $ US |
| 2015 | 618 971 920 $ US | 228 628 827 $ US |
| 2014 | 663 338 182 $ US | 258 059 046 $ US |
| 2013 | 675 595 584 $ US | 238 158 757 $ US |
| 2012 | 711 045 616 $ US | 214 279 580 $ US |
| 2011 | 552 470 250 $ US | 212 851 143 $ US |
| 2010 | 438 394 337 $ US | 168 347 821 $ US |
| 2009 | 343 026 863 $ US | 176 634 108 $ US |
| 2008 | 335 469 828 $ US | 258 775 215 $ US |
| 2007 | 254 120 718 $ US | 182 131 825 $ US |
| 2006 | 244 704 991 $ US | 202 225 941 $ US |
| 2005 | 188 911 995 $ US | 134 080 771 $ US |
| 2004 | 145 429 103 $ US | 86 626 033 $ US |
| 2003 | 130 047 293 $ US | 45 272 210 $ US |
| 2002 | 104 798 697 $ US | 42 689 160 $ US |
| 2001 | 108 259 697 $ US | 38 222 644 $ US |
| 2000 | 107 858 715 $ US | 42 628 468 $ US |
| 1999 | 97 296 573 $ US | 24 875 857 $ US |
| 1998 | 123 484 187 $ US | 41 349 292 $ US |
| 1997 | 96 069 022 $ US | 34 720 792 $ US |
| 1996 | 100 014 313 $ US | 38 368 713 $ US |
| 1995 | 175 558 292 $ US | 83 336 837 $ US |
| 1994 | 172 593 875 $ US | 93 923 712 $ US |
| 1993 | 172 843 727 $ US | 114 832 359 $ US |
| 1992 | 181 773 957 $ US | 137 337 656 $ US |
| 1991 | 195 925 810 $ US | 141 311 966 $ US |
| 1990 | 189 021 758 $ US | 129 214 599 $ US |
| 1989 | 151 405 462 $ US | 92 615 546 $ US |
| 1988 | 166 060 045 $ US | 114 875 886 $ US |
| 1987 | 159 172 789 $ US | 132 077 482 $ US |
| 1986 | 165 304 554 $ US | 102 880 691 $ US |
| 1985 | 149 696 642 $ US | 89 319 190 $ US |
En 2025, les importations de biens du Burundi s'élevaient à 1,1 milliard de dollars et celles de services à 406 millions de dollars ; les services représentaient 27,1 % du total, contre 37,4 % en 1985.
Le Burundi dans le classement mondial des importations
| Rang | Pays | Importations | Part mondiale | |
|---|---|---|---|---|
| 160 |
 Antigua-et-Barbuda |
1,18 Md $US (2022) | 0,004 % | |
| 161 |
 Îles Salomon |
1,12 Md $US (2024) | 0,004 % | |
| 162 |
 RCA |
1,03 Md $US (2025) | 0,003 % | |
| 163 |
 Burundi |
836 M $US | 0,003 % | |
| 164 |
 Soudan |
769 M $US (2025) | 0,002 % | |
| 165 |
 Guinée-Bissau |
683 M $US (2025) | 0,002 % | |
| 166 |
 Vanuatu |
623 M $US (2024) | 0,002 % |
Importations de biens et services du Burundi, % du PIB
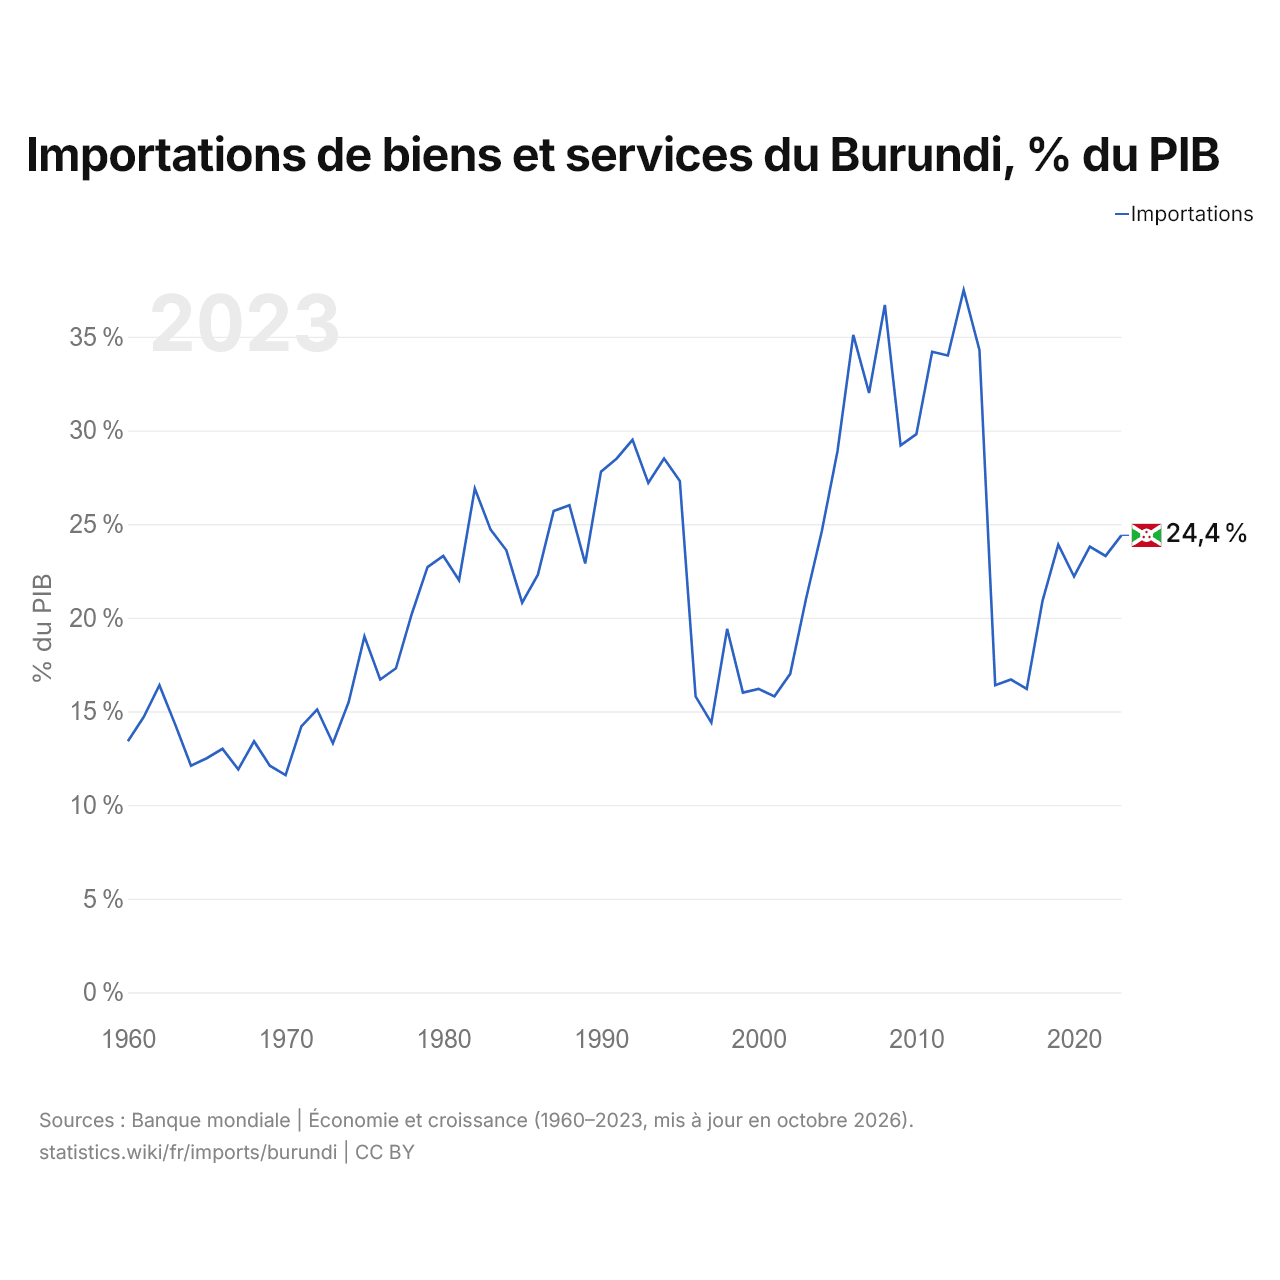
Les importations de biens et services du Burundi équivalent à 24,4 % de son PIB (2023), contre 13,4 % en 1960. La part la plus élevée a été de 37,5 %, en 2013.
Comparer les importations du Burundi avec celles d'autres pays
Sources :
- Banque mondiale | Économie et croissance (1960–2025, mis à jour en octobre 2026)
- TradeMap (2001–2025, mis à jour en octobre 2026)
Creative Commons Attribution (CC BY) : vous pouvez copier, partager, adapter et réutiliser ce contenu, y compris à des fins commerciales, à condition de citer statistics.wiki et d’indiquer les modifications apportées. Les sources citées ci-dessus peuvent avoir leurs propres conditions de licence.