
Importations de biens et services du Kenya par année ($ US), 1960–2025
| Année | $ US | Rang mondial |
|---|---|---|
| Importations | Rang mondial | |
| 2025 | 29 576 712 519 $ US | #83 |
| 2024 | 27 873 592 864 $ US | #84 |
| 2023 | 26 037 169 470 $ US | #84 |
| 2022 | 27 832 040 675 $ US | #81 |
| 2021 | 24 016 664 626 $ US | #82 |
| 2020 | 19 082 744 157 $ US | #80 |
| 2019 | 20 408 407 784 $ US | #83 |
| 2018 | 20 167 352 977 $ US | #84 |
| 2017 | 19 080 378 151 $ US | #80 |
| 2016 | 16 171 498 982 $ US | #84 |
| 2015 | 17 669 406 545 $ US | #82 |
| 2014 | 20 279 300 678 $ US | #79 |
| 2013 | 18 299 434 695 $ US | #84 |
| 2012 | 17 910 885 230 $ US | #82 |
| 2011 | 17 272 679 879 $ US | #81 |
| 2010 | 13 744 246 853 $ US | #80 |
| 2009 | 11 505 843 417 $ US | #82 |
| 2008 | 12 529 038 544 $ US | #86 |
| 2007 | 10 218 887 780 $ US | #85 |
| 2006 | 8 329 126 840 $ US | #87 |
| 2005 | 6 739 990 276 $ US | #90 |
| 2004 | 5 290 013 363 $ US | #91 |
| 2003 | 4 478 129 486 $ US | #91 |
| 2002 | 3 980 437 857 $ US | #91 |
| 2001 | 4 287 364 072 $ US | #86 |
| 2000 | 4 030 324 232 $ US | #84 |
| 1999 | 3 528 289 113 $ US | #87 |
| 1998 | 4 048 921 326 $ US | #85 |
| 1997 | 4 114 510 960 $ US | #85 |
| 1996 | 3 868 109 121 $ US | #82 |
| 1995 | 3 541 999 889 $ US | #83 |
| 1994 | 2 446 514 204 $ US | #86 |
| 1993 | 1 953 010 595 $ US | #90 |
| 1992 | 2 189 413 218 $ US | #85 |
| 1991 | 2 327 744 590 $ US | #79 |
| 1990 | 2 685 575 018 $ US | #75 |
| 1989 | 2 495 151 393 $ US | #67 |
| 1988 | 2 306 399 998 $ US | #64 |
| 1987 | 2 104 101 026 $ US | #66 |
| 1986 | 2 163 994 300 $ US | #65 |
| 1985 | 1 849 498 187 $ US | #64 |
| 1984 | 1 984 603 543 $ US | #65 |
| 1983 | 1 686 897 647 $ US | #67 |
| 1982 | 2 029 695 253 $ US | #65 |
| 1981 | 2 318 209 963 $ US | #63 |
| 1980 | 2 608 236 154 $ US | #59 |
| 1979 | 1 970 754 654 $ US | #57 |
| 1978 | 2 051 910 224 $ US | #57 |
| 1977 | 1 419 913 416 $ US | #58 |
| 1976 | 1 103 363 095 $ US | #64 |
| 1975 | 1 124 851 546 $ US | #59 |
| 1974 | 1 214 639 514 $ US | #54 |
| 1973 | 719 305 941 $ US | #57 |
| 1972 | 605 359 758 $ US | #55 |
| 1971 | 625 800 030 $ US | #54 |
| 1970 | 491 679 803 $ US | #55 |
| 1969 | 409 639 836 $ US | - |
| 1968 | 396 479 841 $ US | - |
| 1967 | 362 039 855 $ US | - |
| 1966 | 359 519 856 $ US | - |
| 1965 | 306 319 877 $ US | - |
| 1964 | 291 759 883 $ US | - |
| 1963 | 268 365 893 $ US | - |
| 1962 | 261 519 895 $ US | - |
| 1961 | 246 847 901 $ US | - |
| 1960 | 266 419 907 $ US | - |
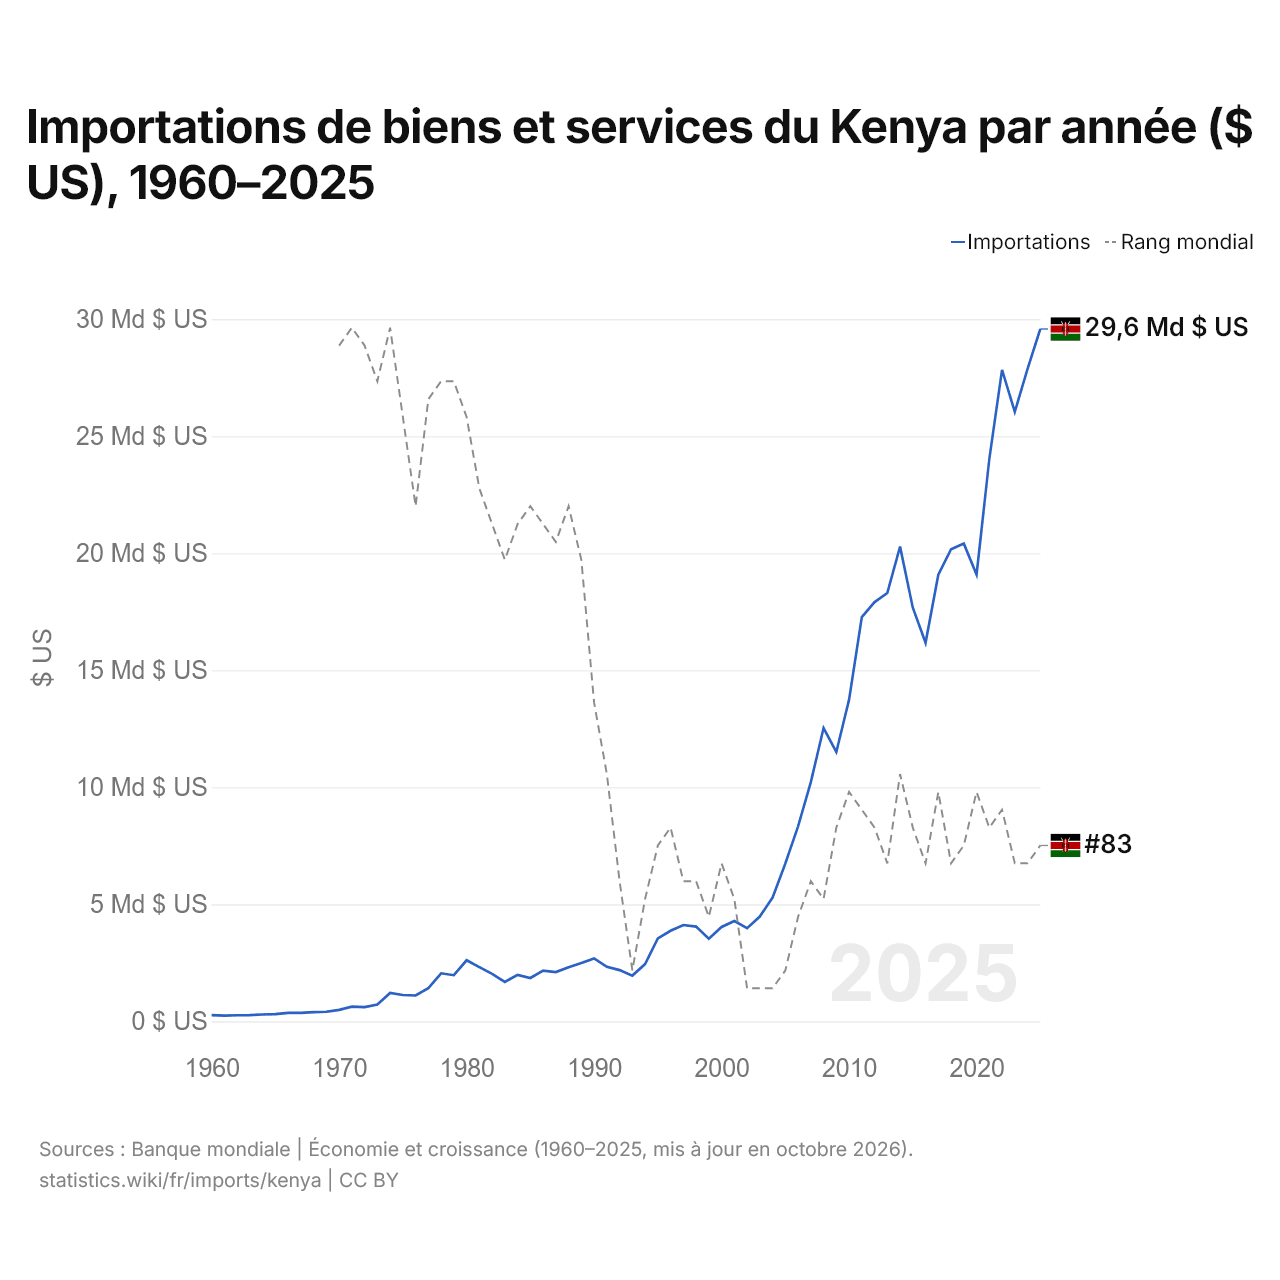
En 2025, les importations de biens et services du Kenya s'élevaient à 29,6 milliards de dollars, contre 266 millions de dollars en 1960. Le minimum a été de 247 millions de dollars, en 1961. Elles se classaient au 83e rang mondial, en hausse par rapport au 84e rang en 2024. Leur meilleur rang a été le 54e, occupé pour la dernière fois en 1974.
En 2025, les importations de biens et services du Kenya étaient les 8es plus élevées de 50 pays situés en Afrique. En 2025, les importations du Kenya dépassaient ses exportations de 8,15 milliards de dollars, soit un déficit commercial. Le commerce du Kenya, exportations et importations réunies, équivalait à 37,5 % de son PIB en 2025, au 156e rang mondial.
Importations de biens du Kenya par catégorie, 2025
Importations de biens, 2025: 21,7 Md $US
En 2025, la première catégorie des importations de biens du Kenya était « pétrole, gaz, minerais et autres matières premières », avec 25,6 %, suivie de « machines, électronique et véhicules », avec 25,3 %.
Origines des importations de biens du Kenya : les 10 premières, 2025
| Rang | Pays | Importations de biens | Part | |
|---|---|---|---|---|
| 1 |
 Chine |
5,19 Md $US | 23,9 % | |
| 2 |
 EAU |
2,51 Md $US | 11,5 % | |
| 3 |
 Inde |
2,27 Md $US | 10,4 % | |
| 4 |
 Malaisie |
1,11 Md $US | 5,1 % | |
| 5 |
 Japon |
1,09 Md $US | 5,03 % | |
| 6 |
 États-Unis |
1,06 Md $US | 4,86 % | |
| 7 |
 Arabie saoudite |
771 M $US | 3,55 % | |
| 8 |
 Afrique du Sud |
495 M $US | 2,28 % | |
| 9 |
 Oman |
471 M $US | 2,17 % | |
| 10 |
 Allemagne |
405 M $US | 1,87 % | |
| Autres partenaires et non précisés | 6,35 Md $US | 29,3 % |
Importations de biens du Kenya depuis ses 5 principales origines ($ US), 2001–2025
| Année | $ US | ||||
|---|---|---|---|---|---|
| Chine | Émirats arabes unis | Inde | Malaisie | Japon | |
| 2025 | 5 190 857 000 $ US | 2 506 541 000 $ US | 2 266 333 000 $ US | 1 107 800 000 $ US | 1 091 478 000 $ US |
| 2024 | 4 307 075 000 $ US | 2 516 594 000 $ US | 1 965 977 000 $ US | 1 012 848 000 $ US | 816 975 000 $ US |
| 2023 | 3 281 472 000 $ US | 2 959 496 000 $ US | 1 929 075 000 $ US | 865 236 000 $ US | 699 903 000 $ US |
| 2022 | 3 844 695 000 $ US | 3 458 269 000 $ US | 2 123 477 000 $ US | 1 023 761 000 $ US | 829 578 000 $ US |
| 2021 | 4 026 455 000 $ US | 1 628 614 000 $ US | 2 107 139 000 $ US | 855 135 000 $ US | 893 431 000 $ US |
| 2020 | 3 396 181 000 $ US | 867 276 000 $ US | 1 772 394 000 $ US | 428 205 000 $ US | 823 296 000 $ US |
| 2019 | 3 590 419 000 $ US | 1 632 761 000 $ US | 1 706 151 000 $ US | 250 051 000 $ US | 947 059 000 $ US |
| 2018 | 3 660 351 000 $ US | 1 455 200 000 $ US | 1 829 654 000 $ US | 212 040 000 $ US | 987 844 000 $ US |
| 2017 | 3 778 326 000 $ US | 1 338 292 000 $ US | 1 648 307 000 $ US | 172 826 000 $ US | 789 891 000 $ US |
| 2016 | 3 326 077 000 $ US | 901 692 000 $ US | 2 025 500 000 $ US | 121 438 000 $ US | 812 271 000 $ US |
| 2015 | 3 275 340 000 $ US | 924 694 000 $ US | 2 578 117 000 $ US | 107 769 000 $ US | 900 871 000 $ US |
| 2014 | 2 827 339 000 $ US | 1 174 092 000 $ US | 3 007 998 000 $ US | 125 829 000 $ US | 984 187 000 $ US |
| 2013 | 2 117 255 000 $ US | 1 362 617 000 $ US | 2 998 197 000 $ US | 108 546 000 $ US | 972 044 000 $ US |
| 2012 | 1 980 753 000 $ US | 1 775 492 000 $ US | 2 312 728 000 $ US | 83 344 000 $ US | 747 906 000 $ US |
| 2011 | 1 630 061 000 $ US | 2 256 282 000 $ US | 1 683 497 000 $ US | 112 039 000 $ US | 664 061 000 $ US |
| 2010 | 1 522 538 000 $ US | 1 462 913 000 $ US | 1 301 586 000 $ US | 93 341 000 $ US | 734 576 000 $ US |
| 2009 | 965 179 000 $ US | 1 161 837 000 $ US | 1 078 089 000 $ US | 75 892 000 $ US | 632 703 000 $ US |
| 2008 | 932 203 000 $ US | 1 655 691 000 $ US | 1 309 547 000 $ US | 67 286 000 $ US | 649 334 000 $ US |
| 2007 | 678 736 000 $ US | 1 328 962 000 $ US | 844 550 000 $ US | 40 803 000 $ US | 611 196 000 $ US |
| 2006 | 412 441 000 $ US | 1 075 853 000 $ US | 524 285 000 $ US | 36 457 000 $ US | 408 086 000 $ US |
| 2005 | 304 058 000 $ US | 831 224 000 $ US | 326 044 000 $ US | 23 340 000 $ US | 305 371 000 $ US |
| 2004 | - | - | - | - | - |
| 2003 | 86 558 000 $ US | 406 045 000 $ US | 175 441 000 $ US | 15 285 000 $ US | 209 386 000 $ US |
| 2002 | 74 961 000 $ US | 373 803 000 $ US | 166 590 000 $ US | 14 327 000 $ US | 190 830 000 $ US |
| 2001 | 94 910 000 $ US | 563 205 000 $ US | 170 419 000 $ US | 26 094 000 $ US | 197 260 000 $ US |
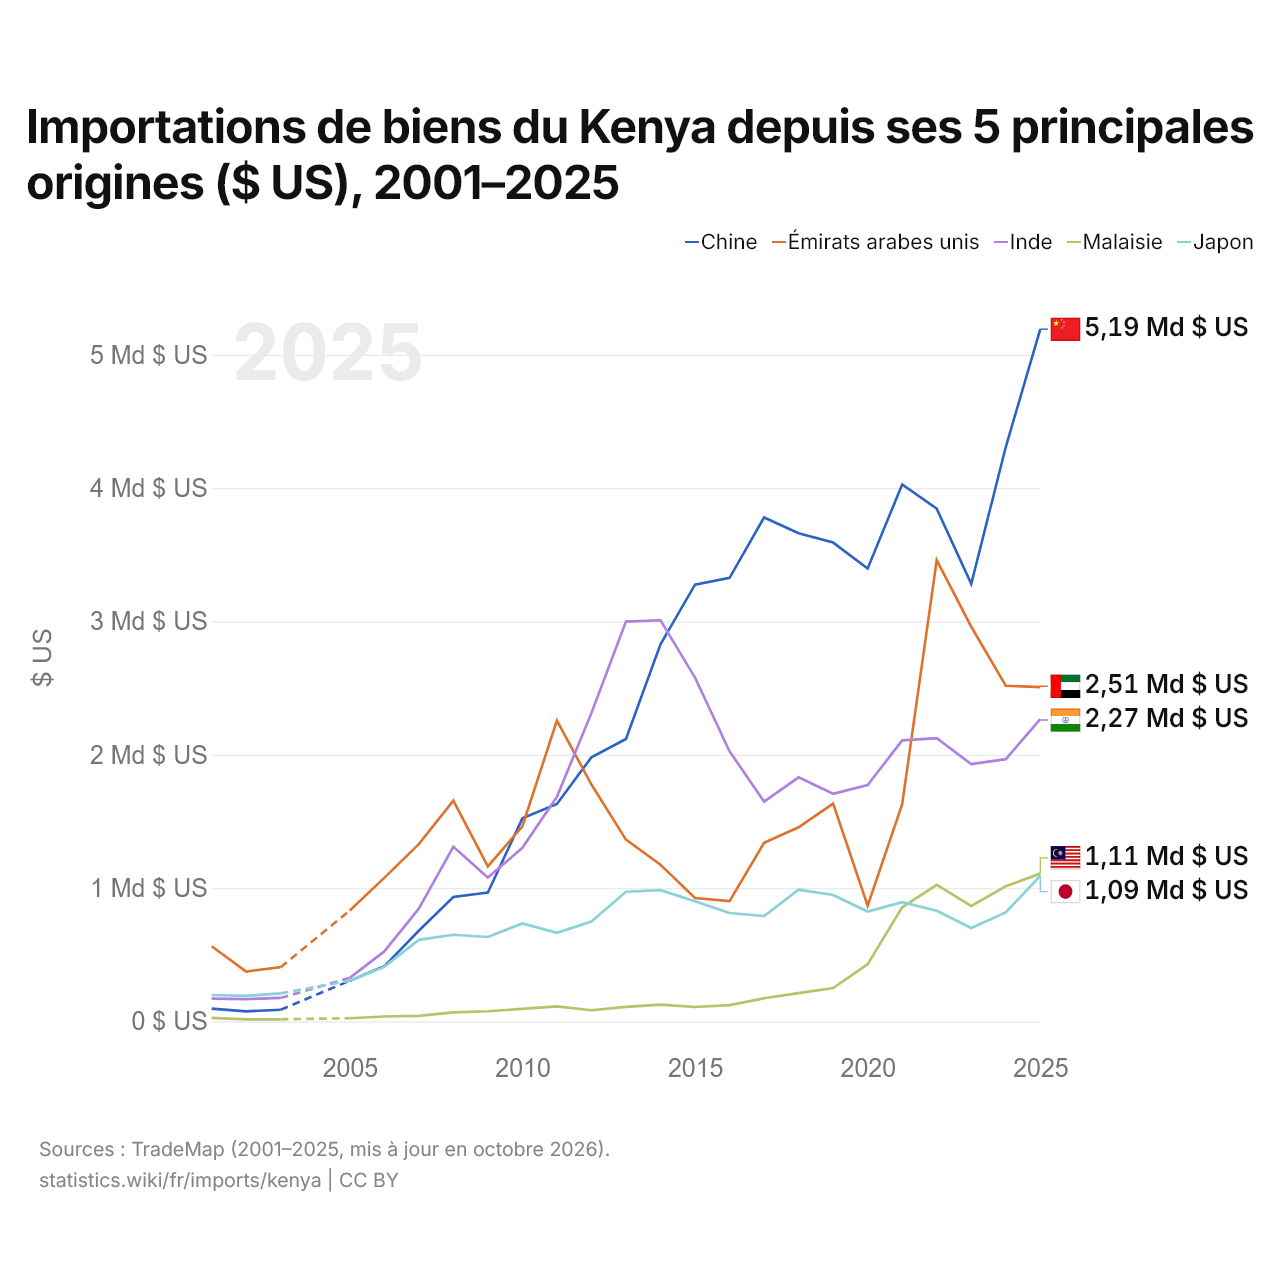
En 2025, les importations de biens s'élevaient à 5,19 milliards de dollars en provenance de la Chine, 2,51 milliards de dollars en provenance des Émirats arabes unis, 2,27 milliards de dollars en provenance de l'Inde, 1,11 milliard de dollars en provenance de la Malaisie et 1,09 milliard de dollars en provenance du Japon. Le premier rang des cinq fournisseurs du Kenya est occupé par la Chine depuis 2015. Le changement le plus récent dans leur ordre remonte à 2022, quand les importations du Kenya en provenance des Émirats arabes unis ont dépassé celles en provenance de l'Inde.
Importations de biens et de services du Kenya ($ US), 1975–2025
| Année | $ US | |
|---|---|---|
| Biens | Services | |
| 2025 | 23 687 894 541 $ US | 5 888 814 545 $ US |
| 2024 | 22 193 770 741 $ US | 5 679 823 394 $ US |
| 2023 | 20 608 670 931 $ US | 5 428 498 980 $ US |
| 2022 | 22 195 961 197 $ US | 5 636 078 179 $ US |
| 2021 | 19 798 649 984 $ US | 4 218 013 609 $ US |
| 2020 | 15 666 266 844 $ US | 3 416 477 622 $ US |
| 2019 | 16 553 622 711 $ US | 3 854 789 280 $ US |
| 2018 | 16 286 209 291 $ US | 3 881 144 035 $ US |
| 2017 | 15 988 393 104 $ US | 3 091 985 355 $ US |
| 2016 | 13 439 062 110 $ US | 2 732 435 859 $ US |
| 2015 | 14 348 767 064 $ US | 3 320 635 761 $ US |
| 2014 | 16 929 142 272 $ US | 3 349 534 944 $ US |
| 2013 | 16 089 450 652 $ US | 2 206 858 066 $ US |
| 2012 | 15 526 910 605 $ US | 2 388 633 991 $ US |
| 2011 | 14 188 868 539 $ US | 2 139 100 585 $ US |
| 2010 | 11 442 207 432 $ US | 2 089 123 670 $ US |
| 2009 | 9 461 215 788 $ US | 1 840 439 515 $ US |
| 2008 | 10 635 635 252 $ US | 1 923 553 810 $ US |
| 2007 | 8 368 727 954 $ US | 1 690 323 118 $ US |
| 2006 | 6 752 090 872 $ US | 1 418 941 264 $ US |
| 2005 | 5 586 540 336 $ US | 1 152 258 436 $ US |
| 2004 | 4 334 567 878 $ US | 955 234 905 $ US |
| 2003 | 3 553 083 383 $ US | 706 112 174 $ US |
| 2002 | 3 141 579 312 $ US | 725 738 409 $ US |
| 2001 | 3 215 222 187 $ US | 833 233 201 $ US |
| 2000 | 3 021 577 321 $ US | 741 066 184 $ US |
| 1999 | 6 921 397 355 $ US | 1 485 407 689 $ US |
| 1998 | 6 992 035 013 $ US | 1 442 800 915 $ US |
| 1997 | 5 843 244 997 $ US | 1 287 265 610 $ US |
| 1996 | 4 723 908 603 $ US | 938 792 877 $ US |
| 1995 | 4 810 372 857 $ US | 1 111 247 560 $ US |
| 1994 | 4 506 610 818 $ US | 1 167 899 928 $ US |
| 1993 | 3 968 362 034 $ US | 973 272 764 $ US |
| 1992 | 1 594 011 412 $ US | 578 393 283 $ US |
| 1991 | 1 697 292 653 $ US | 632 724 457 $ US |
| 1990 | 2 005 344 443 $ US | 699 679 828 $ US |
| 1989 | 1 963 400 921 $ US | 603 136 231 $ US |
| 1988 | 1 802 209 939 $ US | 530 002 085 $ US |
| 1987 | 1 622 596 464 $ US | 504 725 407 $ US |
| 1986 | 1 454 602 229 $ US | 415 204 441 $ US |
| 1985 | 1 269 769 466 $ US | 359 539 804 $ US |
| 1984 | 1 348 214 828 $ US | 376 997 858 $ US |
| 1983 | 1 197 910 080 $ US | 341 508 794 $ US |
| 1982 | 1 467 727 796 $ US | 398 358 408 $ US |
| 1981 | 1 833 987 627 $ US | 503 011 974 $ US |
| 1980 | 2 344 819 454 $ US | 501 604 575 $ US |
| 1979 | 1 594 181 556 $ US | 376 573 054 $ US |
| 1978 | 1 631 824 876 $ US | 428 365 350 $ US |
| 1977 | 1 112 781 044 $ US | 320 906 238 $ US |
| 1976 | 809 714 664 $ US | 294 604 671 $ US |
| 1975 | 846 906 750 $ US | 283 800 236 $ US |
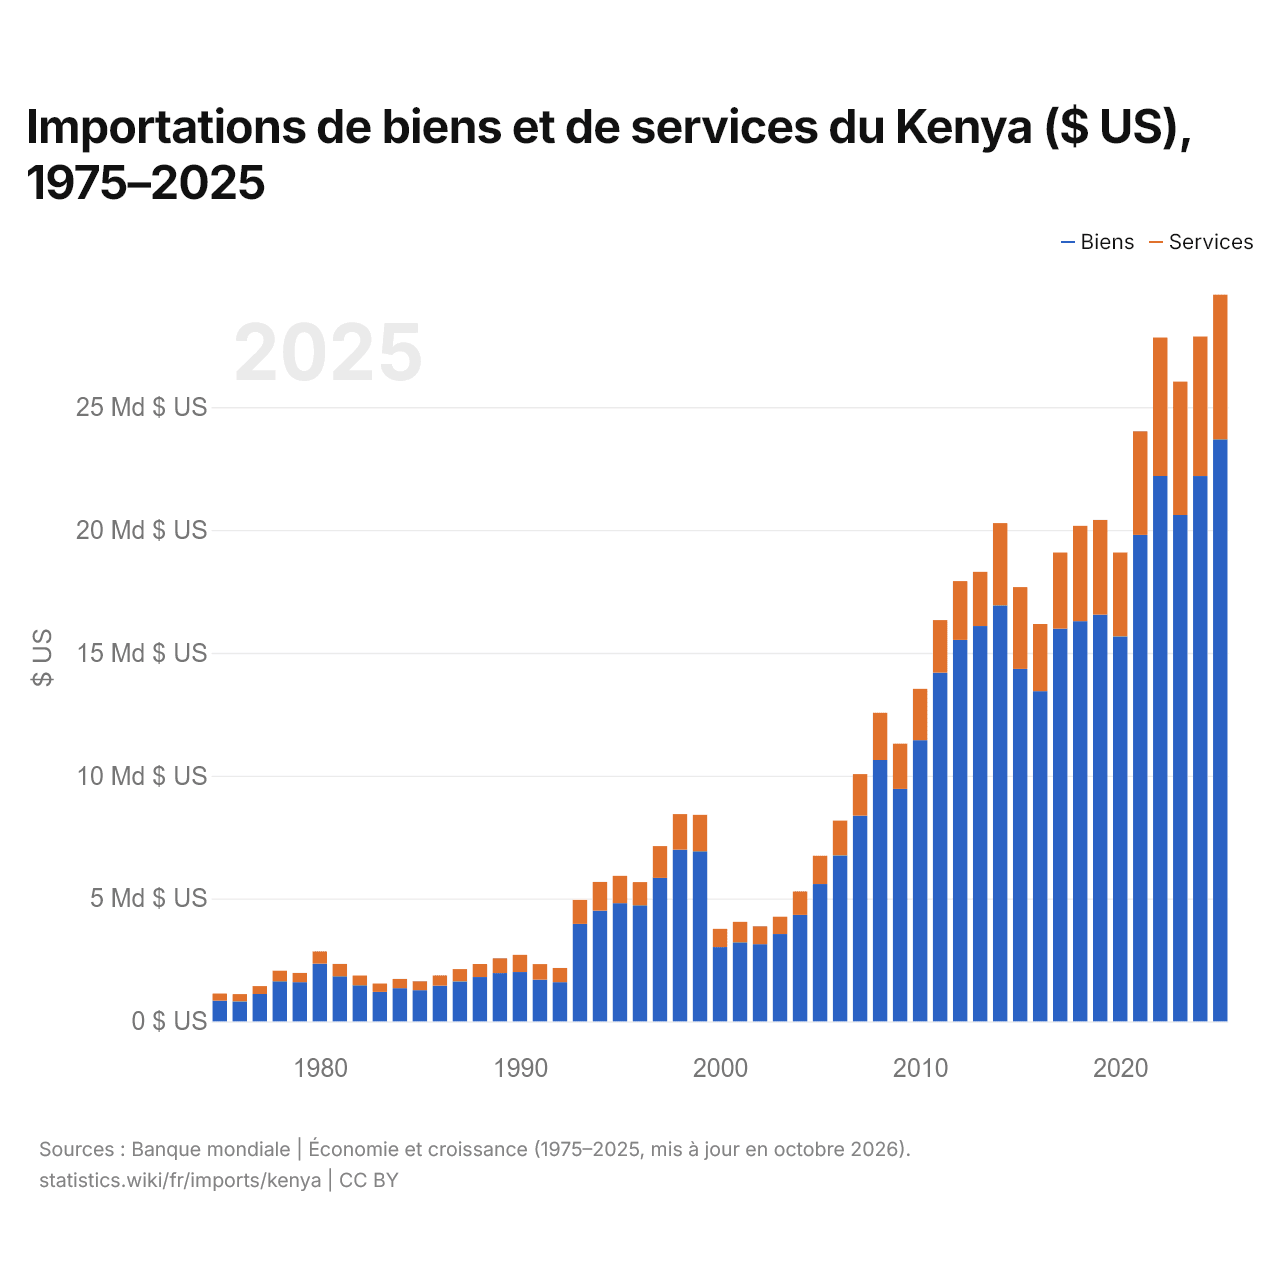
En 2025, les importations de biens du Kenya s'élevaient à 23,7 milliards de dollars et celles de services à 5,89 milliards de dollars ; les services représentaient 19,9 % du total, contre 25,1 % en 1975.
Le Kenya dans le classement mondial des importations, 2025







Importations de biens et services du Kenya, % du PIB, 1960–2025
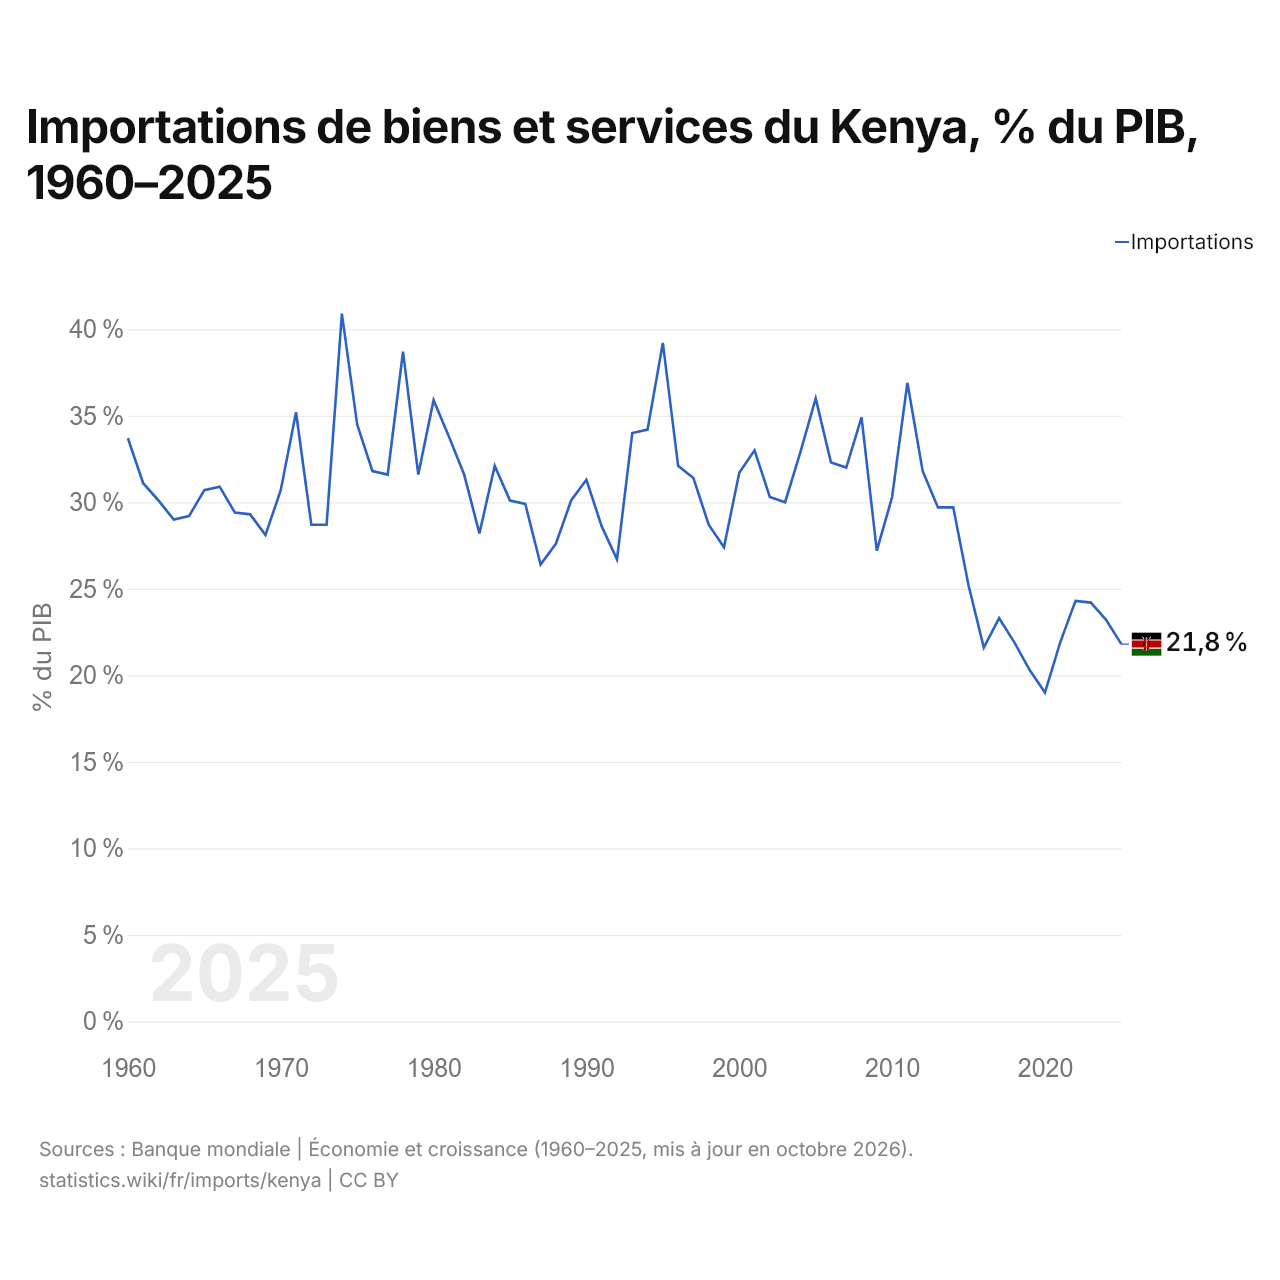
En 2025, les importations de biens et services du Kenya équivalaient à 21,8 % de son PIB, contre 33,7 % en 1960. La part la plus élevée a été de 40,9 %, en 1974.
Comparer les importations du Kenya avec celles d'autres pays
Sources :
- Banque mondiale | Économie et croissance (1960–2025, mis à jour en octobre 2026)
- TradeMap (2001–2025, mis à jour en octobre 2026)
Creative Commons Attribution (CC BY) : vous pouvez copier, partager, adapter et réutiliser ce contenu, y compris à des fins commerciales, à condition de citer statistics.wiki et d’indiquer les modifications apportées. Les sources citées ci-dessus peuvent avoir leurs propres conditions de licence.