
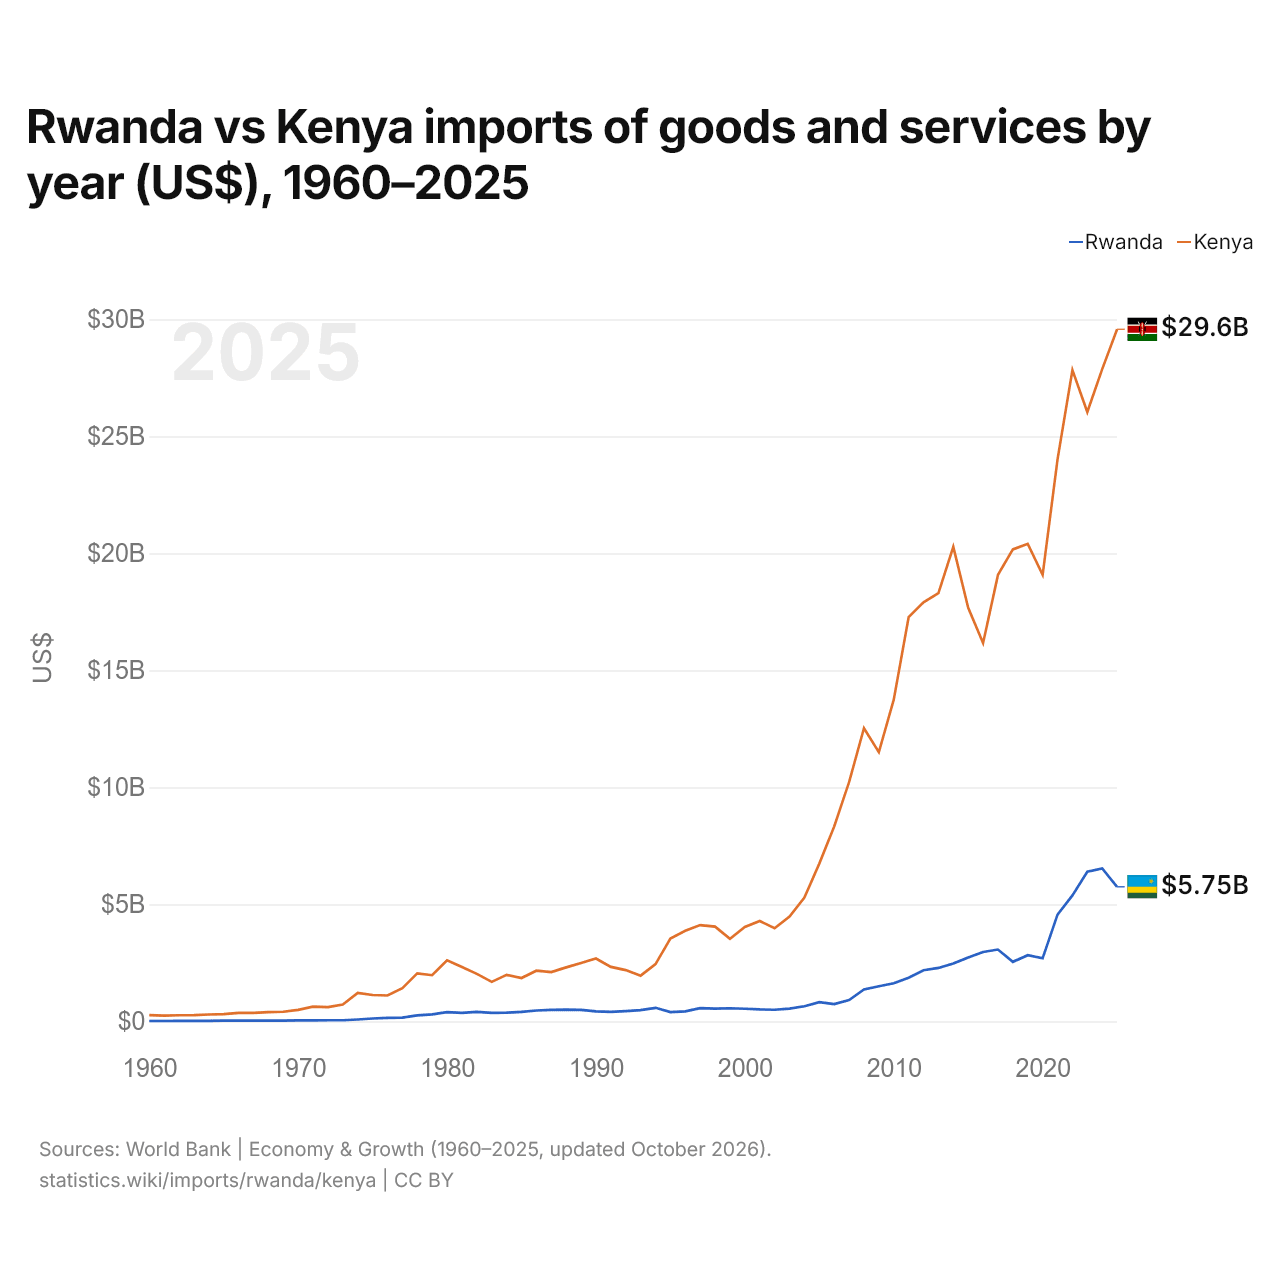
Rwanda vs Kenya : importations de biens et services par année ($ US), 1960–2025
| Année | $ US | |
|---|---|---|
 Rwanda |
 Kenya |
|
| 2025 | 5 749 666 892 $ US | 29 576 712 519 $ US |
| 2024 | 6 537 889 091 $ US | 27 873 592 864 $ US |
| 2023 | 6 395 220 829 $ US | 26 037 169 470 $ US |
| 2022 | 5 383 473 950 $ US | 27 832 040 675 $ US |
| 2021 | 4 559 111 031 $ US | 24 016 664 626 $ US |
| 2020 | 2 693 399 206 $ US | 19 082 744 157 $ US |
| 2019 | 2 825 715 263 $ US | 20 408 407 784 $ US |
| 2018 | 2 542 570 980 $ US | 20 167 352 977 $ US |
| 2017 | 3 067 749 006 $ US | 19 080 378 151 $ US |
| 2016 | 2 963 474 741 $ US | 16 171 498 982 $ US |
| 2015 | 2 732 477 445 $ US | 17 669 406 545 $ US |
| 2014 | 2 473 485 514 $ US | 20 279 300 678 $ US |
| 2013 | 2 282 582 565 $ US | 18 299 434 695 $ US |
| 2012 | 2 184 617 634 $ US | 17 910 885 230 $ US |
| 2011 | 1 862 381 967 $ US | 17 272 679 879 $ US |
| 2010 | 1 627 421 905 $ US | 13 744 246 853 $ US |
| 2009 | 1 497 497 806 $ US | 11 505 843 417 $ US |
| 2008 | 1 362 351 232 $ US | 12 529 038 544 $ US |
| 2007 | 906 838 771 $ US | 10 218 887 780 $ US |
| 2006 | 737 706 003 $ US | 8 329 126 840 $ US |
| 2005 | 816 931 472 $ US | 6 739 990 276 $ US |
| 2004 | 645 959 492 $ US | 5 290 013 363 $ US |
| 2003 | 544 440 424 $ US | 4 478 129 486 $ US |
| 2002 | 496 596 964 $ US | 3 980 437 857 $ US |
| 2001 | 509 027 986 $ US | 4 287 364 072 $ US |
| 2000 | 539 149 751 $ US | 4 030 324 232 $ US |
| 1999 | 558 586 385 $ US | 3 528 289 113 $ US |
| 1998 | 545 428 793 $ US | 4 048 921 326 $ US |
| 1997 | 561 473 990 $ US | 4 114 510 960 $ US |
| 1996 | 427 816 269 $ US | 3 868 109 121 $ US |
| 1995 | 394 568 196 $ US | 3 541 999 889 $ US |
| 1994 | 576 838 952 $ US | 2 446 514 204 $ US |
| 1993 | 477 529 641 $ US | 1 953 010 595 $ US |
| 1992 | 437 749 056 $ US | 2 189 413 218 $ US |
| 1991 | 407 725 440 $ US | 2 327 744 590 $ US |
| 1990 | 423 854 071 $ US | 2 685 575 018 $ US |
| 1989 | 491 179 726 $ US | 2 495 151 393 $ US |
| 1988 | 498 141 811 $ US | 2 306 399 998 $ US |
| 1987 | 487 833 274 $ US | 2 104 101 026 $ US |
| 1986 | 463 011 469 $ US | 2 163 994 300 $ US |
| 1985 | 403 055 472 $ US | 1 849 498 187 $ US |
| 1984 | 368 749 896 $ US | 1 984 603 543 $ US |
| 1983 | 362 861 261 $ US | 1 686 897 647 $ US |
| 1982 | 401 475 880 $ US | 2 029 695 253 $ US |
| 1981 | 361 602 521 $ US | 2 318 209 963 $ US |
| 1980 | 391 053 243 $ US | 2 608 236 154 $ US |
| 1979 | 298 152 970 $ US | 1 970 754 654 $ US |
| 1978 | 254 643 281 $ US | 2 051 910 224 $ US |
| 1977 | 155 767 696 $ US | 1 419 913 416 $ US |
| 1976 | 146 123 004 $ US | 1 103 363 095 $ US |
| 1975 | 119 568 402 $ US | 1 124 851 546 $ US |
| 1974 | 77 755 906 $ US | 1 214 639 514 $ US |
| 1973 | 46 170 266 $ US | 719 305 941 $ US |
| 1972 | 47 326 840 $ US | 605 359 758 $ US |
| 1971 | 44 429 204 $ US | 625 800 030 $ US |
| 1970 | 39 573 930 $ US | 491 679 803 $ US |
| 1969 | 32 001 722 $ US | 409 639 836 $ US |
| 1968 | 30 796 787 $ US | 396 479 841 $ US |
| 1967 | 29 051 990 $ US | 362 039 855 $ US |
| 1966 | 29 418 028 $ US | 359 519 856 $ US |
| 1965 | 29 769 045 $ US | 306 319 877 $ US |
| 1964 | 19 373 505 $ US | 291 759 883 $ US |
| 1963 | 19 137 245 $ US | 268 365 893 $ US |
| 1962 | 18 900 981 $ US | 261 519 895 $ US |
| 1961 | 14 175 736 $ US | 246 847 901 $ US |
| 1960 | 14 175 736 $ US | 266 419 907 $ US |
En 2025, les importations de biens et services du Rwanda s'élevaient à 5,75 milliards de dollars et celles du Kenya à 29,6 milliards de dollars : celles du Kenya étaient 5,1 fois plus élevées. En 1960, les importations du Kenya étaient 19 fois plus élevées : 14,2 millions de dollars pour le Rwanda et 266 millions de dollars pour le Kenya.
Les importations de biens et services du Kenya sont supérieures à celles du Rwanda chaque année depuis 1960.
Rwanda vs Kenya : chiffres des importations
|
Rwanda
|
Kenya
|
|
|---|---|---|
| Importations | 5,75 Md $US (2025) | 29,6 Md $US (2025) |
| Rang mondial | 137/174 | 83/174 |
| Part mondiale | 0,02 % | 0,09 % |
| % du PIB | 35,1 % | 21,8 % |
| Première catégorie de biens | Machines, électronique et véhicules (22,6 %, 2025) | Pétrole, gaz, minerais et autres matières premières (25,6 %, 2025) |
| Première origine des biens | Chine (23,4 %, 2025) | Chine (23,9 %, 2025) |
Comparer les importations de 2 pays au choix
Sources :
- Banque mondiale | Économie et croissance (1960–2025, mis à jour en octobre 2026)
- TradeMap (2001–2025, mis à jour en octobre 2026)
Creative Commons Attribution (CC BY) : vous pouvez copier, partager, adapter et réutiliser ce contenu, y compris à des fins commerciales, à condition de citer statistics.wiki et d’indiquer les modifications apportées. Les sources citées ci-dessus peuvent avoir leurs propres conditions de licence.