
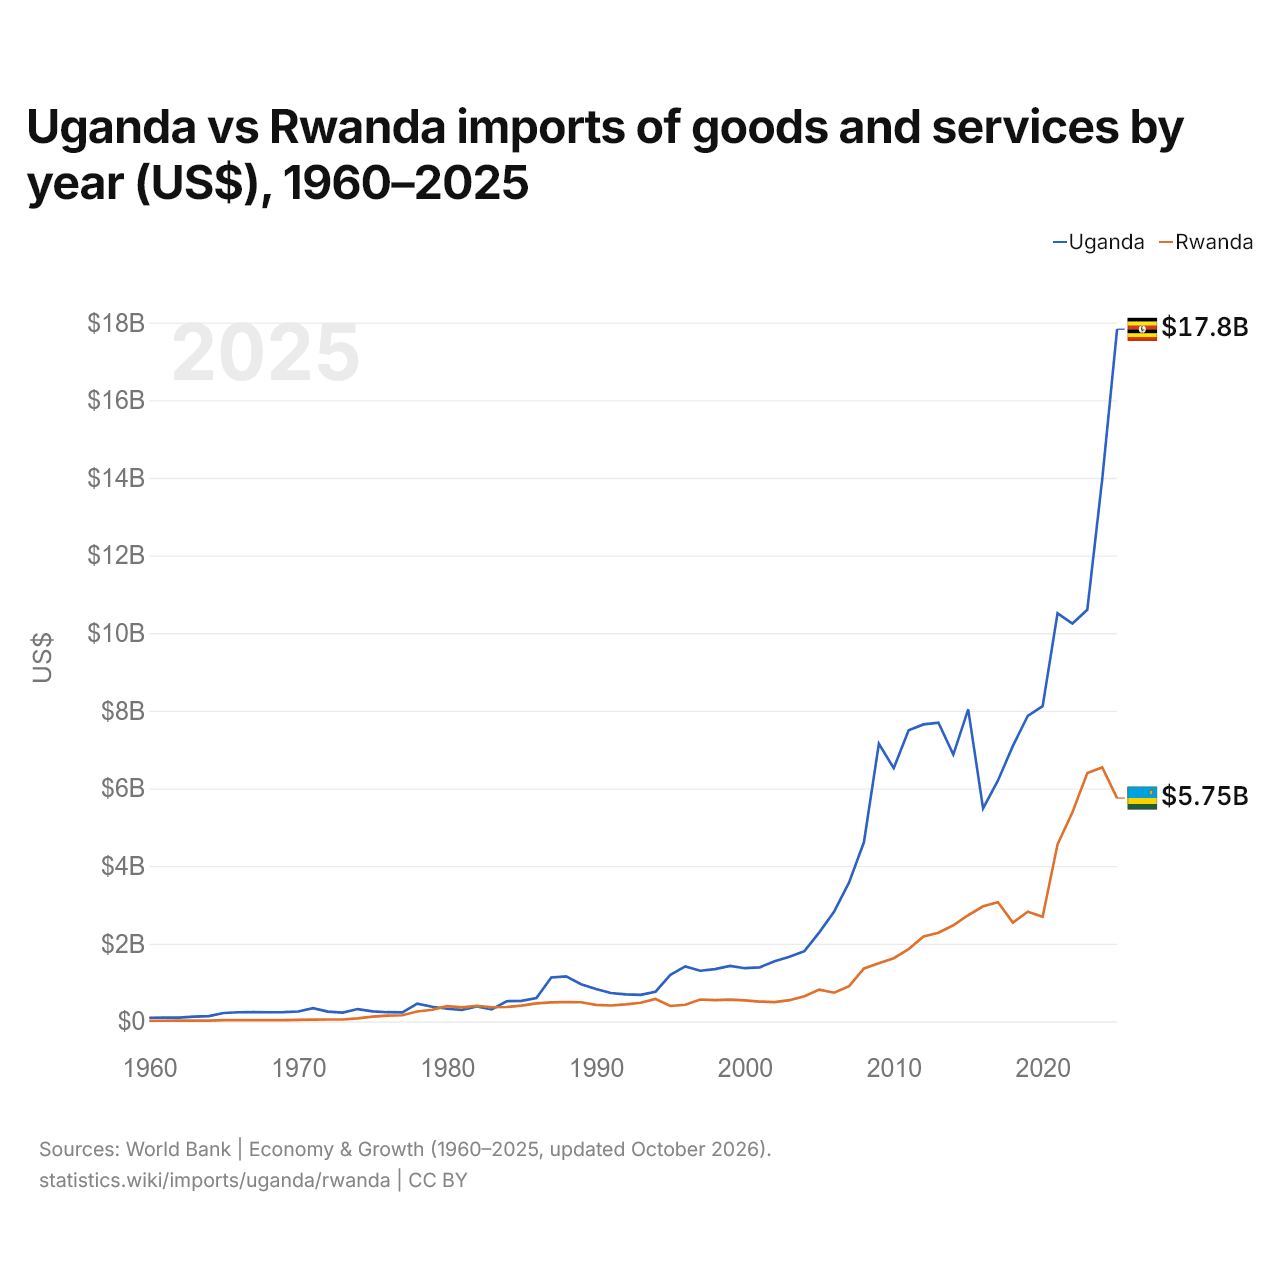
Ouganda vs Rwanda : importations de biens et services par année ($ US), 1960–2025
| Année | $ US | |
|---|---|---|
 Ouganda |
 Rwanda |
|
| 2025 | 17 826 764 688 $ US | 5 749 666 892 $ US |
| 2024 | 13 960 593 894 $ US | 6 537 889 091 $ US |
| 2023 | 10 602 364 862 $ US | 6 395 220 829 $ US |
| 2022 | 10 244 593 521 $ US | 5 383 473 950 $ US |
| 2021 | 10 510 437 146 $ US | 4 559 111 031 $ US |
| 2020 | 8 116 375 577 $ US | 2 693 399 206 $ US |
| 2019 | 7 866 761 702 $ US | 2 825 715 263 $ US |
| 2018 | 7 096 219 372 $ US | 2 542 570 980 $ US |
| 2017 | 6 202 981 526 $ US | 3 067 749 006 $ US |
| 2016 | 5 485 150 866 $ US | 2 963 474 741 $ US |
| 2015 | 8 035 899 288 $ US | 2 732 477 445 $ US |
| 2014 | 6 870 189 627 $ US | 2 473 485 514 $ US |
| 2013 | 7 690 477 050 $ US | 2 282 582 565 $ US |
| 2012 | 7 648 498 556 $ US | 2 184 617 634 $ US |
| 2011 | 7 497 355 183 $ US | 1 862 381 967 $ US |
| 2010 | 6 520 260 385 $ US | 1 627 421 905 $ US |
| 2009 | 7 148 939 024 $ US | 1 497 497 806 $ US |
| 2008 | 4 617 770 608 $ US | 1 362 351 232 $ US |
| 2007 | 3 577 000 118 $ US | 906 838 771 $ US |
| 2006 | 2 829 448 599 $ US | 737 706 003 $ US |
| 2005 | 2 292 674 584 $ US | 816 931 472 $ US |
| 2004 | 1 807 281 866 $ US | 645 959 492 $ US |
| 2003 | 1 664 868 876 $ US | 544 440 424 $ US |
| 2002 | 1 548 626 997 $ US | 496 596 964 $ US |
| 2001 | 1 390 734 599 $ US | 509 027 986 $ US |
| 2000 | 1 368 560 402 $ US | 539 149 751 $ US |
| 1999 | 1 426 046 617 $ US | 558 586 385 $ US |
| 1998 | 1 343 623 399 $ US | 545 428 793 $ US |
| 1997 | 1 303 961 977 $ US | 561 473 990 $ US |
| 1996 | 1 415 906 250 $ US | 427 816 269 $ US |
| 1995 | 1 199 003 460 $ US | 394 568 196 $ US |
| 1994 | 762 125 449 $ US | 576 838 952 $ US |
| 1993 | 682 002 410 $ US | 477 529 641 $ US |
| 1992 | 694 106 644 $ US | 437 749 056 $ US |
| 1991 | 728 713 355 $ US | 407 725 440 $ US |
| 1990 | 833 711 479 $ US | 423 854 071 $ US |
| 1989 | 954 685 692 $ US | 491 179 726 $ US |
| 1988 | 1 157 116 667 $ US | 498 141 811 $ US |
| 1987 | 1 131 228 162 $ US | 487 833 274 $ US |
| 1986 | 597 834 914 $ US | 463 011 469 $ US |
| 1985 | 528 247 561 $ US | 403 055 472 $ US |
| 1984 | 517 947 171 $ US | 368 749 896 $ US |
| 1983 | 305 666 667 $ US | 362 861 261 $ US |
| 1982 | 381 500 000 $ US | 401 475 880 $ US |
| 1981 | 295 000 000 $ US | 361 602 521 $ US |
| 1980 | 324 000 000 $ US | 391 053 243 $ US |
| 1979 | 375 000 000 $ US | 298 152 970 $ US |
| 1978 | 456 521 739 $ US | 254 643 281 $ US |
| 1977 | 229 000 000 $ US | 155 767 696 $ US |
| 1976 | 235 100 000 $ US | 146 123 004 $ US |
| 1975 | 257 555 556 $ US | 119 568 402 $ US |
| 1974 | 315 796 977 $ US | 77 755 906 $ US |
| 1973 | 223 858 657 $ US | 46 170 266 $ US |
| 1972 | 250 174 997 $ US | 47 326 840 $ US |
| 1971 | 339 493 210 $ US | 44 429 204 $ US |
| 1970 | 253 394 932 $ US | 39 573 930 $ US |
| 1969 | 237 715 246 $ US | 32 001 722 $ US |
| 1968 | 234 635 307 $ US | 30 796 787 $ US |
| 1967 | 235 895 282 $ US | 29 051 990 $ US |
| 1966 | 234 355 313 $ US | 29 418 028 $ US |
| 1965 | 215 455 691 $ US | 29 769 045 $ US |
| 1964 | 136 093 399 $ US | 19 373 505 $ US |
| 1963 | 123 298 894 $ US | 19 137 245 $ US |
| 1962 | 96 334 175 $ US | 18 900 981 $ US |
| 1961 | 95 593 893 $ US | 14 175 736 $ US |
| 1960 | 92 315 052 $ US | 14 175 736 $ US |
En 2025, les importations de biens et services de l'Ouganda s'élevaient à 17,8 milliards de dollars et celles du Rwanda à 5,75 milliards de dollars : celles de l'Ouganda étaient 3,1 fois plus élevées. En 1960, les importations de l'Ouganda étaient 6,5 fois plus élevées : 92,3 millions de dollars pour l'Ouganda et 14,2 millions de dollars pour le Rwanda.
Les importations de biens et services de l'Ouganda sont supérieures à celles du Rwanda chaque année depuis 1984.
Ouganda vs Rwanda : chiffres des importations
|
Ouganda
|
Rwanda
|
|
|---|---|---|
| Importations | 17,8 Md $US (2025) | 5,75 Md $US (2025) |
| Rang mondial | 96/174 | 137/174 |
| Part mondiale | 0,05 % | 0,02 % |
| % du PIB | 28,8 % | 35,1 % |
| Première catégorie de biens | Métaux précieux, pierres précieuses, bijoux, montres, instruments de musique et art (34 %, 2025) | Machines, électronique et véhicules (22,6 %, 2025) |
| Première origine des biens | Chine (17,7 %, 2025) | Chine (23,4 %, 2025) |
Comparer les importations de 2 pays au choix
Sources :
- Banque mondiale | Économie et croissance (1960–2025, mis à jour en octobre 2026)
- TradeMap (2001–2025, mis à jour en octobre 2026)
Creative Commons Attribution (CC BY) : vous pouvez copier, partager, adapter et réutiliser ce contenu, y compris à des fins commerciales, à condition de citer statistics.wiki et d’indiquer les modifications apportées. Les sources citées ci-dessus peuvent avoir leurs propres conditions de licence.