
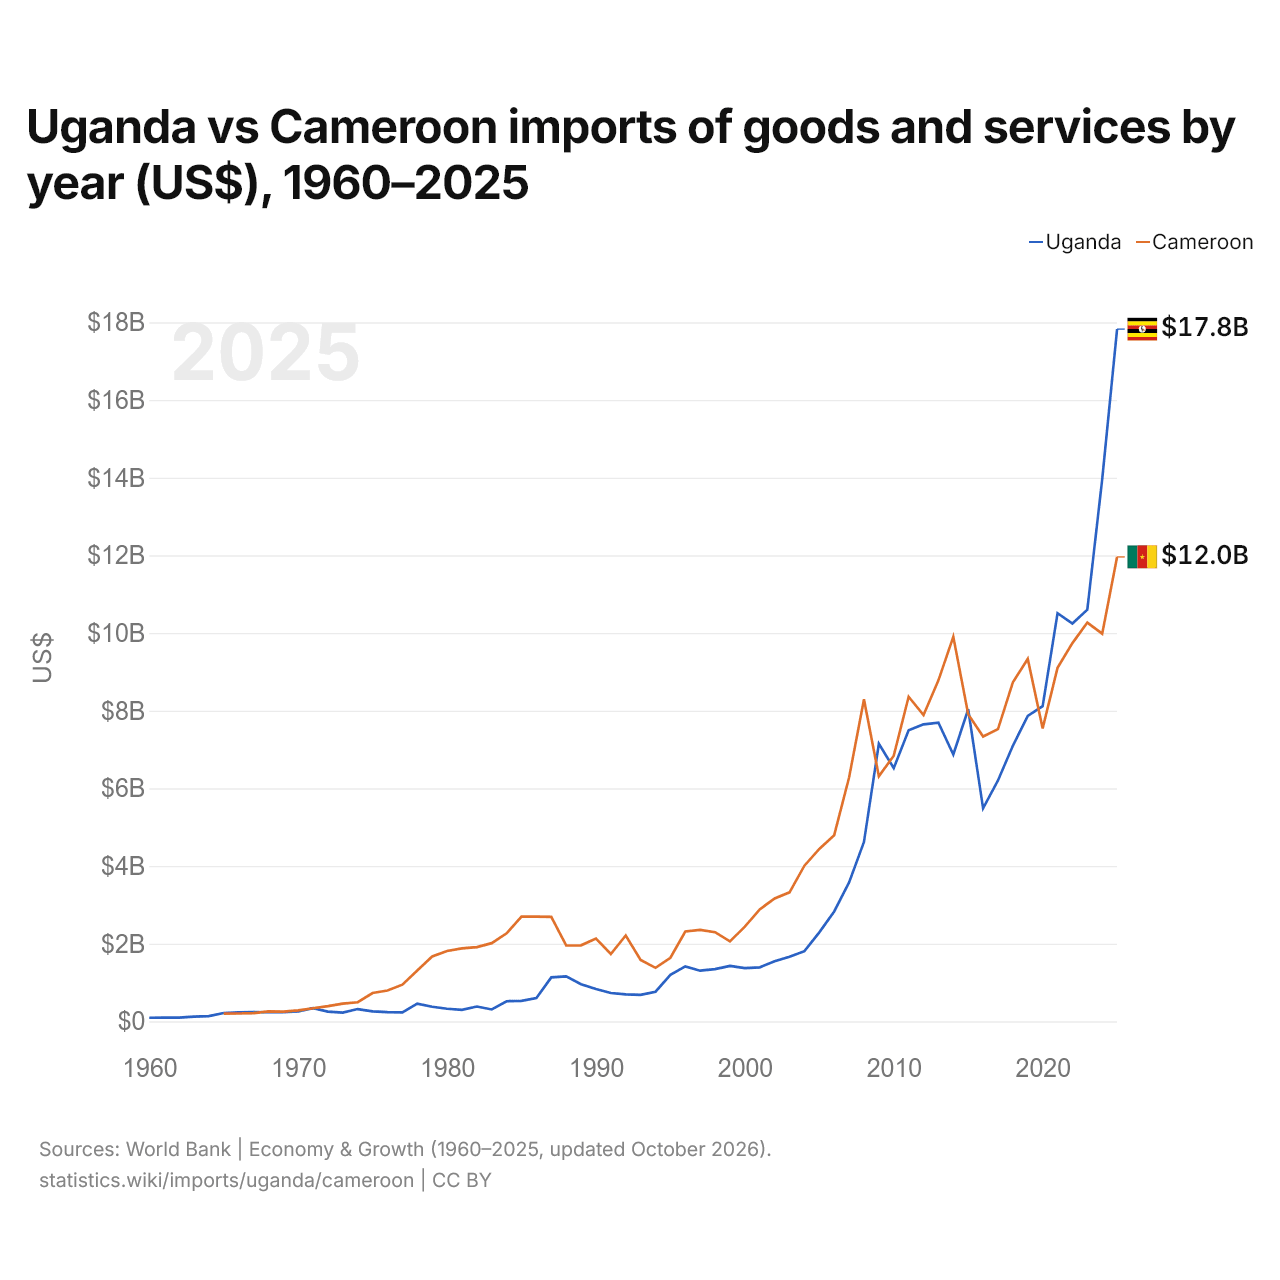
Ouganda vs Cameroun : importations de biens et services par année ($ US), 1960–2025
| Année | $ US | |
|---|---|---|
 Ouganda |
 Cameroun |
|
| 2025 | 17 826 764 688 $ US | 11 960 615 220 $ US |
| 2024 | 13 960 593 894 $ US | 9 982 430 836 $ US |
| 2023 | 10 602 364 862 $ US | 10 269 387 816 $ US |
| 2022 | 10 244 593 521 $ US | 9 740 770 348 $ US |
| 2021 | 10 510 437 146 $ US | 9 102 291 771 $ US |
| 2020 | 8 116 375 577 $ US | 7 544 311 297 $ US |
| 2019 | 7 866 761 702 $ US | 9 333 197 588 $ US |
| 2018 | 7 096 219 372 $ US | 8 730 827 317 $ US |
| 2017 | 6 202 981 526 $ US | 7 525 797 298 $ US |
| 2016 | 5 485 150 866 $ US | 7 333 874 148 $ US |
| 2015 | 8 035 899 288 $ US | 7 907 933 406 $ US |
| 2014 | 6 870 189 627 $ US | 9 905 295 758 $ US |
| 2013 | 7 690 477 050 $ US | 8 781 390 774 $ US |
| 2012 | 7 648 498 556 $ US | 7 888 349 868 $ US |
| 2011 | 7 497 355 183 $ US | 8 359 880 286 $ US |
| 2010 | 6 520 260 385 $ US | 6 841 031 832 $ US |
| 2009 | 7 148 939 024 $ US | 6 311 089 301 $ US |
| 2008 | 4 617 770 608 $ US | 8 291 276 216 $ US |
| 2007 | 3 577 000 118 $ US | 6 278 066 804 $ US |
| 2006 | 2 829 448 599 $ US | 4 793 806 221 $ US |
| 2005 | 2 292 674 584 $ US | 4 438 925 461 $ US |
| 2004 | 1 807 281 866 $ US | 4 008 132 753 $ US |
| 2003 | 1 664 868 876 $ US | 3 322 828 644 $ US |
| 2002 | 1 548 626 997 $ US | 3 165 848 310 $ US |
| 2001 | 1 390 734 599 $ US | 2 881 977 219 $ US |
| 2000 | 1 368 560 402 $ US | 2 437 829 406 $ US |
| 1999 | 1 426 046 617 $ US | 2 059 848 165 $ US |
| 1998 | 1 343 623 399 $ US | 2 295 271 124 $ US |
| 1997 | 1 303 961 977 $ US | 2 354 149 771 $ US |
| 1996 | 1 415 906 250 $ US | 2 313 348 982 $ US |
| 1995 | 1 199 003 460 $ US | 1 636 645 933 $ US |
| 1994 | 762 125 449 $ US | 1 378 107 626 $ US |
| 1993 | 682 002 410 $ US | 1 580 660 005 $ US |
| 1992 | 694 106 644 $ US | 2 211 014 453 $ US |
| 1991 | 728 713 355 $ US | 1 733 392 181 $ US |
| 1990 | 833 711 479 $ US | 2 132 071 772 $ US |
| 1989 | 954 685 692 $ US | 1 956 872 130 $ US |
| 1988 | 1 157 116 667 $ US | 1 953 074 691 $ US |
| 1987 | 1 131 228 162 $ US | 2 691 627 936 $ US |
| 1986 | 597 834 914 $ US | 2 694 449 198 $ US |
| 1985 | 528 247 561 $ US | 2 698 093 753 $ US |
| 1984 | 517 947 171 $ US | 2 266 220 105 $ US |
| 1983 | 305 666 667 $ US | 2 013 215 078 $ US |
| 1982 | 381 500 000 $ US | 1 911 383 891 $ US |
| 1981 | 295 000 000 $ US | 1 878 440 367 $ US |
| 1980 | 324 000 000 $ US | 1 810 903 419 $ US |
| 1979 | 375 000 000 $ US | 1 671 668 198 $ US |
| 1978 | 456 521 739 $ US | 1 311 288 739 $ US |
| 1977 | 229 000 000 $ US | 943 911 999 $ US |
| 1976 | 235 100 000 $ US | 793 051 293 $ US |
| 1975 | 257 555 556 $ US | 729 774 049 $ US |
| 1974 | 315 796 977 $ US | 491 889 090 $ US |
| 1973 | 223 858 657 $ US | 456 280 563 $ US |
| 1972 | 250 174 997 $ US | 390 830 241 $ US |
| 1971 | 339 493 210 $ US | 335 928 207 $ US |
| 1970 | 253 394 932 $ US | 284 005 473 $ US |
| 1969 | 237 715 246 $ US | 251 576 565 $ US |
| 1968 | 234 635 307 $ US | 257 710 417 $ US |
| 1967 | 235 895 282 $ US | 211 381 300 $ US |
| 1966 | 234 355 313 $ US | 200 668 815 $ US |
| 1965 | 215 455 691 $ US | 197 501 862 $ US |
| 1964 | 136 093 399 $ US | - |
| 1963 | 123 298 894 $ US | - |
| 1962 | 96 334 175 $ US | - |
| 1961 | 95 593 893 $ US | - |
| 1960 | 92 315 052 $ US | - |
En 2025, les importations de biens et services de l'Ouganda s'élevaient à 17,8 milliards de dollars et celles du Cameroun à 12 milliards de dollars : celles de l'Ouganda étaient supérieures de 49 %. En 1965, les importations de l'Ouganda étaient supérieures de 9,1 % : 215 millions de dollars pour l'Ouganda et 198 millions de dollars pour le Cameroun.
Les importations de biens et services de l'Ouganda sont supérieures à celles du Cameroun chaque année depuis 2020.
Ouganda vs Cameroun : chiffres des importations
|
Ouganda
|
Cameroun
|
|
|---|---|---|
| Importations | 17,8 Md $US (2025) | 12,0 Md $US (2025) |
| Rang mondial | 96/174 | 116/174 |
| Part mondiale | 0,05 % | 0,04 % |
| % du PIB | 28,8 % | 20,3 % |
| Première catégorie de biens | Métaux précieux, pierres précieuses, bijoux, montres, instruments de musique et art (34 %, 2025) | Pétrole, gaz, minerais et autres matières premières (27,3 %, 2024) |
| Première origine des biens | Chine (17,7 %, 2025) | Chine (22,2 %, 2024) |
Comparer les importations de 2 pays au choix
Sources :
- Banque mondiale | Économie et croissance (1960–2025, mis à jour en octobre 2026)
- TradeMap (2001–2025, mis à jour en octobre 2026)
Creative Commons Attribution (CC BY) : vous pouvez copier, partager, adapter et réutiliser ce contenu, y compris à des fins commerciales, à condition de citer statistics.wiki et d’indiquer les modifications apportées. Les sources citées ci-dessus peuvent avoir leurs propres conditions de licence.