
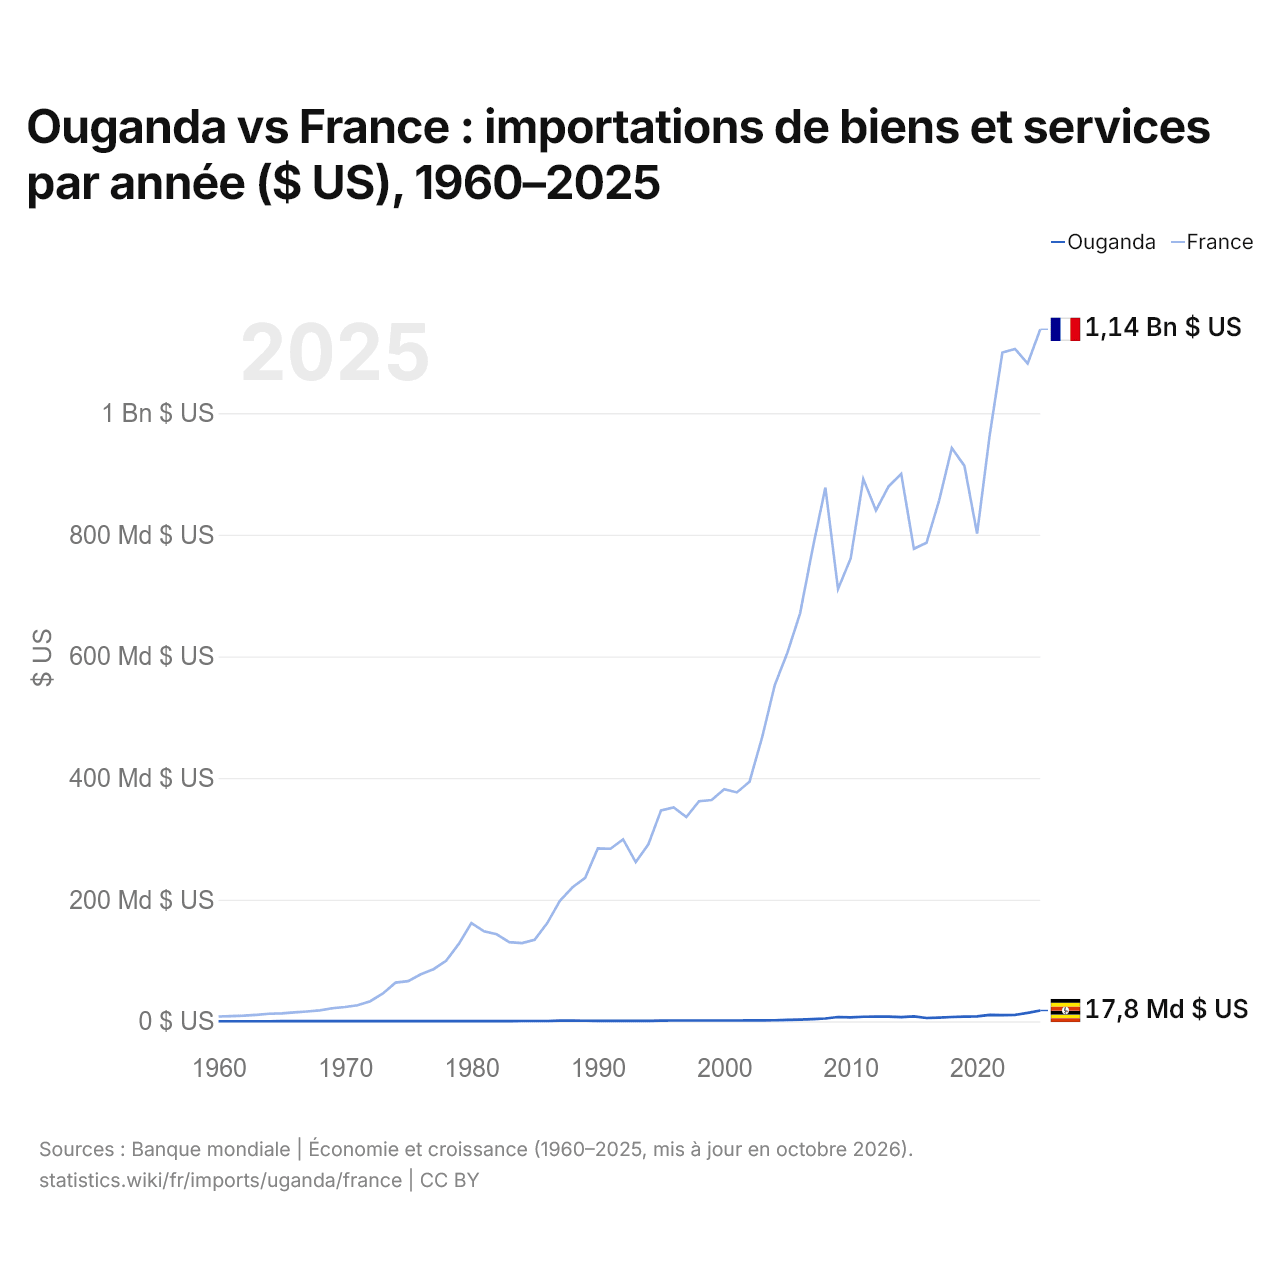
Ouganda vs France : importations de biens et services par année ($ US), 1960–2025
| Année | $ US | |
|---|---|---|
 Ouganda |
 France |
|
| 2025 | 17 826 764 688 $ US | 1 137 799 795 607 $ US |
| 2024 | 13 960 593 894 $ US | 1 081 453 951 069 $ US |
| 2023 | 10 602 364 862 $ US | 1 105 442 442 028 $ US |
| 2022 | 10 244 593 521 $ US | 1 099 664 152 806 $ US |
| 2021 | 10 510 437 146 $ US | 964 103 785 592 $ US |
| 2020 | 8 116 375 577 $ US | 801 836 174 373 $ US |
| 2019 | 7 866 761 702 $ US | 913 209 092 424 $ US |
| 2018 | 7 096 219 372 $ US | 942 517 078 079 $ US |
| 2017 | 6 202 981 526 $ US | 856 501 561 408 $ US |
| 2016 | 5 485 150 866 $ US | 786 690 099 965 $ US |
| 2015 | 8 035 899 288 $ US | 776 983 112 153 $ US |
| 2014 | 6 870 189 627 $ US | 900 072 034 980 $ US |
| 2013 | 7 690 477 050 $ US | 879 403 265 970 $ US |
| 2012 | 7 648 498 556 $ US | 839 869 181 340 $ US |
| 2011 | 7 497 355 183 $ US | 891 743 744 380 $ US |
| 2010 | 6 520 260 385 $ US | 761 083 995 458 $ US |
| 2009 | 7 148 939 024 $ US | 710 610 400 819 $ US |
| 2008 | 4 617 770 608 $ US | 877 476 980 121 $ US |
| 2007 | 3 577 000 118 $ US | 777 995 714 258 $ US |
| 2006 | 2 829 448 599 $ US | 670 822 254 333 $ US |
| 2005 | 2 292 674 584 $ US | 606 331 902 820 $ US |
| 2004 | 1 807 281 866 $ US | 553 011 604 110 $ US |
| 2003 | 1 664 868 876 $ US | 467 250 572 393 $ US |
| 2002 | 1 548 626 997 $ US | 394 028 136 002 $ US |
| 2001 | 1 390 734 599 $ US | 376 341 467 532 $ US |
| 2000 | 1 368 560 402 $ US | 381 449 581 352 $ US |
| 1999 | 1 426 046 617 $ US | 363 754 404 232 $ US |
| 1998 | 1 343 623 399 $ US | 361 782 299 311 $ US |
| 1997 | 1 303 961 977 $ US | 335 869 521 241 $ US |
| 1996 | 1 415 906 250 $ US | 351 587 382 998 $ US |
| 1995 | 1 199 003 460 $ US | 346 832 698 121 $ US |
| 1994 | 762 125 449 $ US | 291 034 380 907 $ US |
| 1993 | 682 002 410 $ US | 261 684 618 948 $ US |
| 1992 | 694 106 644 $ US | 299 027 013 631 $ US |
| 1991 | 728 713 355 $ US | 283 762 818 277 $ US |
| 1990 | 833 711 479 $ US | 284 198 409 830 $ US |
| 1989 | 954 685 692 $ US | 235 996 092 947 $ US |
| 1988 | 1 157 116 667 $ US | 220 384 539 148 $ US |
| 1987 | 1 131 228 162 $ US | 198 155 407 618 $ US |
| 1986 | 597 834 914 $ US | 161 558 386 211 $ US |
| 1985 | 528 247 561 $ US | 133 894 510 147 $ US |
| 1984 | 517 947 171 $ US | 128 606 695 189 $ US |
| 1983 | 305 666 667 $ US | 130 312 075 049 $ US |
| 1982 | 381 500 000 $ US | 143 140 932 229 $ US |
| 1981 | 295 000 000 $ US | 148 003 379 602 $ US |
| 1980 | 324 000 000 $ US | 161 433 405 775 $ US |
| 1979 | 375 000 000 $ US | 127 256 552 575 $ US |
| 1978 | 456 521 739 $ US | 99 531 104 651 $ US |
| 1977 | 229 000 000 $ US | 85 644 958 545 $ US |
| 1976 | 235 100 000 $ US | 77 268 779 022 $ US |
| 1975 | 257 555 556 $ US | 66 145 785 529 $ US |
| 1974 | 315 796 977 $ US | 63 613 611 566 $ US |
| 1973 | 223 858 657 $ US | 45 888 332 351 $ US |
| 1972 | 250 174 997 $ US | 33 141 612 484 $ US |
| 1971 | 339 493 210 $ US | 26 488 930 981 $ US |
| 1970 | 253 394 932 $ US | 23 582 378 647 $ US |
| 1969 | 237 715 246 $ US | 21 479 310 052 $ US |
| 1968 | 234 635 307 $ US | 17 932 241 725 $ US |
| 1967 | 235 895 282 $ US | 16 105 495 991 $ US |
| 1966 | 234 355 313 $ US | 14 747 626 953 $ US |
| 1965 | 215 455 691 $ US | 12 990 103 310 $ US |
| 1964 | 136 093 399 $ US | 12 529 464 175 $ US |
| 1963 | 123 298 894 $ US | 10 693 152 241 $ US |
| 1962 | 96 334 175 $ US | 9 325 584 138 $ US |
| 1961 | 95 593 893 $ US | 8 539 959 909 $ US |
| 1960 | 92 315 052 $ US | 7 955 890 214 $ US |
En 2025, les importations de biens et services de l'Ouganda s'élevaient à 17,8 milliards de dollars et celles de la France à 1,14 billion de dollars : celles de la France étaient 64 fois plus élevées. En 1960, les importations de la France étaient 86 fois plus élevées : 92,3 millions de dollars pour l'Ouganda et 7,96 milliards de dollars pour la France.
Les importations de biens et services de la France sont supérieures à celles de l'Ouganda chaque année depuis 1960.
Ouganda vs France : chiffres des importations
|
Ouganda
|
France
|
|
|---|---|---|
| Importations | 17,8 Md $US (2025) | 1,14 Bn $US (2025) |
| Rang mondial | 96/174 | 5/174 |
| Part mondiale | 0,05 % | 3,37 % |
| % du PIB | 28,8 % | 33,8 % |
| Première catégorie de biens | Métaux précieux, pierres précieuses, bijoux, montres, instruments de musique et art (34 %, 2025) | Machines, électronique et véhicules (38 %, 2025) |
| Première origine des biens | Chine (17,7 %, 2025) | Allemagne (12,6 %, 2025) |
Comparer les importations de 2 pays au choix
Sources :
- Banque mondiale | Économie et croissance (1960–2025, mis à jour en octobre 2026)
- TradeMap (2001–2025, mis à jour en octobre 2026)
Creative Commons Attribution (CC BY) : vous pouvez copier, partager, adapter et réutiliser ce contenu, y compris à des fins commerciales, à condition de citer statistics.wiki et d’indiquer les modifications apportées. Les sources citées ci-dessus peuvent avoir leurs propres conditions de licence.