
Importations de biens et services du Guyana par année ($ US)
| Année | $ US | Rang mondial |
|---|---|---|
| Importations | Rang mondial | |
| 2023 | 10 956 378 428 $ US | #117 |
| 2022 | 7 032 655 694 $ US | #128 |
| 2021 | 6 588 017 179 $ US | #124 |
| 2020 | 3 946 396 485 $ US | #131 |
| 2019 | 5 266 914 636 $ US | #129 |
| 2018 | 3 277 604 877 $ US | #145 |
| 2017 | 2 001 176 695 $ US | #155 |
| 2016 | 1 854 541 252 $ US | #153 |
| 2015 | 1 776 124 246 $ US | #154 |
| 2014 | 2 217 483 369 $ US | #153 |
| 2013 | 2 377 597 119 $ US | #151 |
| 2012 | 2 523 076 274 $ US | #149 |
| 2011 | 2 204 274 434 $ US | #148 |
| 2010 | 1 762 917 632 $ US | #146 |
| 2009 | 1 451 819 160 $ US | #149 |
| 2008 | 1 648 805 567 $ US | #148 |
| 2007 | 1 255 393 000 $ US | #147 |
| 2006 | 1 055 174 000 $ US | #146 |
| 2005 | 905 124 013 $ US | #146 |
| 2004 | 828 486 192 $ US | #143 |
| 2003 | 739 243 068 $ US | #142 |
| 2002 | 758 240 189 $ US | #139 |
| 2001 | 759 902 022 $ US | #135 |
| 2000 | 788 833 546 $ US | #131 |
| 1999 | 726 372 197 $ US | #133 |
| 1998 | 774 285 040 $ US | #133 |
| 1997 | 820 130 868 $ US | #130 |
| 1996 | 766 890 763 $ US | #131 |
| 1995 | 696 946 830 $ US | #131 |
| 1994 | 633 450 374 $ US | #122 |
| 1993 | 595 085 541 $ US | #122 |
| 1992 | 557 463 260 $ US | #119 |
| 1991 | 419 266 355 $ US | #122 |
| 1990 | 316 708 851 $ US | #125 |
| 1989 | 279 264 717 $ US | #113 |
| 1988 | 281 100 010 $ US | #109 |
| 1987 | 321 836 724 $ US | #108 |
| 1986 | 268 534 884 $ US | #109 |
| 1985 | 280 627 907 $ US | #105 |
| 1984 | 224 763 158 $ US | #107 |
| 1983 | 316 000 000 $ US | #103 |
| 1982 | 337 800 000 $ US | #104 |
| 1981 | 526 500 036 $ US | #97 |
| 1980 | 564 840 000 $ US | #93 |
| 1979 | 367 200 000 $ US | #94 |
| 1978 | 319 960 000 $ US | #92 |
| 1977 | 354 360 000 $ US | #87 |
| 1976 | 413 560 000 $ US | #80 |
| 1975 | 370 625 000 $ US | #80 |
| 1974 | 288 227 273 $ US | #80 |
| 1973 | 211 523 810 $ US | #80 |
| 1972 | 167 714 286 $ US | #78 |
| 1971 | 154 250 000 $ US | #78 |
| 1970 | 152 650 000 $ US | #77 |
| 1969 | 138 200 000 $ US | - |
| 1968 | 126 700 000 $ US | - |
| 1967 | 149 588 235 $ US | - |
| 1966 | 137 588 235 $ US | - |
| 1965 | 122 941 176 $ US | - |
| 1964 | 104 241 406 $ US | - |
| 1963 | 81 083 131 $ US | - |
| 1962 | 87 499 781 $ US | - |
| 1961 | 98 466 421 $ US | - |
| 1960 | 96 949 758 $ US | - |
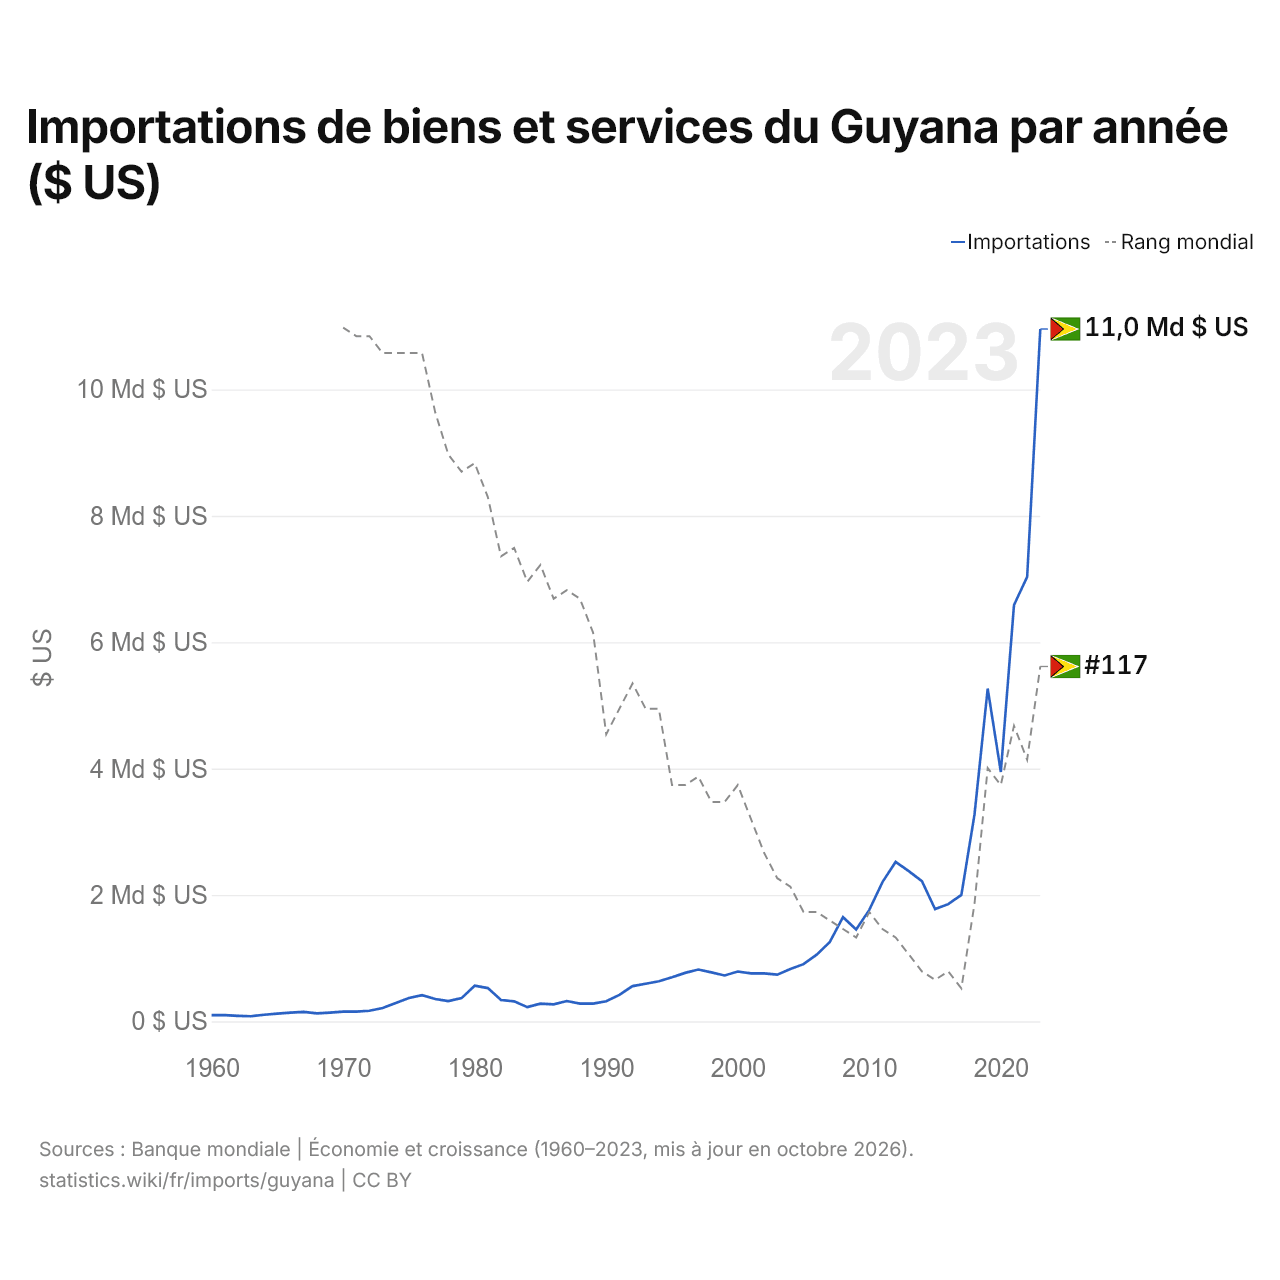
Les importations de biens et services du Guyana s'élèvent à 11 milliards de dollars (2023), contre 96,9 millions de dollars en 1960. Le minimum a été de 81,1 millions de dollars, en 1963. Elles se classent au 117e rang mondial, en hausse par rapport au 128e rang l'année précédente. Leur meilleur rang a été le 77e, occupé pour la dernière fois en 1970.
Les importations de biens et services du Guyana sont les 18es plus élevées de 26 pays situés en Amérique latine. Les exportations du Guyana dépassent ses importations de 2,78 milliards de dollars, soit un excédent commercial (2023). Le commerce du Guyana, exportations et importations réunies, équivaut à 146,0 % de son PIB (2023), au 22e rang mondial.
Importations de biens du Guyana par catégorie, 2025
Importations de biens, 2025: 9,87 Md $US
En 2025, la première catégorie des importations de biens du Guyana était « machines, électronique et véhicules », avec 58,2 %, suivie de « pétrole, gaz, minerais et autres matières premières », avec 14,2 %.
Origines des importations de biens du Guyana : les 10 premières, 2025
| Rang | Pays | Importations de biens | Part | |
|---|---|---|---|---|
| 1 |
 Singapour |
2,59 Md $US | 26,3 % | |
| 2 |
 États-Unis |
2,44 Md $US | 24,8 % | |
| 3 |
 Chine |
1,28 Md $US | 13 % | |
| 4 |
 Trinité-et-Tobago |
373 M $US | 3,78 % | |
| 5 |
 Royaume-Uni |
345 M $US | 3,5 % | |
| 6 |
 Japon |
324 M $US | 3,28 % | |
| 7 |
 Brésil |
298 M $US | 3,02 % | |
| 8 |
 Mexique |
240 M $US | 2,43 % | |
| 9 |
 Italie |
153 M $US | 1,55 % | |
| 10 |
 Turquie |
139 M $US | 1,41 % | |
| Autres partenaires et non précisés | 1,68 Md $US | 17 % |
Importations de biens du Guyana depuis ses 5 principales origines ($ US), 2001–2025
| Année | $ US | ||||
|---|---|---|---|---|---|
| Singapour | États-Unis | Chine | Trinité-et-Tobago | Royaume-Uni | |
| 2025 | 2 590 641 000 $ US | 2 444 865 000 $ US | 1 282 155 000 $ US | 372 962 000 $ US | 345 267 000 $ US |
| 2024 | 62 744 000 $ US | 2 557 714 000 $ US | 925 997 000 $ US | 404 973 000 $ US | 282 694 000 $ US |
| 2023 | 1 769 828 000 $ US | 1 176 575 000 $ US | 602 406 000 $ US | 1 126 739 000 $ US | 189 789 000 $ US |
| 2022 | 9 276 000 $ US | 1 224 848 000 $ US | 338 732 000 $ US | 421 007 000 $ US | 92 383 000 $ US |
| 2021 | 1 663 536 000 $ US | 822 085 000 $ US | 278 310 000 $ US | 332 284 000 $ US | 74 907 000 $ US |
| 2020 | 8 605 000 $ US | 814 392 000 $ US | 212 626 000 $ US | 282 368 000 $ US | 69 587 000 $ US |
| 2019 | 982 117 000 $ US | 1 807 190 000 $ US | 223 322 000 $ US | 900 817 000 $ US | 360 049 000 $ US |
| 2018 | 5 289 000 $ US | 2 268 510 000 $ US | 219 118 000 $ US | 723 589 000 $ US | 34 961 000 $ US |
| 2017 | 6 455 000 $ US | 461 716 000 $ US | 156 795 000 $ US | 483 403 000 $ US | 36 796 000 $ US |
| 2016 | 4 854 000 $ US | 386 188 000 $ US | 119 318 000 $ US | 412 269 000 $ US | 39 614 000 $ US |
| 2015 | 2 201 000 $ US | 429 520 000 $ US | 113 559 000 $ US | 329 332 000 $ US | 40 214 000 $ US |
| 2014 | 2 606 000 $ US | 427 204 000 $ US | 133 767 000 $ US | 375 818 000 $ US | 48 716 000 $ US |
| 2013 | 2 251 000 $ US | 405 730 000 $ US | 165 416 000 $ US | 360 474 000 $ US | 45 766 000 $ US |
| 2012 | 2 001 000 $ US | 457 796 000 $ US | 194 081 000 $ US | 288 777 000 $ US | 48 805 000 $ US |
| 2011 | 2 732 000 $ US | 445 089 000 $ US | 106 551 000 $ US | 375 680 000 $ US | 62 106 000 $ US |
| 2010 | 3 256 000 $ US | 401 613 000 $ US | 83 898 000 $ US | 319 057 000 $ US | 58 809 000 $ US |
| 2009 | 14 879 000 $ US | 342 139 000 $ US | 59 227 000 $ US | 236 700 000 $ US | 41 708 000 $ US |
| 2008 | 4 350 000 $ US | 376 680 000 $ US | 76 228 000 $ US | 297 098 000 $ US | 49 967 000 $ US |
| 2007 | 6 234 000 $ US | 258 572 000 $ US | 87 367 000 $ US | 258 266 000 $ US | 62 342 000 $ US |
| 2006 | 12 650 000 $ US | 242 683 000 $ US | 45 747 000 $ US | 299 938 000 $ US | 39 910 000 $ US |
| 2005 | 2 315 000 $ US | 242 234 000 $ US | 31 523 000 $ US | 259 205 000 $ US | 32 613 000 $ US |
| 2004 | 1 188 000 $ US | 197 134 000 $ US | 25 546 000 $ US | 176 256 000 $ US | 30 277 000 $ US |
| 2003 | 664 000 $ US | 177 617 000 $ US | 19 121 000 $ US | 149 073 000 $ US | 35 759 000 $ US |
| 2002 | 672 000 $ US | 195 978 000 $ US | 19 225 000 $ US | 88 704 000 $ US | 42 600 000 $ US |
| 2001 | 533 000 $ US | 221 292 000 $ US | 15 877 000 $ US | 88 794 000 $ US | 35 915 000 $ US |
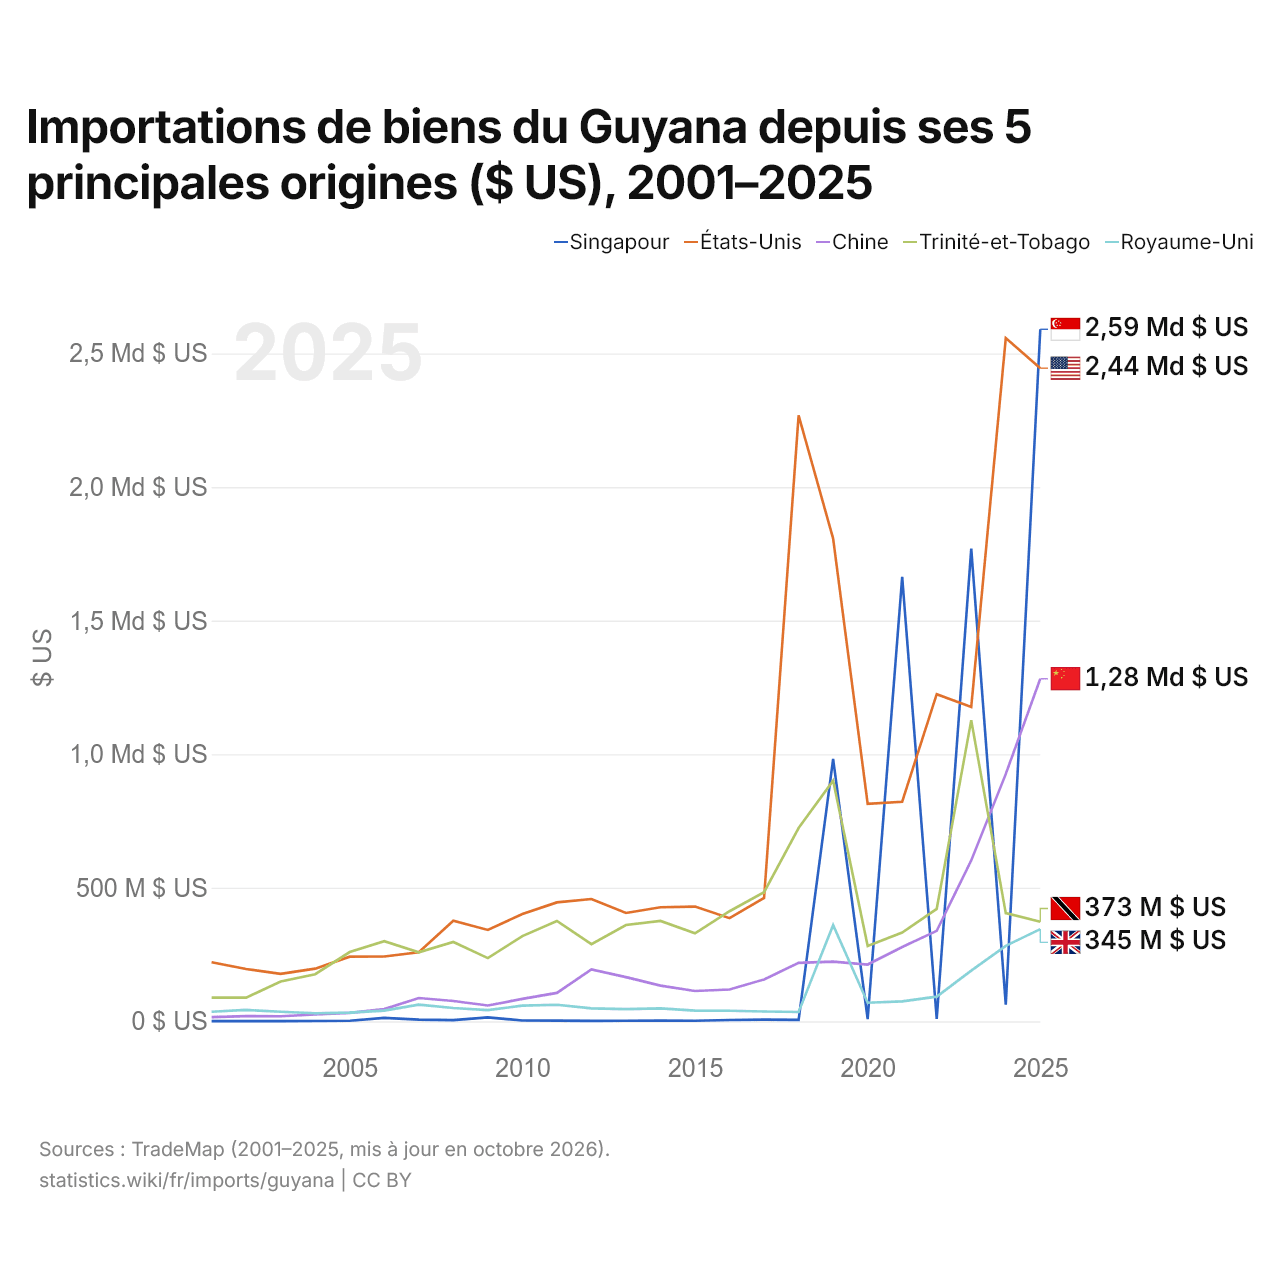
En 2025, les importations de biens s'élevaient à 2,59 milliards de dollars en provenance de Singapour, 2,44 milliards de dollars en provenance des États-Unis, 1,28 milliard de dollars en provenance de la Chine, 373 millions de dollars en provenance de Trinité-et-Tobago et 345 millions de dollars en provenance du Royaume-Uni. Le changement le plus récent dans leur ordre remonte à 2025, quand les importations du Guyana en provenance de Singapour ont dépassé celles en provenance des États-Unis.
Importations de biens et de services du Guyana ($ US)
| Année | $ US | |
|---|---|---|
| Biens | Services | |
| 2023 | 6 002 816 014 $ US | 4 953 562 413 $ US |
| 2022 | 3 204 442 397 $ US | 3 828 213 297 $ US |
| 2021 | 3 701 396 473 $ US | 2 886 620 706 $ US |
| 2020 | 1 954 481 655 $ US | 1 991 914 830 $ US |
| 2019 | 3 609 799 987 $ US | 1 657 114 649 $ US |
| 2018 | 2 087 342 319 $ US | 1 190 262 558 $ US |
| 2017 | 1 426 643 322 $ US | 574 533 373 $ US |
| 2016 | 1 340 624 974 $ US | 513 916 278 $ US |
| 2015 | 1 352 814 227 $ US | 423 310 019 $ US |
| 2014 | 1 791 268 270 $ US | 426 215 099 $ US |
| 2013 | 1 874 905 179 $ US | 502 691 940 $ US |
| 2012 | 1 996 735 110 $ US | 526 341 164 $ US |
| 2011 | 1 770 522 516 $ US | 433 751 918 $ US |
| 2010 | 1 419 078 768 $ US | 343 838 864 $ US |
| 2009 | 1 179 398 355 $ US | 272 420 805 $ US |
| 2008 | 1 323 612 479 $ US | 325 193 088 $ US |
| 2007 | 982 854 000 $ US | 272 539 000 $ US |
| 2006 | 809 757 000 $ US | 245 417 000 $ US |
| 2005 | 717 080 000 $ US | 200 891 000 $ US |
| 2004 | 591 787 600 $ US | 207 588 000 $ US |
| 2003 | 525 300 000 $ US | 172 100 000 $ US |
| 2002 | 513 900 000 $ US | 195 800 000 $ US |
| 2001 | 541 000 000 $ US | 192 400 000 $ US |
| 2000 | 550 100 000 $ US | 193 200 000 $ US |
| 1999 | 518 700 000 $ US | 178 100 000 $ US |
| 1998 | 552 900 000 $ US | 173 900 000 $ US |
| 1997 | 590 700 000 $ US | 165 000 000 $ US |
| 1996 | 549 800 000 $ US | 153 800 000 $ US |
| 1995 | 536 500 000 $ US | 171 830 000 $ US |
| 1994 | 504 000 000 $ US | 160 870 000 $ US |
| 1993 | 483 800 000 $ US | 148 100 000 $ US |
| 1992 | 442 700 000 $ US | 139 820 000 $ US |
| 1991 | - | - |
| 1990 | - | - |
| 1989 | - | - |
| 1988 | - | - |
| 1987 | - | - |
| 1986 | - | - |
| 1985 | 209 085 211 $ US | 104 025 184 $ US |
| 1984 | 201 640 493 $ US | 99 045 518 $ US |
| 1983 | 225 733 333 $ US | 98 133 333 $ US |
| 1982 | 254 166 667 $ US | 94 466 667 $ US |
| 1981 | 399 644 445 $ US | 98 880 000 $ US |
| 1980 | 386 431 373 $ US | 107 333 333 $ US |
| 1979 | 288 784 314 $ US | 71 372 549 $ US |
| 1978 | 253 490 196 $ US | 60 078 431 $ US |
| 1977 | 286 705 882 $ US | 60 745 098 $ US |
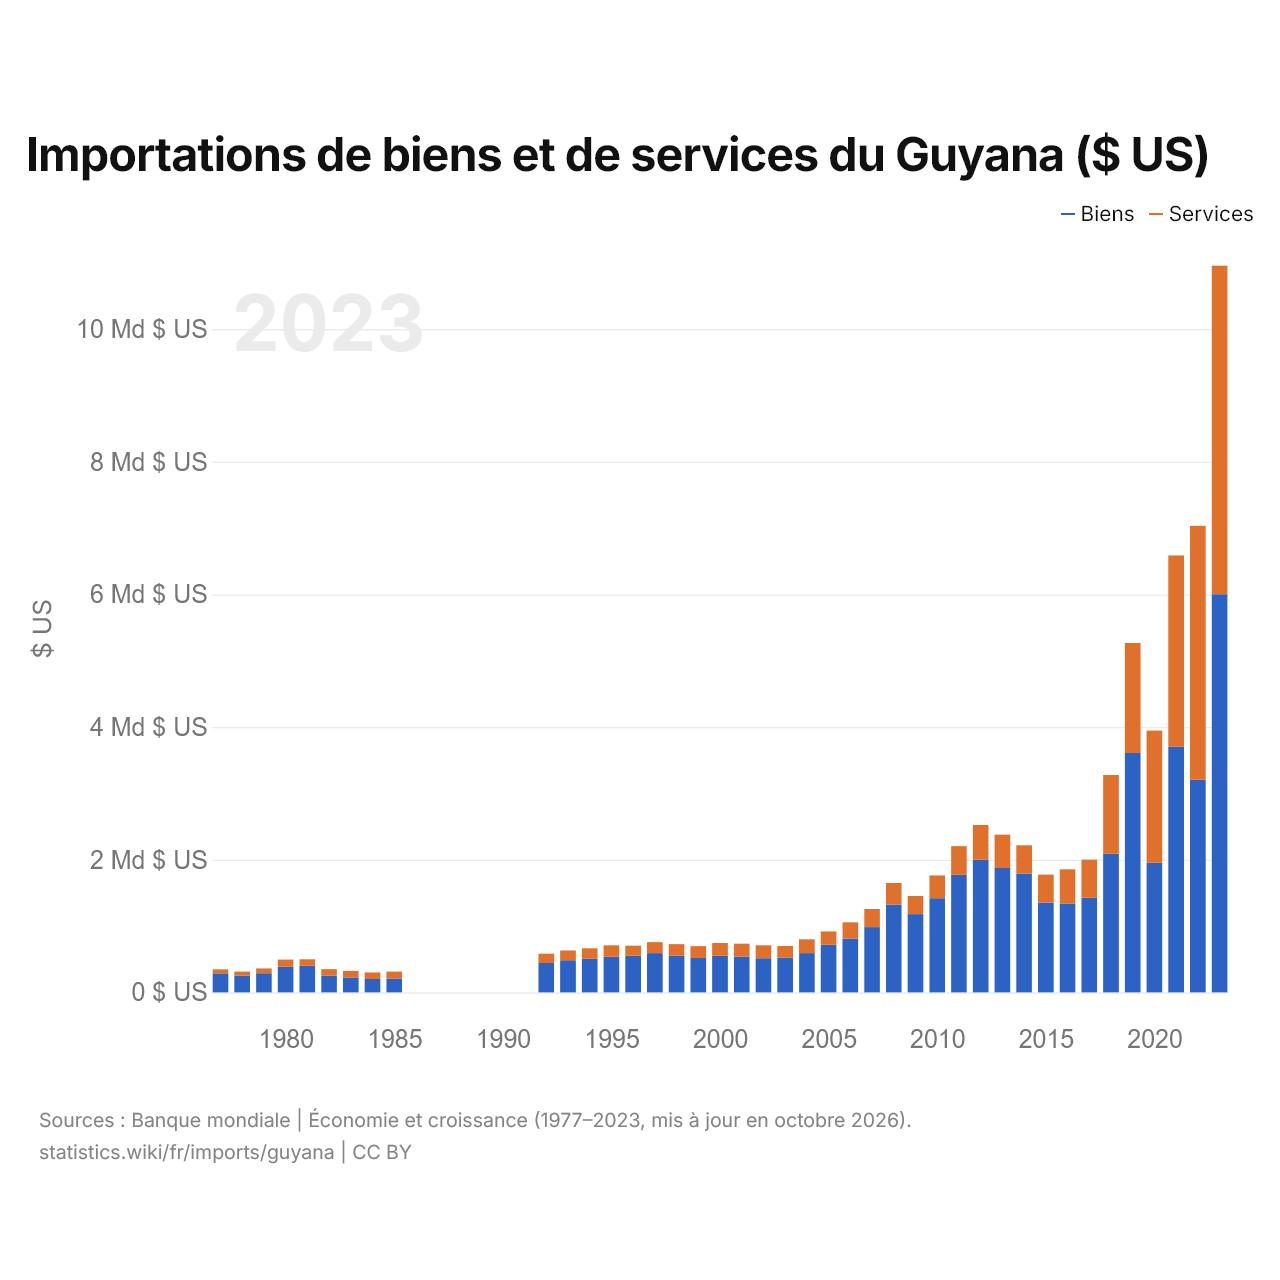
Les importations de biens du Guyana s'élèvent à 6 milliards de dollars (2023) et celles de services à 4,95 milliards de dollars ; les services représentent 45,2 % du total, contre 17,5 % en 1977.
Le Guyana dans le classement mondial des importations
| Rang | Pays | Importations | Part mondiale | |
|---|---|---|---|---|
| 114 |
 Maurice |
12,1 Md $US (2025) | 0,04 % | |
| 115 |
 Afghanistan |
12,1 Md $US (2024) | 0,04 % | |
| 116 |
 Cameroun |
12,0 Md $US (2025) | 0,04 % | |
| 117 |
 Guyana |
11,0 Md $US | 0,04 % | |
| 118 |
 Venezuela |
10,1 Md $US (2025) | 0,03 % | |
| 119 |
 Zimbabwe |
9,74 Md $US (2024) | 0,03 % | |
| 120 |
 Namibie |
9,64 Md $US (2025) | 0,03 % |
Importations de biens et services du Guyana, % du PIB
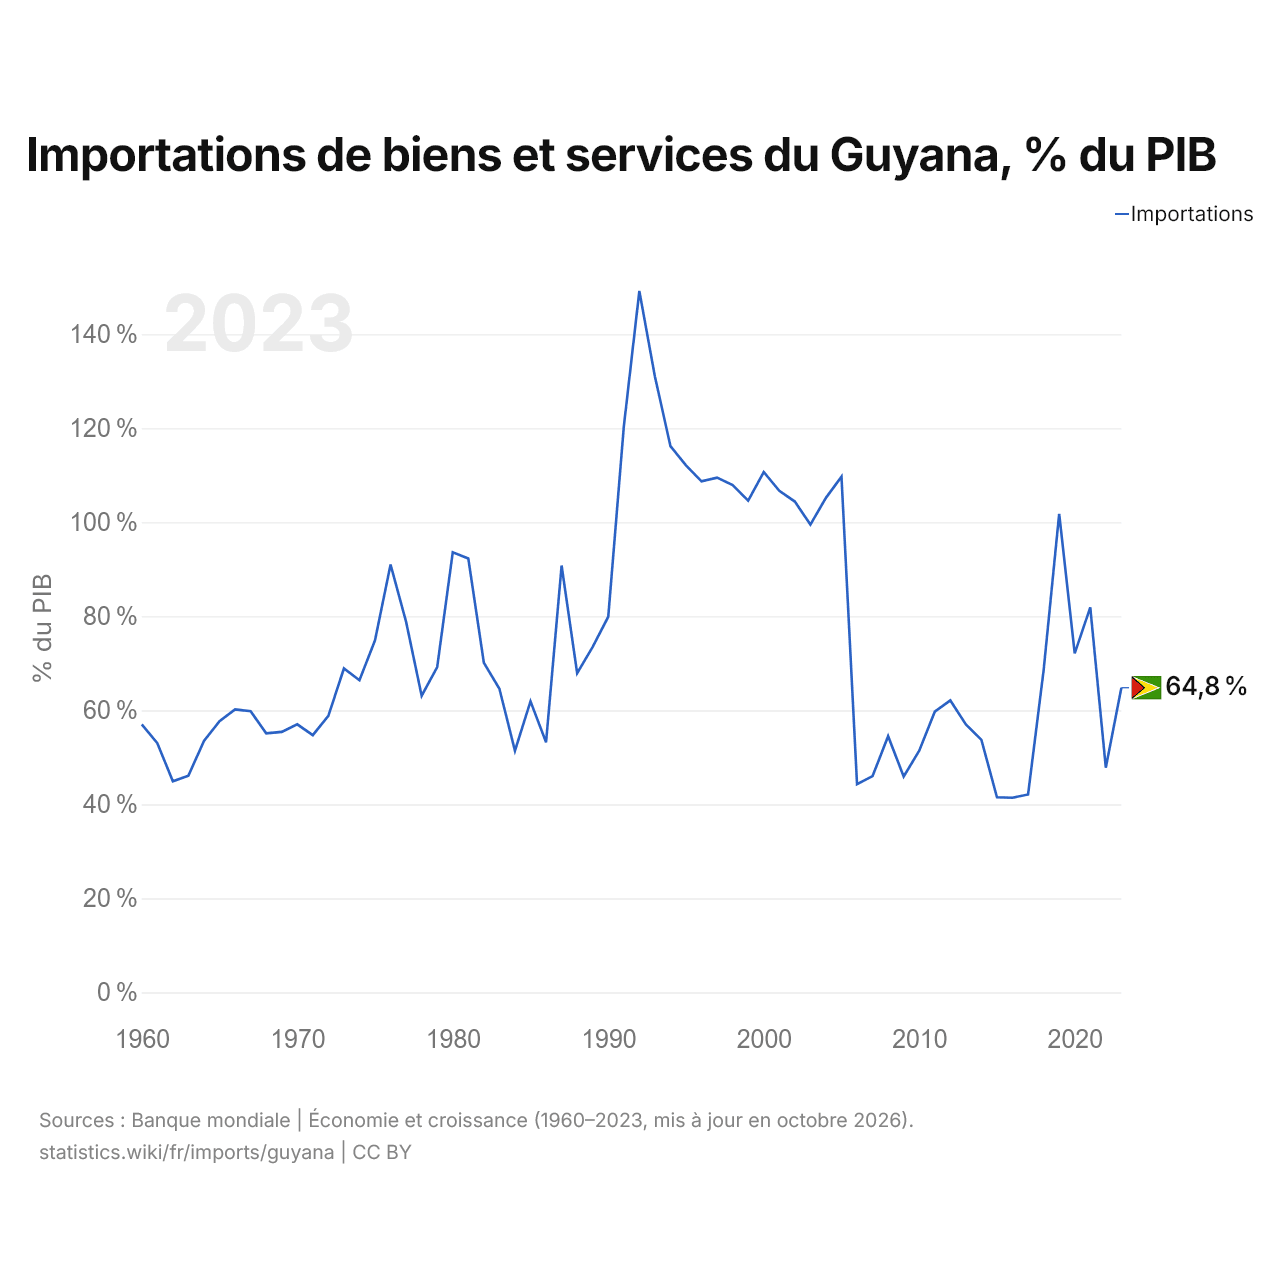
Les importations de biens et services du Guyana équivalent à 64,8 % de son PIB (2023), contre 57,0 % en 1960. La part la plus élevée a été de 149,2 %, en 1992.
Comparer les importations du Guyana avec celles d'autres pays
Sources :
- Banque mondiale | Économie et croissance (1960–2025, mis à jour en octobre 2026)
- TradeMap (2001–2025, mis à jour en octobre 2026)
Creative Commons Attribution (CC BY) : vous pouvez copier, partager, adapter et réutiliser ce contenu, y compris à des fins commerciales, à condition de citer statistics.wiki et d’indiquer les modifications apportées. Les sources citées ci-dessus peuvent avoir leurs propres conditions de licence.