
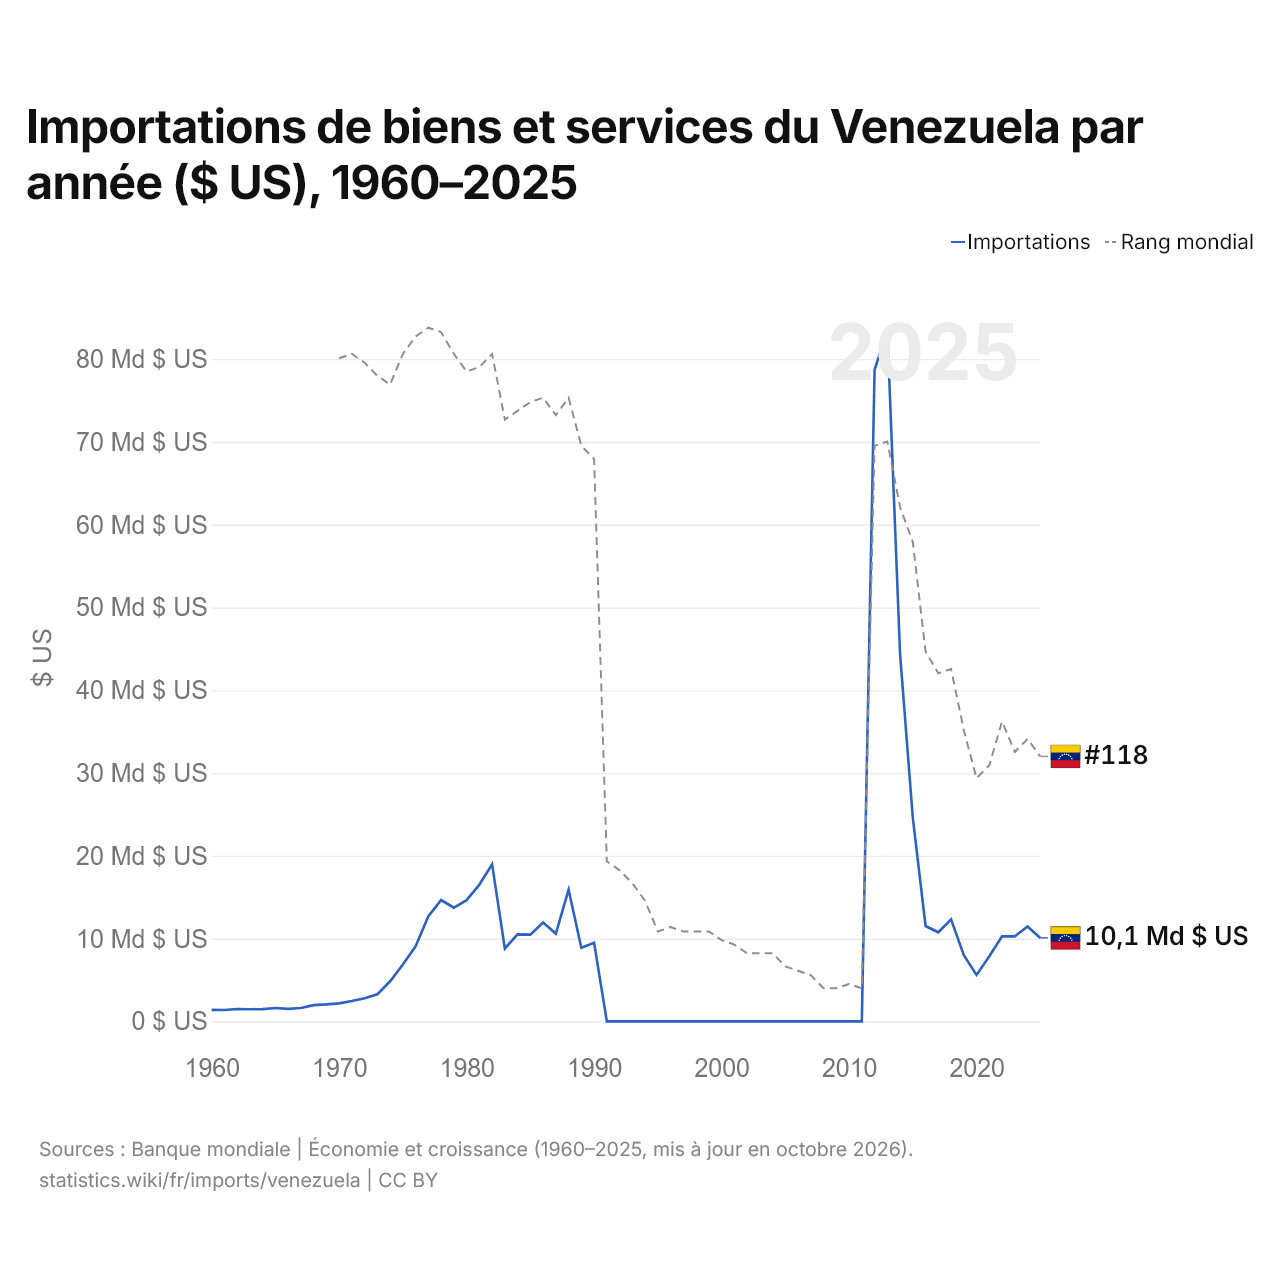
Importations de biens et services du Venezuela par année ($ US), 1960–2025
| Année | $ US | Rang mondial |
|---|---|---|
| Importations | Rang mondial | |
| 2025 | 10 074 121 350 $ US | #118 |
| 2024 | 11 456 619 839 $ US | #114 |
| 2023 | 10 266 483 009 $ US | #117 |
| 2022 | 10 280 104 687 $ US | #110 |
| 2021 | 7 856 090 324 $ US | #120 |
| 2020 | 5 605 400 729 $ US | #123 |
| 2019 | 7 982 721 069 $ US | #112 |
| 2018 | 12 326 332 795 $ US | #98 |
| 2017 | 10 756 686 685 $ US | #99 |
| 2016 | 11 515 036 488 $ US | #94 |
| 2015 | 24 577 347 081 $ US | #69 |
| 2014 | 44 352 366 681 $ US | #61 |
| 2013 | 83 592 737 983 $ US | #46 |
| 2012 | 78 668 126 778 $ US | #47 |
| 2011 | 0 $ US | #171 |
| 2010 | 0 $ US | #170 |
| 2009 | 0 $ US | #171 |
| 2008 | 0 $ US | #171 |
| 2007 | 0 $ US | #168 |
| 2006 | 0 $ US | #167 |
| 2005 | 0 $ US | #166 |
| 2004 | 0 $ US | #163 |
| 2003 | 0 $ US | #163 |
| 2002 | 0 $ US | #163 |
| 2001 | 0 $ US | #161 |
| 2000 | 0 $ US | #160 |
| 1999 | 0 $ US | #158 |
| 1998 | 0 $ US | #158 |
| 1997 | 0 $ US | #158 |
| 1996 | 0 $ US | #157 |
| 1995 | 0 $ US | #158 |
| 1994 | 0 $ US | #151 |
| 1993 | 0 $ US | #147 |
| 1992 | 0 $ US | #144 |
| 1991 | 0 $ US | #142 |
| 1990 | 9 493 861 738 $ US | #50 |
| 1989 | 8 884 312 275 $ US | #47 |
| 1988 | 15 910 262 069 $ US | #36 |
| 1987 | 10 598 117 241 $ US | #40 |
| 1986 | 11 927 109 278 $ US | #36 |
| 1985 | 10 466 520 000 $ US | #37 |
| 1984 | 10 508 123 515 $ US | #39 |
| 1983 | 8 799 209 302 $ US | #41 |
| 1982 | 18 971 186 047 $ US | #26 |
| 1981 | 16 518 209 302 $ US | #29 |
| 1980 | 14 627 837 209 $ US | #30 |
| 1979 | 13 727 674 419 $ US | #26 |
| 1978 | 14 650 348 837 $ US | #21 |
| 1977 | 12 692 465 116 $ US | #20 |
| 1976 | 9 069 255 814 $ US | #22 |
| 1975 | 6 863 837 209 $ US | #26 |
| 1974 | 4 838 441 860 $ US | #33 |
| 1973 | 3 263 139 535 $ US | #31 |
| 1972 | 2 793 090 909 $ US | #28 |
| 1971 | 2 463 204 545 $ US | #26 |
| 1970 | 2 171 911 111 $ US | #27 |
| 1969 | 2 042 888 889 $ US | - |
| 1968 | 1 956 888 889 $ US | - |
| 1967 | 1 612 822 222 $ US | - |
| 1966 | 1 505 288 889 $ US | - |
| 1965 | 1 612 822 222 $ US | - |
| 1964 | 1 473 655 172 $ US | - |
| 1963 | 1 458 861 579 $ US | - |
| 1962 | 1 489 969 152 $ US | - |
| 1961 | 1 366 605 304 $ US | - |
| 1960 | 1 390 889 415 $ US | - |
En 2025, les importations de biens et services du Venezuela s'élevaient à 10,1 milliards de dollars, contre 1,39 milliard de dollars en 1960. Le maximum a été de 83,6 milliards de dollars, en 2013. Elles se classaient au 118e rang mondial, en baisse par rapport au 114e rang en 2024. Leur meilleur rang a été le 20e, occupé pour la dernière fois en 1977.
En 2025, les importations de biens et services du Venezuela étaient les 19es plus élevées de 26 pays situés en Amérique latine. En 2025, les exportations du Venezuela dépassaient ses importations de 4,78 milliards de dollars, soit un excédent commercial. Le commerce du Venezuela, exportations et importations réunies, équivalait à 25,0 % de son PIB en 2025, au 172e rang mondial.
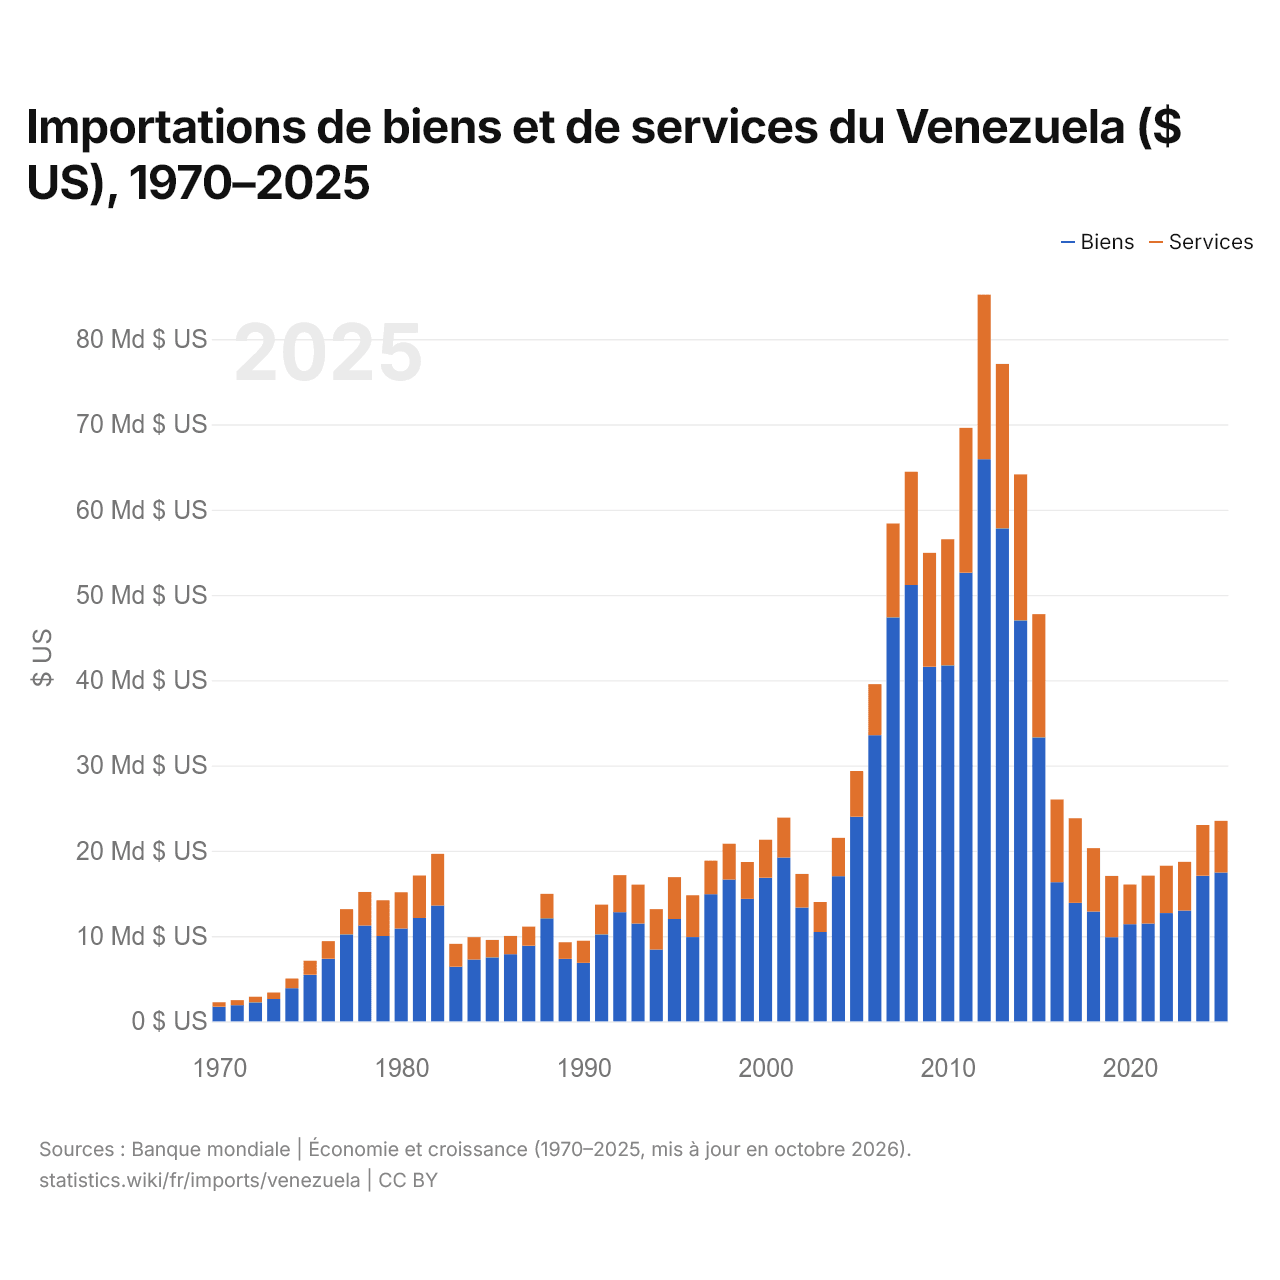
Importations de biens et de services du Venezuela ($ US), 1970–2025
| Année | $ US | |
|---|---|---|
| Biens | Services | |
| 2025 | 17 446 000 000 $ US | 6 059 000 000 $ US |
| 2024 | 17 070 000 000 $ US | 5 954 000 000 $ US |
| 2023 | 12 998 000 000 $ US | 5 703 000 000 $ US |
| 2022 | 12 693 000 000 $ US | 5 552 000 000 $ US |
| 2021 | 11 469 000 000 $ US | 5 617 000 000 $ US |
| 2020 | 11 392 000 000 $ US | 4 647 000 000 $ US |
| 2019 | 9 873 000 000 $ US | 7 177 000 000 $ US |
| 2018 | 12 875 000 000 $ US | 7 431 000 000 $ US |
| 2017 | 13 886 000 000 $ US | 9 931 000 000 $ US |
| 2016 | 16 323 000 000 $ US | 9 691 000 000 $ US |
| 2015 | 33 298 000 000 $ US | 14 445 000 000 $ US |
| 2014 | 47 011 000 000 $ US | 17 123 000 000 $ US |
| 2013 | 57 804 000 000 $ US | 19 283 000 000 $ US |
| 2012 | 65 910 000 000 $ US | 19 298 000 000 $ US |
| 2011 | 52 609 000 000 $ US | 16 979 000 000 $ US |
| 2010 | 41 742 000 000 $ US | 14 792 000 000 $ US |
| 2009 | 41 584 000 000 $ US | 13 348 000 000 $ US |
| 2008 | 51 169 000 000 $ US | 13 273 000 000 $ US |
| 2007 | 47 368 000 000 $ US | 11 008 000 000 $ US |
| 2006 | 33 547 000 000 $ US | 5 990 000 000 $ US |
| 2005 | 24 002 000 000 $ US | 5 345 000 000 $ US |
| 2004 | 17 013 000 000 $ US | 4 505 000 000 $ US |
| 2003 | 10 475 000 000 $ US | 3 520 000 000 $ US |
| 2002 | 13 352 000 000 $ US | 3 930 000 000 $ US |
| 2001 | 19 203 000 000 $ US | 4 689 000 000 $ US |
| 2000 | 16 837 000 000 $ US | 4 463 000 000 $ US |
| 1999 | 14 358 000 000 $ US | 4 325 000 000 $ US |
| 1998 | 16 622 000 000 $ US | 4 205 000 000 $ US |
| 1997 | 14 900 000 000 $ US | 3 939 000 000 $ US |
| 1996 | 9 881 000 000 $ US | 4 898 000 000 $ US |
| 1995 | 12 007 000 000 $ US | 4 898 000 000 $ US |
| 1994 | 8 424 000 000 $ US | 4 728 000 000 $ US |
| 1993 | 11 460 000 000 $ US | 4 569 000 000 $ US |
| 1992 | 12 807 000 000 $ US | 4 336 000 000 $ US |
| 1991 | 10 195 000 000 $ US | 3 495 000 000 $ US |
| 1990 | 6 862 000 000 $ US | 2 589 000 000 $ US |
| 1989 | 7 333 000 000 $ US | 1 943 000 000 $ US |
| 1988 | 12 080 000 000 $ US | 2 863 000 000 $ US |
| 1987 | 8 870 000 000 $ US | 2 238 000 000 $ US |
| 1986 | 7 866 000 000 $ US | 2 148 000 000 $ US |
| 1985 | 7 501 000 000 $ US | 2 043 000 000 $ US |
| 1984 | 7 246 000 000 $ US | 2 632 000 000 $ US |
| 1983 | 6 409 000 000 $ US | 2 681 000 000 $ US |
| 1982 | 13 584 000 000 $ US | 6 050 000 000 $ US |
| 1981 | 12 123 000 000 $ US | 4 980 000 000 $ US |
| 1980 | 10 877 000 000 $ US | 4 253 000 000 $ US |
| 1979 | 10 004 000 000 $ US | 4 195 000 000 $ US |
| 1978 | 11 234 000 000 $ US | 3 935 000 000 $ US |
| 1977 | 10 194 000 000 $ US | 2 955 000 000 $ US |
| 1976 | 7 337 000 000 $ US | 2 068 000 000 $ US |
| 1975 | 5 462 000 000 $ US | 1 646 000 000 $ US |
| 1974 | 3 876 000 000 $ US | 1 143 000 000 $ US |
| 1973 | 2 626 000 000 $ US | 748 000 000 $ US |
| 1972 | 2 222 000 000 $ US | 665 000 000 $ US |
| 1971 | 1 896 000 000 $ US | 594 000 000 $ US |
| 1970 | 1 713 000 000 $ US | 525 000 000 $ US |
En 2025, les importations de biens du Venezuela s'élevaient à 17,4 milliards de dollars et celles de services à 6,06 milliards de dollars ; les services représentaient 25,8 % du total, contre 23,5 % en 1970.
Le Venezuela dans le classement mondial des importations, 2025







Importations de biens et services du Venezuela, % du PIB, 1960–2025
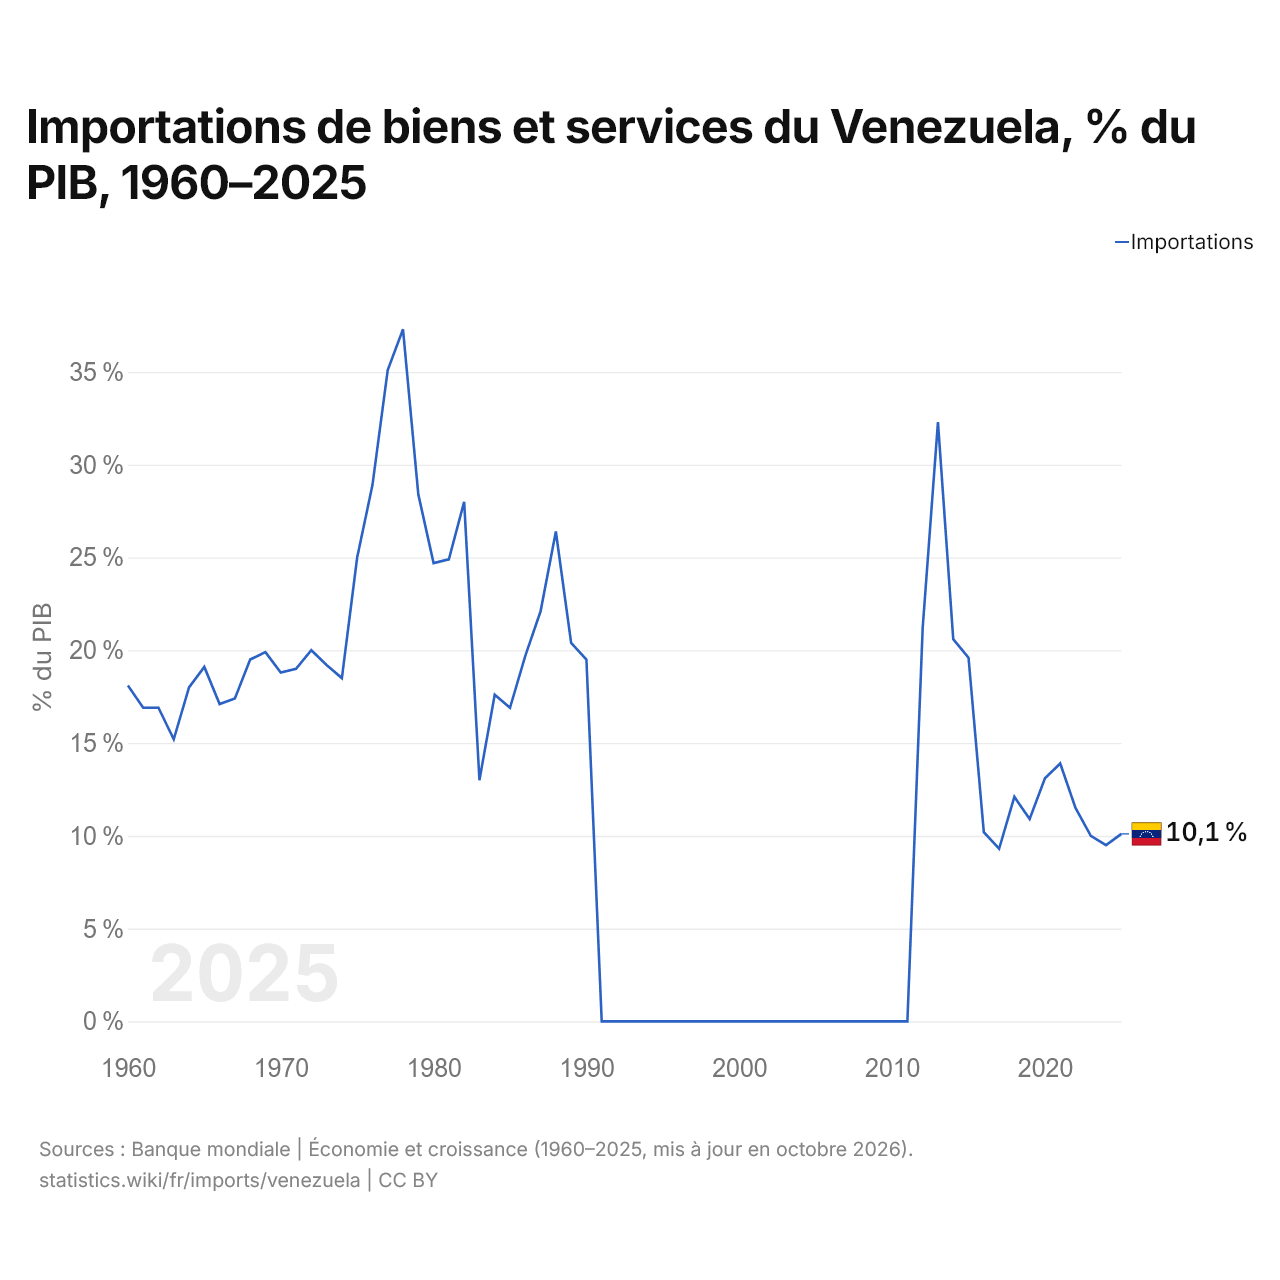
En 2025, les importations de biens et services du Venezuela équivalaient à 10,1 % de son PIB, contre 18,1 % en 1960. La part la plus élevée a été de 37,3 %, en 1978.
Comparer les importations du Venezuela avec celles d'autres pays
Sources :
- Banque mondiale | Économie et croissance (1960–2025, mis à jour en octobre 2026)
- TradeMap (2013, mis à jour en octobre 2026)
Creative Commons Attribution (CC BY) : vous pouvez copier, partager, adapter et réutiliser ce contenu, y compris à des fins commerciales, à condition de citer statistics.wiki et d’indiquer les modifications apportées. Les sources citées ci-dessus peuvent avoir leurs propres conditions de licence.