
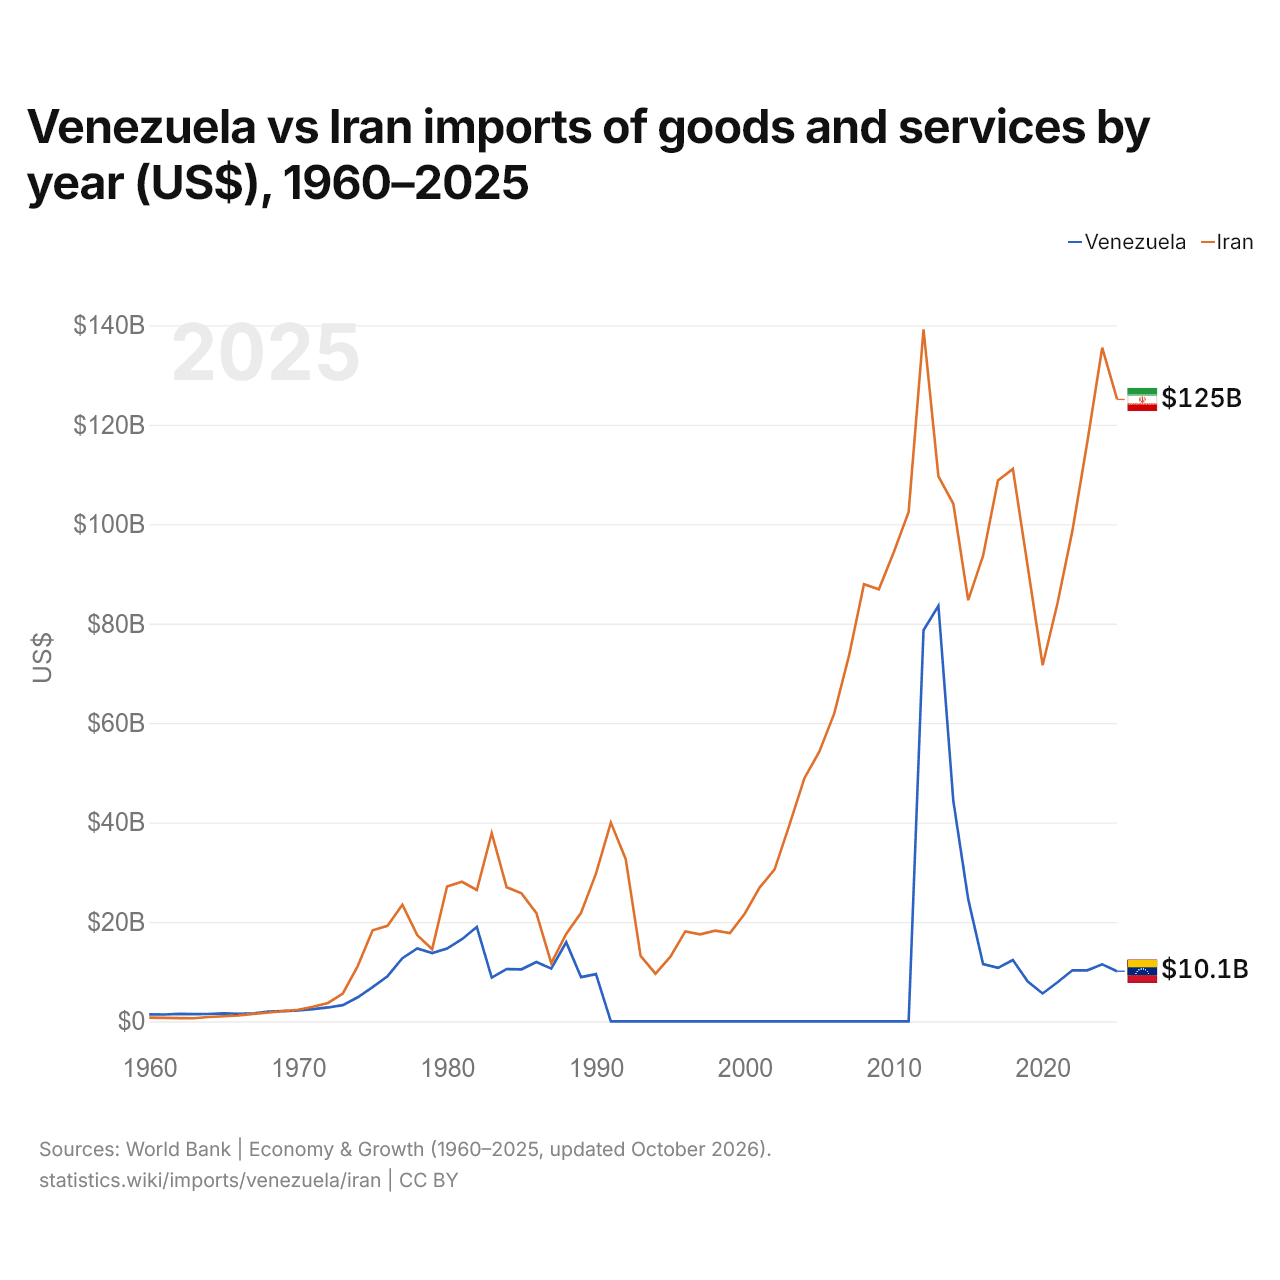
Venezuela vs Iran : importations de biens et services par année ($ US), 1960–2025
1x
| Année | $ US | |
|---|---|---|
 Venezuela |
 Iran |
|
| 2025 | 10 074 121 350 $ US | 125 082 704 286 $ US |
| 2024 | 11 456 619 839 $ US | 135 497 500 556 $ US |
| 2023 | 10 266 483 009 $ US | 116 536 624 174 $ US |
| 2022 | 10 280 104 687 $ US | 98 698 959 865 $ US |
| 2021 | 7 856 090 324 $ US | 84 130 836 516 $ US |
| 2020 | 5 605 400 729 $ US | 71 621 658 126 $ US |
| 2019 | 7 982 721 069 $ US | 91 441 131 367 $ US |
| 2018 | 12 326 332 795 $ US | 111 113 616 112 $ US |
| 2017 | 10 756 686 685 $ US | 108 797 238 836 $ US |
| 2016 | 11 515 036 488 $ US | 93 653 399 160 $ US |
| 2015 | 24 577 347 081 $ US | 84 709 856 958 $ US |
| 2014 | 44 352 366 681 $ US | 104 109 992 191 $ US |
| 2013 | 83 592 737 983 $ US | 109 606 636 051 $ US |
| 2012 | 78 668 126 778 $ US | 139 198 634 095 $ US |
| 2011 | 0 $ US | 102 452 976 011 $ US |
| 2010 | 0 $ US | 94 350 200 000 $ US |
| 2009 | 0 $ US | 86 903 100 000 $ US |
| 2008 | 0 $ US | 87 923 600 000 $ US |
| 2007 | 0 $ US | 73 597 500 000 $ US |
| 2006 | 0 $ US | 61 880 856 748 $ US |
| 2005 | 0 $ US | 54 239 627 796 $ US |
| 2004 | 0 $ US | 48 904 300 000 $ US |
| 2003 | 0 $ US | 39 575 353 988 $ US |
| 2002 | 0 $ US | 30 560 192 008 $ US |
| 2001 | 0 $ US | 26 939 208 541 $ US |
| 2000 | 0 $ US | 21 688 407 084 $ US |
| 1999 | 0 $ US | 17 752 833 900 $ US |
| 1998 | 0 $ US | 18 245 137 477 $ US |
| 1997 | 0 $ US | 17 511 229 164 $ US |
| 1996 | 0 $ US | 18 092 098 185 $ US |
| 1995 | 0 $ US | 12 985 745 384 $ US |
| 1994 | 0 $ US | 9 571 397 629 $ US |
| 1993 | 0 $ US | 13 150 789 257 $ US |
| 1992 | 0 $ US | 32 617 010 800 $ US |
| 1991 | 0 $ US | 39 978 163 184 $ US |
| 1990 | 9 493 861 738 $ US | 29 707 835 778 $ US |
| 1989 | 8 884 312 275 $ US | 21 819 187 476 $ US |
| 1988 | 15 910 262 069 $ US | 17 595 820 159 $ US |
| 1987 | 10 598 117 241 $ US | 11 695 655 291 $ US |
| 1986 | 11 927 109 278 $ US | 21 773 514 754 $ US |
| 1985 | 10 466 520 000 $ US | 25 746 070 825 $ US |
| 1984 | 10 508 123 515 $ US | 26 971 526 132 $ US |
| 1983 | 8 799 209 302 $ US | 37 834 565 739 $ US |
| 1982 | 18 971 186 047 $ US | 26 415 543 503 $ US |
| 1981 | 16 518 209 302 $ US | 28 082 907 606 $ US |
| 1980 | 14 627 837 209 $ US | 27 125 991 305 $ US |
| 1979 | 13 727 674 419 $ US | 14 516 475 277 $ US |
| 1978 | 14 650 348 837 $ US | 17 330 359 279 $ US |
| 1977 | 12 692 465 116 $ US | 23 448 812 229 $ US |
| 1976 | 9 069 255 814 $ US | 19 212 061 650 $ US |
| 1975 | 6 863 837 209 $ US | 18 318 369 218 $ US |
| 1974 | 4 838 441 860 $ US | 11 105 780 994 $ US |
| 1973 | 3 263 139 535 $ US | 5 594 486 012 $ US |
| 1972 | 2 793 090 909 $ US | 3 689 022 456 $ US |
| 1971 | 2 463 204 545 $ US | 2 928 005 748 $ US |
| 1970 | 2 171 911 111 $ US | 2 327 125 277 $ US |
| 1969 | 2 042 888 889 $ US | 2 050 926 065 $ US |
| 1968 | 1 956 888 889 $ US | 1 768 850 274 $ US |
| 1967 | 1 612 822 222 $ US | 1 485 305 338 $ US |
| 1966 | 1 505 288 889 $ US | 1 195 883 823 $ US |
| 1965 | 1 612 822 222 $ US | 1 021 055 598 $ US |
| 1964 | 1 473 655 172 $ US | 878 548 558 $ US |
| 1963 | 1 458 861 579 $ US | 614 102 504 $ US |
| 1962 | 1 489 969 152 $ US | 642 016 254 $ US |
| 1961 | 1 366 605 304 $ US | 702 251 188 $ US |
| 1960 | 1 390 889 415 $ US | 730 164 939 $ US |
En 2025, les importations de biens et services du Venezuela s'élevaient à 10,1 milliards de dollars et celles de l'Iran à 125 milliards de dollars : celles de l'Iran étaient 12 fois plus élevées. En 1960, les importations du Venezuela étaient 1,9 fois plus élevées : 1,39 milliard de dollars pour le Venezuela et 730 millions de dollars pour l'Iran.
Venezuela vs Iran : chiffres des importations
|
Venezuela
|
Iran
|
|
|---|---|---|
| Importations | 10,1 Md $US (2025) | 125 Md $US (2025) |
| Rang mondial | 118/174 | 44/174 |
| Part mondiale | 0,03 % | 0,37 % |
| % du PIB | 10,1 % | 34,5 % |
| Première catégorie de biens | n.d. | Machines, électronique et véhicules (33,4 %, 2023) |
| Première origine des biens | n.d. | Émirats arabes unis (31,4 %, 2023) |
Comparer les importations de 2 pays au choix
Sources :
- Banque mondiale | Économie et croissance (1960–2025, mis à jour en octobre 2026)
- TradeMap (2001–2023, mis à jour en octobre 2026)
Creative Commons Attribution (CC BY) : vous pouvez copier, partager, adapter et réutiliser ce contenu, y compris à des fins commerciales, à condition de citer statistics.wiki et d’indiquer les modifications apportées. Les sources citées ci-dessus peuvent avoir leurs propres conditions de licence.