
Importations de biens et services d'Israël par année ($ US), 1970–2025
| Année | $ US | Rang mondial |
|---|---|---|
| Importations | Rang mondial | |
| 2025 | 155 326 013 611 $ US | #39 |
| 2024 | 140 903 132 496 $ US | #39 |
| 2023 | 141 949 720 798 $ US | #39 |
| 2022 | 153 716 570 794 $ US | #37 |
| 2021 | 127 330 211 936 $ US | #39 |
| 2020 | 98 559 641 596 $ US | #39 |
| 2019 | 109 553 655 514 $ US | #39 |
| 2018 | 109 319 594 929 $ US | #42 |
| 2017 | 97 866 153 832 $ US | #40 |
| 2016 | 90 475 144 467 $ US | #39 |
| 2015 | 85 081 011 363 $ US | #39 |
| 2014 | 95 211 692 531 $ US | #40 |
| 2013 | 93 509 987 330 $ US | #41 |
| 2012 | 92 906 239 603 $ US | #40 |
| 2011 | 93 102 471 848 $ US | #41 |
| 2010 | 76 948 241 162 $ US | #41 |
| 2009 | 63 709 559 037 $ US | #41 |
| 2008 | 84 526 756 689 $ US | #41 |
| 2007 | 74 068 549 938 $ US | #39 |
| 2006 | 62 604 628 574 $ US | #39 |
| 2005 | 58 276 695 189 $ US | #39 |
| 2004 | 52 895 820 616 $ US | #39 |
| 2003 | 44 932 193 847 $ US | #38 |
| 2002 | 43 363 108 827 $ US | #35 |
| 2001 | 44 056 142 854 $ US | #34 |
| 2000 | 47 200 194 491 $ US | #31 |
| 1999 | 41 207 853 226 $ US | #31 |
| 1998 | 36 163 743 059 $ US | #36 |
| 1997 | 37 372 736 708 $ US | #36 |
| 1996 | 37 635 231 381 $ US | #33 |
| 1995 | 35 385 120 380 $ US | #33 |
| 1994 | 30 559 356 049 $ US | #31 |
| 1993 | 27 078 766 828 $ US | #32 |
| 1992 | 24 174 277 988 $ US | #35 |
| 1991 | 22 534 110 833 $ US | #35 |
| 1990 | 20 435 071 421 $ US | #37 |
| 1989 | 17 498 729 910 $ US | #37 |
| 1988 | 17 261 772 469 $ US | #33 |
| 1987 | 16 608 825 411 $ US | #28 |
| 1986 | 12 705 184 837 $ US | #33 |
| 1985 | 11 785 377 046 $ US | #33 |
| 1984 | 12 012 629 604 $ US | #32 |
| 1983 | 12 014 412 811 $ US | #32 |
| 1982 | 11 726 255 144 $ US | #34 |
| 1981 | 12 228 947 368 $ US | #34 |
| 1980 | 11 434 705 882 $ US | #35 |
| 1979 | 10 380 400 000 $ US | #34 |
| 1978 | 8 833 529 412 $ US | #31 |
| 1977 | 7 348 000 000 $ US | #32 |
| 1976 | 6 588 750 000 $ US | #29 |
| 1975 | 7 091 666 667 $ US | #25 |
| 1974 | 6 822 500 000 $ US | #25 |
| 1973 | 5 057 500 000 $ US | #22 |
| 1972 | 3 042 500 000 $ US | #24 |
| 1971 | 2 580 000 000 $ US | #25 |
| 1970 | 2 800 000 000 $ US | #21 |
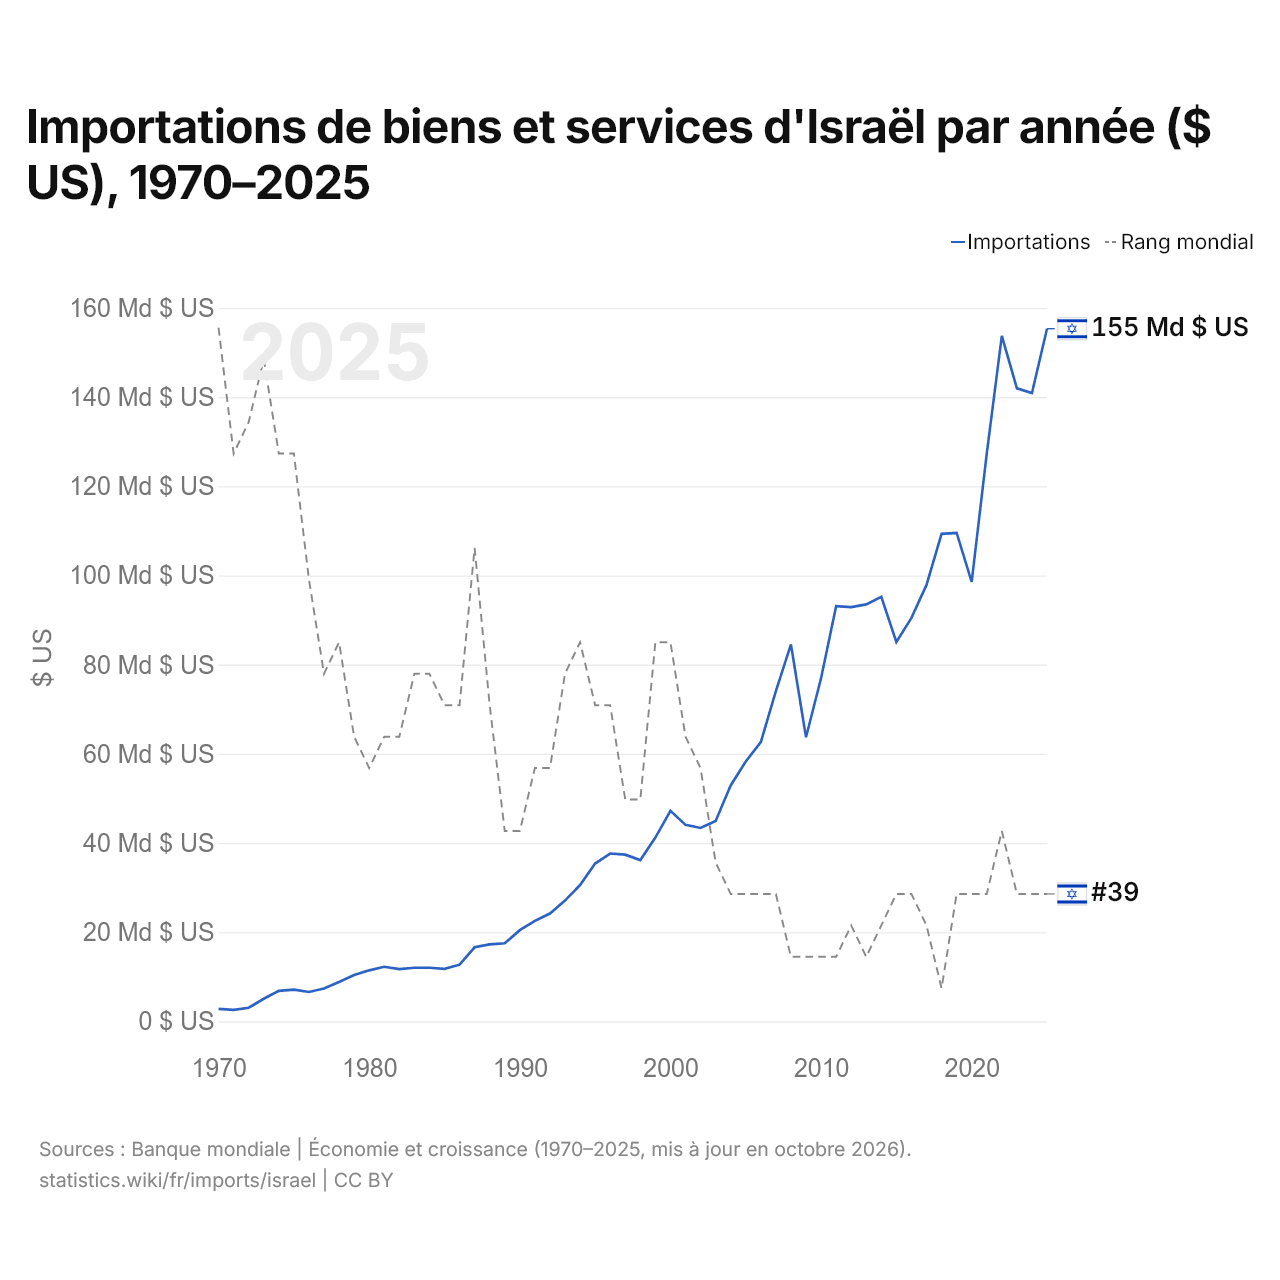
En 2025, les importations de biens et services d'Israël s'élevaient à 155 milliards de dollars, contre 2,8 milliards de dollars en 1970. Le minimum a été de 2,58 milliards de dollars, en 1971. Elles se classaient au 39e rang mondial, un rang qu'elles occupent depuis 2023. Leur meilleur rang a été le 21e, occupé pour la dernière fois en 1970.
En 2025, les importations de biens et services d'Israël étaient les 15es plus élevées de 44 pays situés en Asie. En 2025, les exportations d'Israël dépassaient ses importations de 13 milliards de dollars, soit un excédent commercial. Le commerce d'Israël, exportations et importations réunies, équivalait à 53,0 % de son PIB en 2025, au 128e rang mondial.
Importations de biens d'Israël par catégorie, 2025
Importations de biens, 2025: 95,5 Md $US
En 2025, la première catégorie des importations de biens d'Israël était « machines, électronique et véhicules », avec 40,1 %, suivie de « produits chimiques, pharmaceutiques et plastiques », avec 12,5 %.
Origines des importations de biens d'Israël : les 10 premières, 2025
| Rang | Pays | Importations de biens | Part | |
|---|---|---|---|---|
| 1 |
 Chine |
20,8 Md $US | 21,8 % | vs Chine |
| 2 |
 États-Unis |
9,99 Md $US | 10,5 % | vs USA |
| 3 |
 Allemagne |
5,92 Md $US | 6,2 % | vs Allemagne |
| 4 |
 Italie |
4,05 Md $US | 4,24 % | vs Italie |
| 5 |
 Corée du Sud |
2,52 Md $US | 2,64 % | vs Corée du Sud |
| 6 |
 France |
2,43 Md $US | 2,54 % | vs France |
| 7 |
 Russie |
2,36 Md $US | 2,47 % | vs Russie |
| 8 |
 Inde |
2,20 Md $US | 2,31 % | vs Inde |
| 9 |
 Royaume-Uni |
2,12 Md $US | 2,22 % | vs R.-U. |
| 10 |
 Turquie |
2,12 Md $US | 2,22 % | vs Turquie |
| Autres partenaires et non précisés | 41,0 Md $US | 42,9 % |
Importations de biens d'Israël depuis ses 5 principales origines ($ US), 2001–2025
| Année | $ US | ||||
|---|---|---|---|---|---|
| Chine | États-Unis | Allemagne | Italie | Corée du Sud | |
| 2025 | 20 791 702 000 $ US | 9 988 847 000 $ US | 5 917 205 000 $ US | 4 045 801 000 $ US | 2 519 833 000 $ US |
| 2024 | 13 529 225 000 $ US | 9 227 724 000 $ US | 6 399 278 000 $ US | 3 450 622 000 $ US | 2 558 459 000 $ US |
| 2023 | 16 329 326 000 $ US | 9 686 393 000 $ US | 5 648 600 000 $ US | 3 542 325 000 $ US | 2 215 262 000 $ US |
| 2022 | 13 150 818 000 $ US | 9 656 860 000 $ US | 7 075 418 000 $ US | 3 472 366 000 $ US | 2 796 623 000 $ US |
| 2021 | 10 728 046 000 $ US | 8 638 151 000 $ US | 6 560 507 000 $ US | 3 366 722 000 $ US | 2 251 038 000 $ US |
| 2020 | 7 669 910 000 $ US | 8 048 471 000 $ US | 5 229 868 000 $ US | 2 683 986 000 $ US | 1 690 818 000 $ US |
| 2019 | 10 234 885 000 $ US | 12 824 778 000 $ US | 4 832 667 000 $ US | 2 954 177 000 $ US | 1 726 570 000 $ US |
| 2018 | 10 465 960 000 $ US | 10 249 855 000 $ US | 4 668 080 000 $ US | 3 016 039 000 $ US | 1 552 588 000 $ US |
| 2017 | 6 527 398 000 $ US | 8 087 035 000 $ US | 4 721 171 000 $ US | 2 777 979 000 $ US | 1 138 812 000 $ US |
| 2016 | 5 896 145 000 $ US | 8 097 674 000 $ US | 4 069 373 000 $ US | 2 693 693 000 $ US | 1 313 200 000 $ US |
| 2015 | 5 768 087 000 $ US | 8 089 169 000 $ US | 3 806 930 000 $ US | 2 490 715 000 $ US | 1 135 717 000 $ US |
| 2014 | 5 994 138 000 $ US | 8 564 065 000 $ US | 4 651 256 000 $ US | 2 784 123 000 $ US | 1 354 780 000 $ US |
| 2013 | 5 660 266 000 $ US | 8 159 492 000 $ US | 4 666 311 000 $ US | 2 692 791 000 $ US | 1 510 665 000 $ US |
| 2012 | 5 322 251 000 $ US | 9 399 851 000 $ US | 4 621 142 000 $ US | 2 779 486 000 $ US | 1 657 942 000 $ US |
| 2011 | 5 450 510 000 $ US | 8 707 597 000 $ US | 4 566 236 000 $ US | 3 055 846 000 $ US | 1 603 920 000 $ US |
| 2010 | 4 736 872 000 $ US | 6 703 326 000 $ US | 3 678 710 000 $ US | 2 425 853 000 $ US | 1 099 106 000 $ US |
| 2009 | 3 520 889 000 $ US | 5 851 090 000 $ US | 3 361 291 000 $ US | 2 126 049 000 $ US | 867 860 000 $ US |
| 2008 | 4 244 011 000 $ US | 8 038 515 000 $ US | 3 940 281 000 $ US | 2 553 908 000 $ US | 1 100 247 000 $ US |
| 2007 | 3 476 900 000 $ US | 7 852 349 000 $ US | 3 483 373 000 $ US | 2 302 005 000 $ US | 942 512 000 $ US |
| 2006 | 2 427 841 000 $ US | 5 920 428 000 $ US | 3 201 262 000 $ US | 1 839 541 000 $ US | 890 486 000 $ US |
| 2005 | 1 888 243 000 $ US | 6 064 846 000 $ US | 2 987 036 000 $ US | 1 733 660 000 $ US | 851 321 000 $ US |
| 2004 | 1 418 456 000 $ US | 6 119 649 000 $ US | 3 090 267 000 $ US | 1 565 499 000 $ US | 759 864 000 $ US |
| 2003 | 1 008 094 000 $ US | 5 331 739 000 $ US | 2 730 943 000 $ US | 1 398 188 000 $ US | 579 769 000 $ US |
| 2002 | 793 272 000 $ US | 6 134 173 000 $ US | 2 347 762 000 $ US | 1 530 526 000 $ US | 512 440 000 $ US |
| 2001 | 737 305 000 $ US | 6 704 515 000 $ US | 2 614 775 000 $ US | 1 650 887 000 $ US | 523 612 000 $ US |
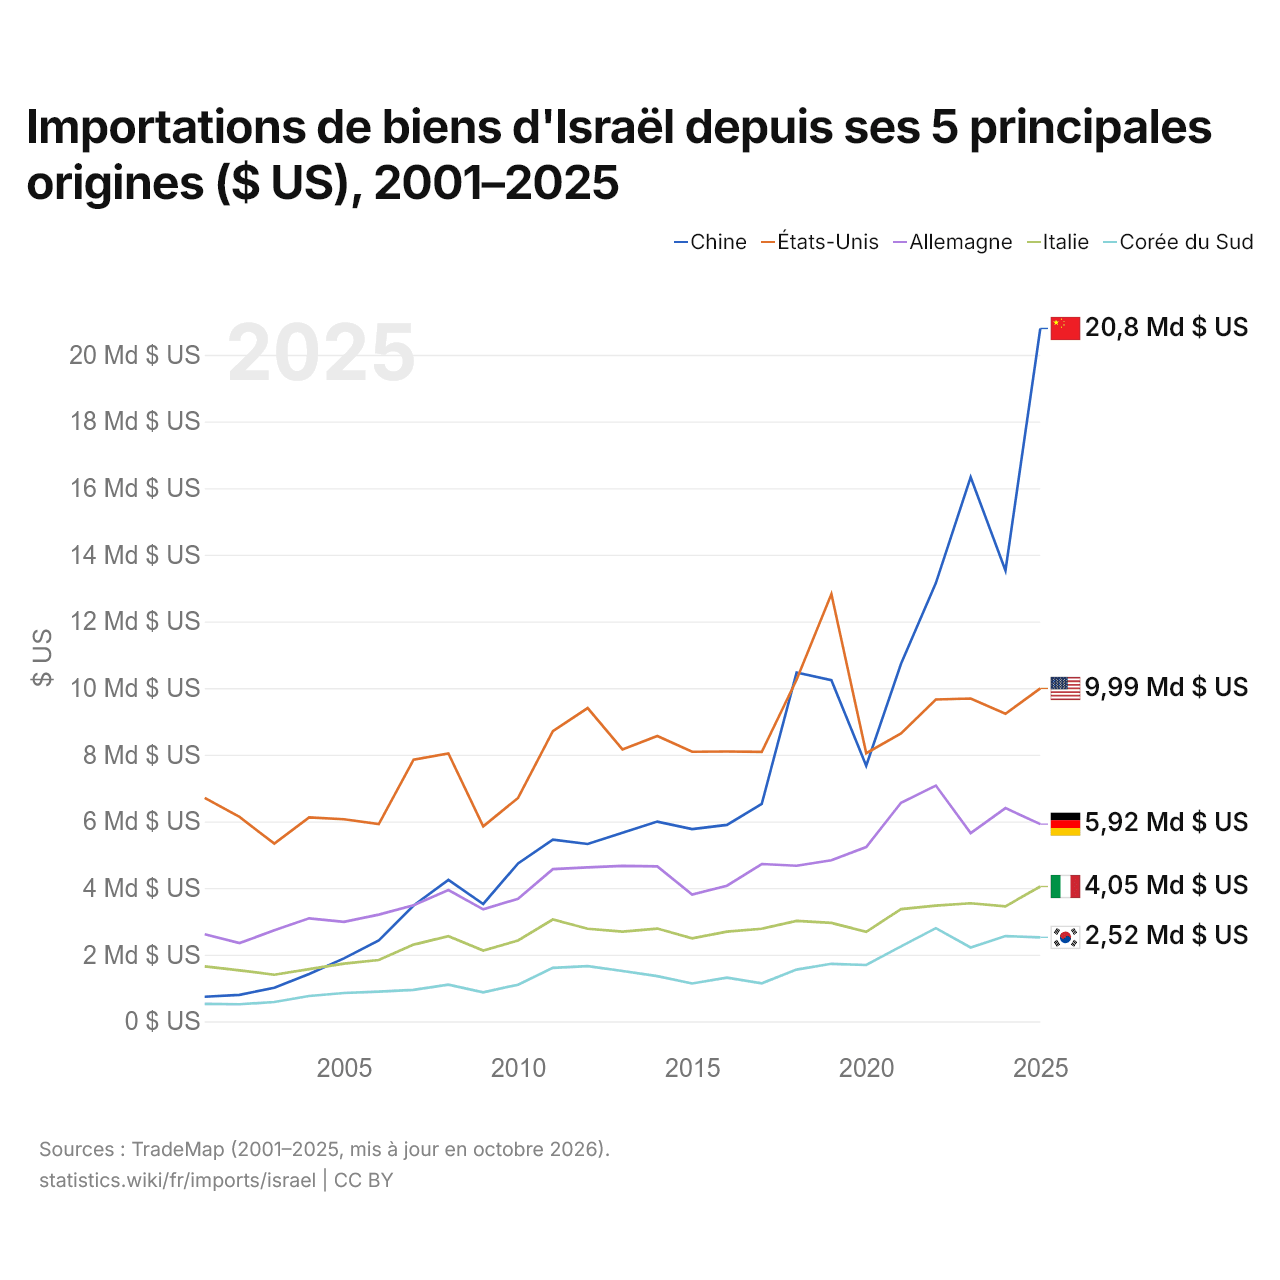
En 2025, les importations de biens s'élevaient à 20,8 milliards de dollars en provenance de la Chine, 9,99 milliards de dollars en provenance des États-Unis, 5,92 milliards de dollars en provenance de l'Allemagne, 4,05 milliards de dollars en provenance de l'Italie et 2,52 milliards de dollars en provenance de la Corée du Sud. Le premier rang des cinq fournisseurs d'Israël est occupé par la Chine depuis 2021.
Importations de biens et de services d'Israël ($ US), 1960–2025
| Année | $ US | |
|---|---|---|
| Biens | Services | |
| 2025 | 101 170 900 000 $ US | 56 456 700 000 $ US |
| 2024 | 95 398 500 000 $ US | 46 139 000 000 $ US |
| 2023 | 93 462 500 000 $ US | 48 270 800 000 $ US |
| 2022 | 106 210 900 000 $ US | 47 558 200 000 $ US |
| 2021 | 91 673 600 000 $ US | 36 103 600 000 $ US |
| 2020 | 70 289 300 000 $ US | 28 279 700 000 $ US |
| 2019 | 75 492 100 000 $ US | 33 944 100 000 $ US |
| 2018 | 76 761 500 000 $ US | 32 298 800 000 $ US |
| 2017 | 68 416 400 000 $ US | 29 436 300 000 $ US |
| 2016 | 64 071 600 000 $ US | 26 291 400 000 $ US |
| 2015 | 60 726 800 000 $ US | 24 227 600 000 $ US |
| 2014 | 71 407 600 000 $ US | 23 677 700 000 $ US |
| 2013 | 70 537 900 000 $ US | 22 806 700 000 $ US |
| 2012 | 70 498 900 000 $ US | 22 156 600 000 $ US |
| 2011 | 72 636 500 000 $ US | 20 453 900 000 $ US |
| 2010 | 58 288 000 000 $ US | 18 736 500 000 $ US |
| 2009 | 46 001 500 000 $ US | 17 838 700 000 $ US |
| 2008 | 64 437 700 000 $ US | 20 333 900 000 $ US |
| 2007 | 56 005 300 000 $ US | 18 076 500 000 $ US |
| 2006 | 47 350 000 000 $ US | 15 301 900 000 $ US |
| 2005 | 43 887 100 000 $ US | 14 337 000 000 $ US |
| 2004 | 39 507 400 000 $ US | 13 358 600 000 $ US |
| 2003 | 33 315 800 000 $ US | 11 728 900 000 $ US |
| 2002 | 31 992 200 000 $ US | 11 327 100 000 $ US |
| 2001 | 31 737 900 000 $ US | 12 332 400 000 $ US |
| 2000 | 34 747 200 000 $ US | 12 435 300 000 $ US |
| 1999 | 30 566 100 000 $ US | 10 583 800 000 $ US |
| 1998 | 26 617 900 000 $ US | 9 537 900 000 $ US |
| 1997 | 28 156 400 000 $ US | 9 183 200 000 $ US |
| 1996 | 28 654 100 000 $ US | 9 008 400 000 $ US |
| 1995 | 26 963 900 000 $ US | 8 392 500 000 $ US |
| 1994 | 22 727 600 000 $ US | 7 589 700 000 $ US |
| 1993 | 20 532 600 000 $ US | 6 397 400 000 $ US |
| 1992 | 18 389 400 000 $ US | 5 544 500 000 $ US |
| 1991 | 17 093 300 000 $ US | 5 178 100 000 $ US |
| 1990 | 15 306 900 000 $ US | 4 921 100 000 $ US |
| 1989 | 13 047 200 000 $ US | 4 276 000 000 $ US |
| 1988 | 13 240 500 000 $ US | 3 826 500 000 $ US |
| 1987 | 13 017 800 000 $ US | 3 389 900 000 $ US |
| 1986 | 9 734 500 000 $ US | 2 741 100 000 $ US |
| 1985 | 9 201 800 000 $ US | 2 404 000 000 $ US |
| 1984 | 8 958 700 000 $ US | 2 806 800 000 $ US |
| 1983 | 8 971 300 000 $ US | 2 798 600 000 $ US |
| 1982 | 8 986 400 000 $ US | 2 586 200 000 $ US |
| 1981 | 9 693 800 000 $ US | 2 663 200 000 $ US |
| 1980 | 9 201 000 000 $ US | 2 310 000 000 $ US |
| 1979 | 8 088 000 000 $ US | 2 133 000 000 $ US |
| 1978 | 6 814 000 000 $ US | 1 851 000 000 $ US |
| 1977 | 5 484 000 000 $ US | 1 538 000 000 $ US |
| 1976 | 5 345 000 000 $ US | 1 365 000 000 $ US |
| 1975 | 5 600 000 000 $ US | 1 198 000 000 $ US |
| 1974 | 5 060 000 000 $ US | 1 092 000 000 $ US |
| 1973 | 3 987 000 000 $ US | 880 000 000 $ US |
| 1972 | 2 307 000 000 $ US | 634 000 000 $ US |
| 1971 | 2 224 000 000 $ US | 632 000 000 $ US |
| 1970 | 1 944 000 000 $ US | 453 000 000 $ US |
| 1969 | 1 528 000 000 $ US | 423 000 000 $ US |
| 1968 | 1 265 000 000 $ US | 342 000 000 $ US |
| 1967 | 977 000 000 $ US | 340 000 000 $ US |
| 1966 | 865 000 000 $ US | 305 000 000 $ US |
| 1965 | 840 000 000 $ US | 288 000 000 $ US |
| 1964 | - | - |
| 1963 | - | - |
| 1962 | - | - |
| 1961 | 606 000 000 $ US | 151 000 000 $ US |
| 1960 | 493 000 000 $ US | 120 000 000 $ US |
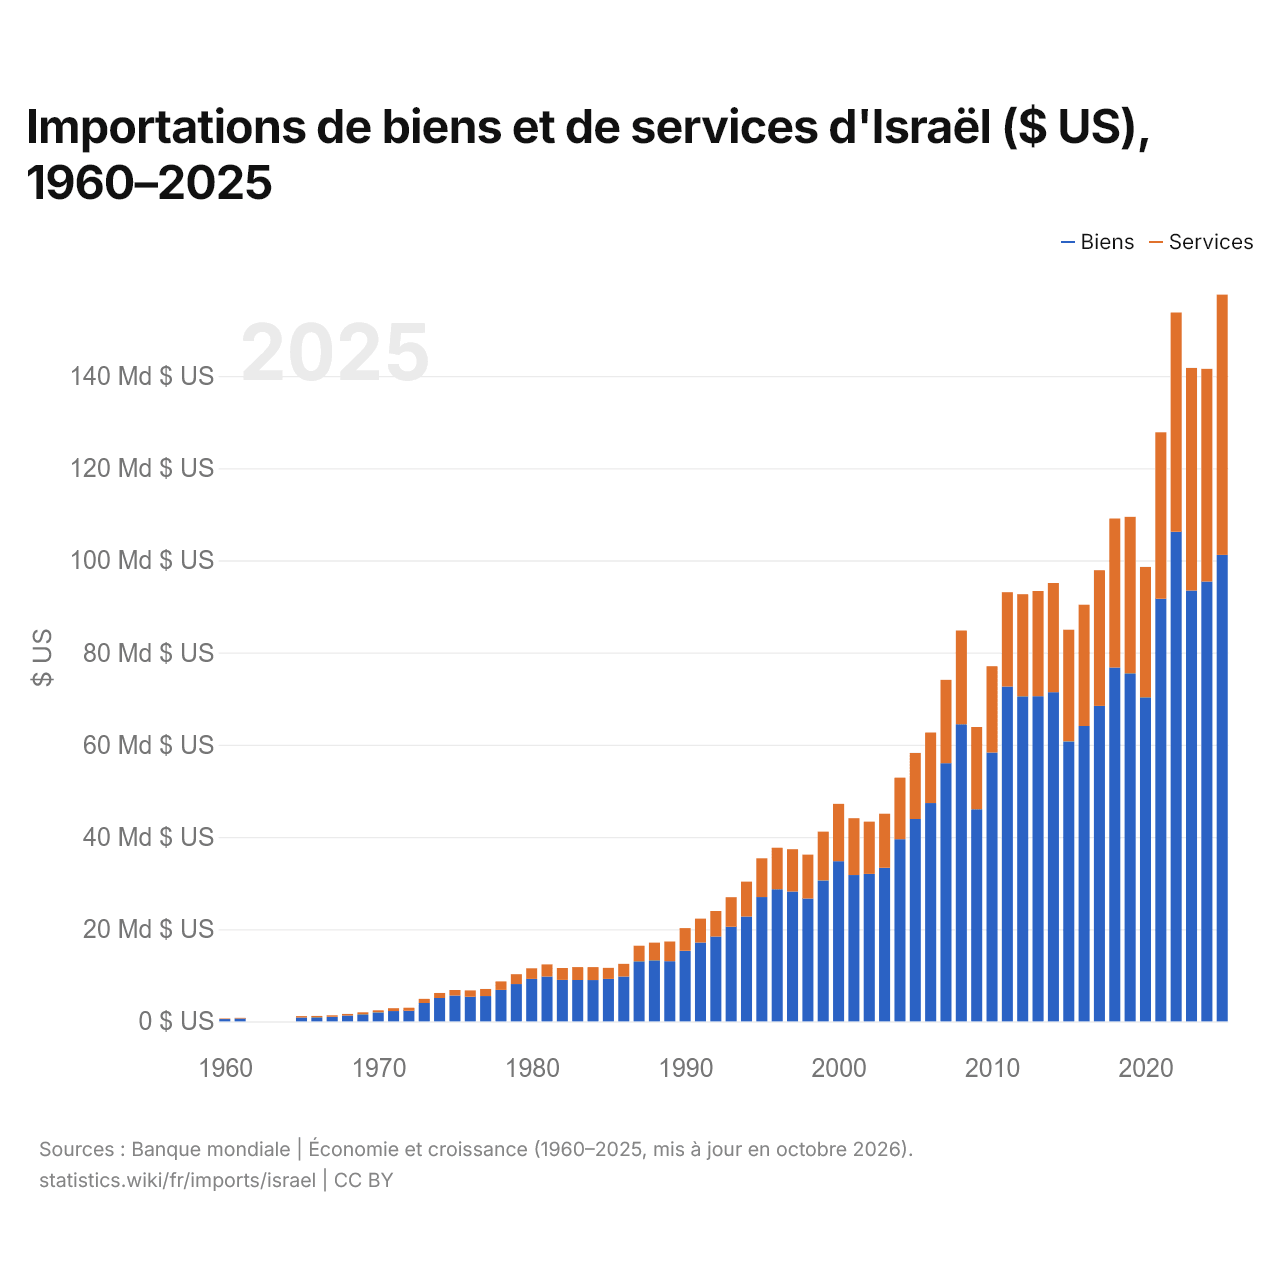
En 2025, les importations de biens d'Israël s'élevaient à 101 milliards de dollars et celles de services à 56,5 milliards de dollars ; les services représentaient 35,8 % du total, contre 19,6 % en 1960.
Israël dans le classement mondial des importations, 2025
| Rang | Pays | Importations | Part mondiale | |
|---|---|---|---|---|
| 36 |
 Roumanie |
175 Md $US | 0,52 % | |
| 37 |
 Hongrie |
168 Md $US | 0,5 % | |
| 38 |
 Luxembourg |
161 Md $US | 0,48 % | vs Luxembourg |
| 39 |
 Israël |
155 Md $US | 0,46 % | |
| 40 |
 Portugal |
148 Md $US | 0,44 % | vs Portugal |
| 41 |
 Slovaquie |
132 Md $US | 0,39 % | |
| 42 |
 Finlande |
130 Md $US | 0,39 % |
Importations de biens et services d'Israël, % du PIB, 1970–2025
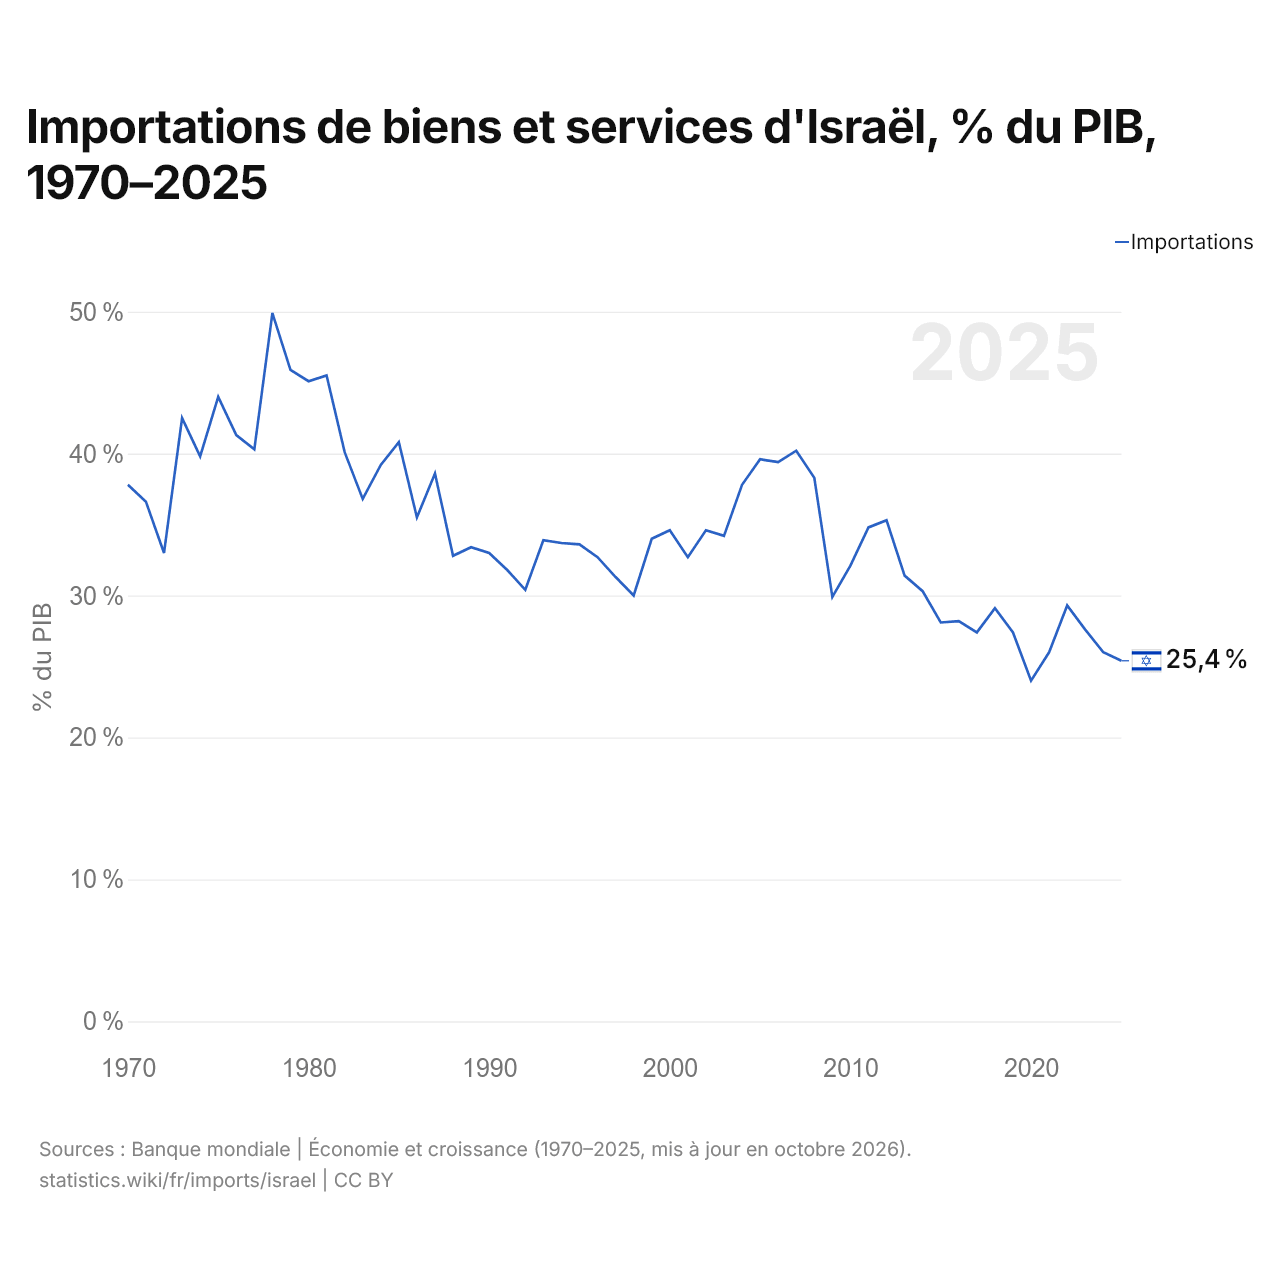
En 2025, les importations de biens et services d'Israël équivalaient à 25,4 % de son PIB, contre 37,8 % en 1970. La part la plus élevée a été de 49,9 %, en 1978.
Comparer les importations d'Israël avec celles d'autres pays
Sources :
- Banque mondiale | Économie et croissance (1960–2025, mis à jour en octobre 2026)
- TradeMap (2001–2025, mis à jour en octobre 2026)
Creative Commons Attribution (CC BY) : vous pouvez copier, partager, adapter et réutiliser ce contenu, y compris à des fins commerciales, à condition de citer statistics.wiki et d’indiquer les modifications apportées. Les sources citées ci-dessus peuvent avoir leurs propres conditions de licence.