
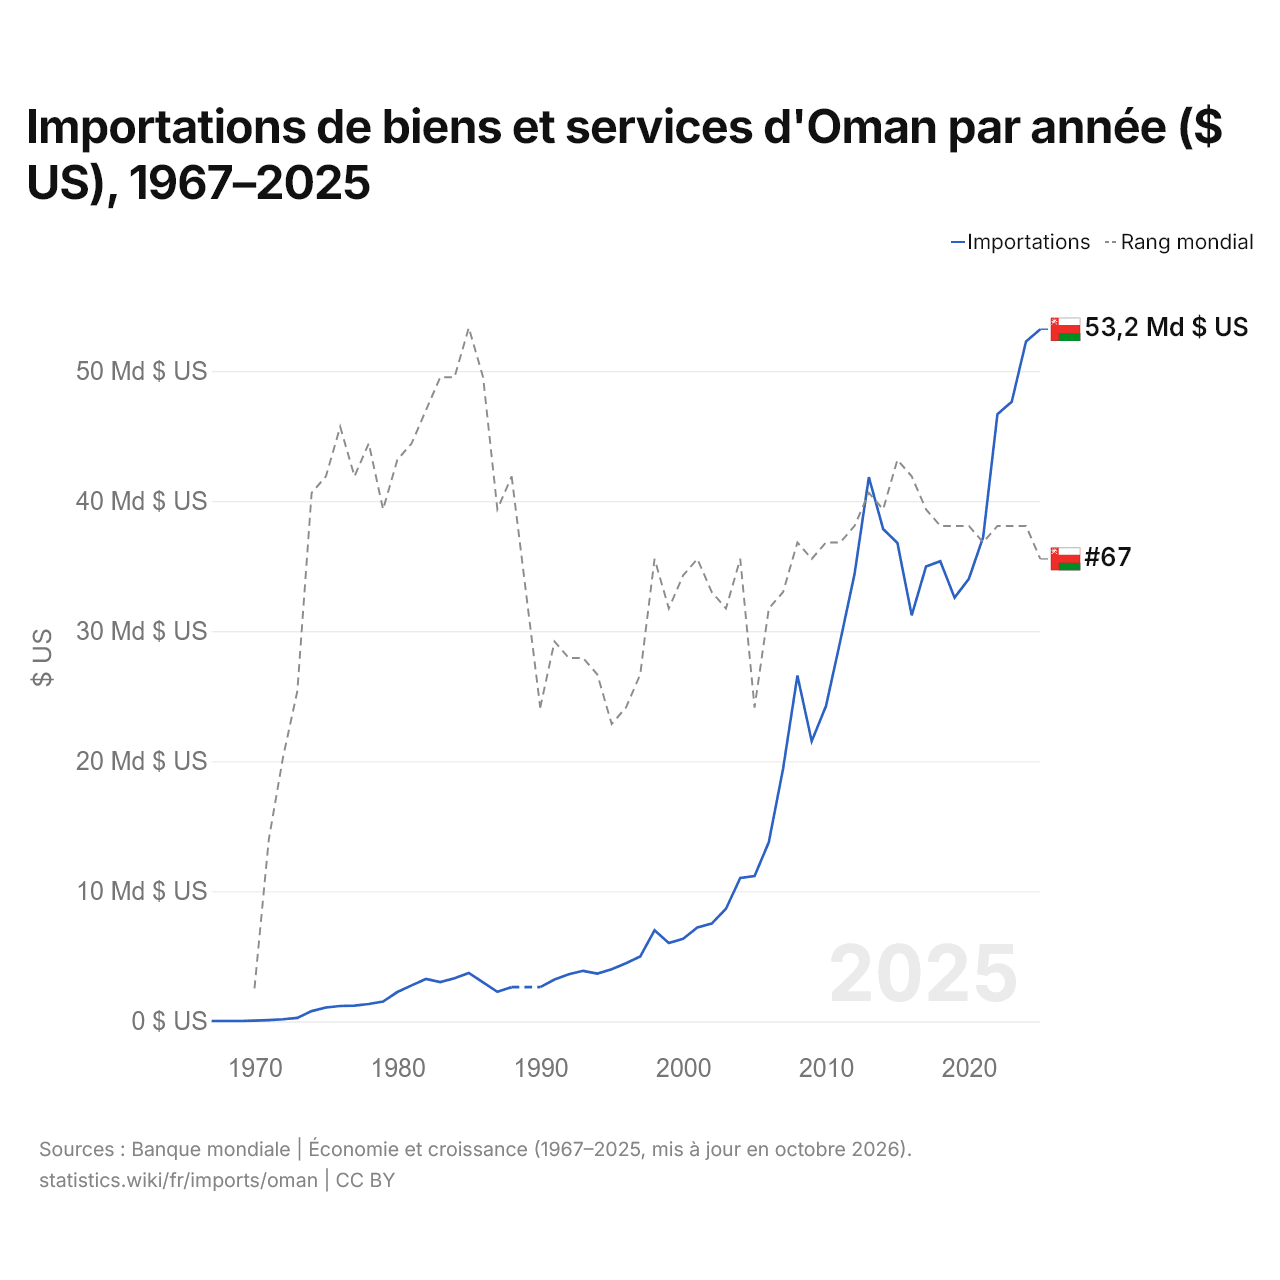
Importations de biens et services d'Oman par année ($ US), 1967–2025
| Année | $ US | Rang mondial |
|---|---|---|
| Importations | Rang mondial | |
| 2025 | 53 205 941 136 $ US | #67 |
| 2024 | 52 261 638 492 $ US | #65 |
| 2023 | 47 632 509 753 $ US | #65 |
| 2022 | 46 681 404 421 $ US | #65 |
| 2021 | 37 217 165 150 $ US | #66 |
| 2020 | 34 023 407 022 $ US | #65 |
| 2019 | 32 569 570 871 $ US | #65 |
| 2018 | 35 373 211 964 $ US | #65 |
| 2017 | 34 959 687 906 $ US | #64 |
| 2016 | 31 211 963 589 $ US | #62 |
| 2015 | 36 777 633 290 $ US | #61 |
| 2014 | 37 856 957 087 $ US | #64 |
| 2013 | 41 830 949 285 $ US | #63 |
| 2012 | 34 397 919 376 $ US | #65 |
| 2011 | 29 235 370 611 $ US | #66 |
| 2010 | 24 236 671 001 $ US | #66 |
| 2009 | 21 537 061 118 $ US | #67 |
| 2008 | 26 587 776 333 $ US | #66 |
| 2007 | 19 440 832 250 $ US | #69 |
| 2006 | 13 778 933 680 $ US | #70 |
| 2005 | 11 172 951 886 $ US | #76 |
| 2004 | 11 024 707 412 $ US | #67 |
| 2003 | 8 657 997 399 $ US | #70 |
| 2002 | 7 513 654 096 $ US | #69 |
| 2001 | 7 209 362 809 $ US | #67 |
| 2000 | 6 351 105 332 $ US | #68 |
| 1999 | 6 013 003 901 $ US | #70 |
| 1998 | 7 003 901 170 $ US | #67 |
| 1997 | 4 993 498 049 $ US | #74 |
| 1996 | 4 468 140 442 $ US | #76 |
| 1995 | 4 010 403 121 $ US | #77 |
| 1994 | 3 672 301 691 $ US | #74 |
| 1993 | 3 882 964 889 $ US | #73 |
| 1992 | 3 615 084 525 $ US | #73 |
| 1991 | 3 219 765 930 $ US | #72 |
| 1990 | 2 634 590 377 $ US | #76 |
| 1989 | - | - |
| 1988 | 2 629 388 817 $ US | #62 |
| 1987 | 2 270 480 884 $ US | #64 |
| 1986 | 2 997 523 182 $ US | #56 |
| 1985 | 3 720 377 828 $ US | #53 |
| 1984 | 3 315 025 608 $ US | #56 |
| 1983 | 3 019 687 319 $ US | #56 |
| 1982 | 3 259 988 419 $ US | #58 |
| 1981 | 2 764 910 539 $ US | #60 |
| 1980 | 2 252 461 204 $ US | #61 |
| 1979 | 1 519 976 549 $ US | #64 |
| 1978 | 1 335 263 173 $ US | #60 |
| 1977 | 1 207 295 599 $ US | #62 |
| 1976 | 1 176 896 642 $ US | #59 |
| 1975 | 1 062 826 288 $ US | #62 |
| 1974 | 786 045 165 $ US | #63 |
| 1973 | 266 627 884 $ US | #75 |
| 1972 | 160 511 552 $ US | #79 |
| 1971 | 96 727 623 $ US | #84 |
| 1970 | 50 399 960 $ US | #93 |
| 1969 | 28 559 977 $ US | - |
| 1968 | 27 839 978 $ US | - |
| 1967 | 24 026 313 $ US | - |
En 2025, les importations de biens et services d'Oman s'élevaient à 53,2 milliards de dollars, contre 24 millions de dollars en 1967. Elles se classaient au 67e rang mondial, en baisse par rapport au 65e rang en 2024. Leur meilleur rang a été le 53e, occupé pour la dernière fois en 1985.
En 2025, les importations de biens et services d'Oman étaient les 23es plus élevées de 44 pays situés en Asie. En 2025, les exportations d'Oman dépassaient ses importations de 13 milliards de dollars, soit un excédent commercial. Le commerce d'Oman, exportations et importations réunies, équivalait à 109,0 % de son PIB en 2025, au 47e rang mondial.
Importations de biens d'Oman par catégorie, 2025
Importations de biens, 2025: 44,6 Md $US
En 2025, la première catégorie des importations de biens d'Oman était « machines, électronique et véhicules », avec 30,8 %, suivie de « pétrole, gaz, minerais et autres matières premières », avec 26,9 %.
Origines des importations de biens d'Oman : les 10 premières, 2025
| Rang | Pays | Importations de biens | Part | |
|---|---|---|---|---|
| 1 |
 Chine |
7,26 Md $US | 16,3 % | |
| 2 |
 Inde |
4,37 Md $US | 9,79 % | |
| 3 |
 EAU |
4,17 Md $US | 9,35 % | vs EAU |
| 4 |
 Koweït |
3,38 Md $US | 7,57 % | vs Koweït |
| 5 |
 Arabie saoudite |
2,96 Md $US | 6,63 % | vs Arabie saoudite |
| 6 |
 États-Unis |
2,82 Md $US | 6,32 % | |
| 7 |
 Japon |
2,45 Md $US | 5,5 % | |
| 8 |
 Brésil |
1,42 Md $US | 3,19 % | |
| 9 |
 Allemagne |
1,21 Md $US | 2,7 % | |
| 10 |
 Qatar |
1,12 Md $US | 2,51 % | |
| Autres partenaires et non précisés | 13,5 Md $US | 30,2 % |
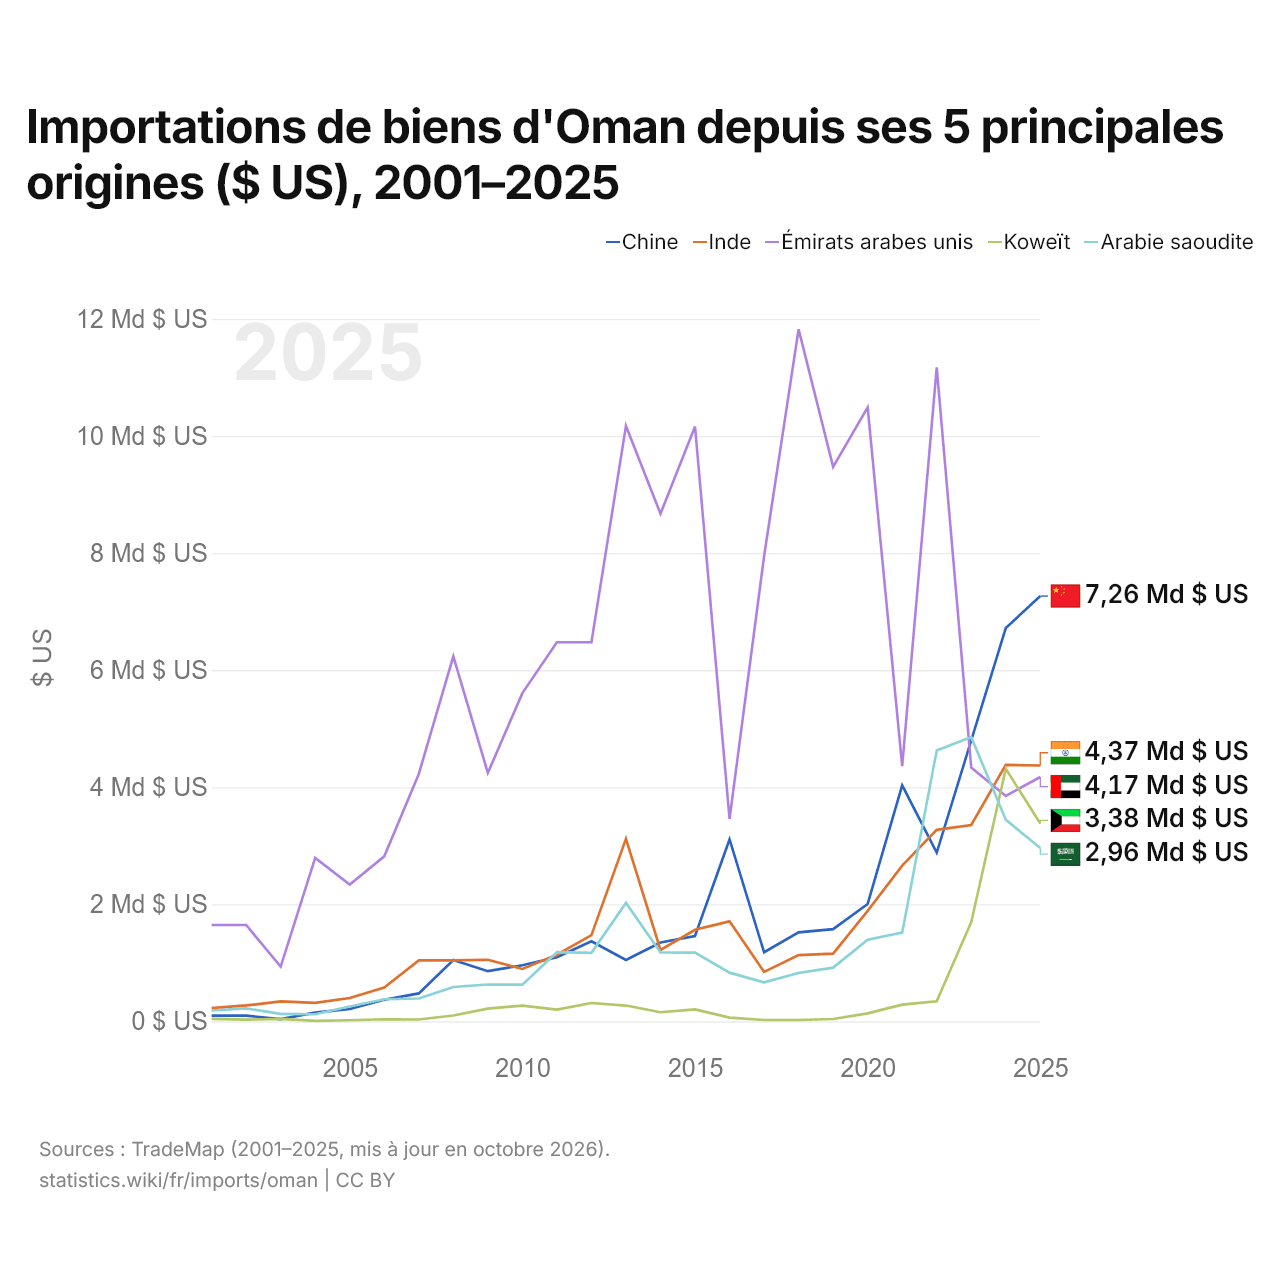
Importations de biens d'Oman depuis ses 5 principales origines ($ US), 2001–2025
| Année | $ US | ||||
|---|---|---|---|---|---|
| Chine | Inde | Émirats arabes unis | Koweït | Arabie saoudite | |
| 2025 | 7 264 918 000 $ US | 4 371 087 000 $ US | 4 173 117 000 $ US | 3 381 388 000 $ US | 2 960 240 000 $ US |
| 2024 | 6 719 656 000 $ US | 4 380 663 000 $ US | 3 850 129 000 $ US | 4 313 015 000 $ US | 3 443 637 000 $ US |
| 2023 | 4 800 242 000 $ US | 3 354 281 000 $ US | 4 334 455 000 $ US | 1 694 155 000 $ US | 4 855 543 000 $ US |
| 2022 | 2 880 622 000 $ US | 3 271 891 000 $ US | 11 172 146 000 $ US | 341 258 000 $ US | 4 628 095 000 $ US |
| 2021 | 4 032 318 000 $ US | 2 660 296 000 $ US | 4 357 936 000 $ US | 285 283 000 $ US | 1 514 568 000 $ US |
| 2020 | 2 004 231 000 $ US | 1 887 365 000 $ US | 10 489 756 000 $ US | 136 714 000 $ US | 1 393 973 000 $ US |
| 2019 | 1 574 578 000 $ US | 1 156 833 000 $ US | 9 471 186 000 $ US | 39 120 000 $ US | 917 198 000 $ US |
| 2018 | 1 520 391 000 $ US | 1 130 739 000 $ US | 11 822 905 000 $ US | 22 596 000 $ US | 826 753 000 $ US |
| 2017 | 1 179 721 000 $ US | 844 755 000 $ US | 7 944 438 000 $ US | 22 476 000 $ US | 666 165 000 $ US |
| 2016 | 3 107 101 000 $ US | 1 708 402 000 $ US | 3 457 232 000 $ US | 63 638 000 $ US | 831 822 000 $ US |
| 2015 | 1 456 449 000 $ US | 1 564 069 000 $ US | 10 159 886 000 $ US | 203 206 000 $ US | 1 173 375 000 $ US |
| 2014 | 1 347 326 000 $ US | 1 219 178 000 $ US | 8 670 983 000 $ US | 155 004 000 $ US | 1 175 729 000 $ US |
| 2013 | 1 048 136 000 $ US | 3 117 137 000 $ US | 10 171 534 000 $ US | 269 676 000 $ US | 2 023 711 000 $ US |
| 2012 | 1 368 848 000 $ US | 1 472 512 000 $ US | 6 476 329 000 $ US | 313 391 000 $ US | 1 170 403 000 $ US |
| 2011 | 1 094 361 000 $ US | 1 137 989 000 $ US | 6 476 367 000 $ US | 199 551 000 $ US | 1 181 686 000 $ US |
| 2010 | 957 064 000 $ US | 894 572 000 $ US | 5 607 186 000 $ US | 268 610 000 $ US | 626 190 000 $ US |
| 2009 | 856 647 000 $ US | 1 052 455 000 $ US | 4 243 724 000 $ US | 216 515 000 $ US | 629 420 000 $ US |
| 2008 | 1 049 332 000 $ US | 1 042 004 000 $ US | 6 235 261 000 $ US | 99 914 000 $ US | 585 990 000 $ US |
| 2007 | 476 957 000 $ US | 1 040 643 000 $ US | 4 226 156 000 $ US | 30 730 000 $ US | 389 508 000 $ US |
| 2006 | 368 403 000 $ US | 577 807 000 $ US | 2 819 153 000 $ US | 35 901 000 $ US | 376 592 000 $ US |
| 2005 | 212 786 000 $ US | 398 709 000 $ US | 2 337 471 000 $ US | 17 936 000 $ US | 253 580 000 $ US |
| 2004 | 149 566 000 $ US | 315 418 000 $ US | 2 791 223 000 $ US | 7 957 000 $ US | 121 235 000 $ US |
| 2003 | 37 499 000 $ US | 339 925 000 $ US | 934 146 000 $ US | 40 767 000 $ US | 127 453 000 $ US |
| 2002 | 96 446 000 $ US | 271 340 000 $ US | 1 645 939 000 $ US | 28 007 000 $ US | 220 467 000 $ US |
| 2001 | 97 068 000 $ US | 226 570 000 $ US | 1 645 598 000 $ US | 42 184 000 $ US | 185 042 000 $ US |
En 2025, les importations de biens s'élevaient à 7,26 milliards de dollars en provenance de la Chine, 4,37 milliards de dollars en provenance de l'Inde, 4,17 milliards de dollars en provenance des Émirats arabes unis, 3,38 milliards de dollars en provenance du Koweït et 2,96 milliards de dollars en provenance de l'Arabie saoudite. Le premier rang des cinq fournisseurs d'Oman est occupé par la Chine depuis 2024. Le changement le plus récent dans leur ordre remonte à 2025, quand les importations d'Oman en provenance des Émirats arabes unis ont dépassé celles en provenance du Koweït.
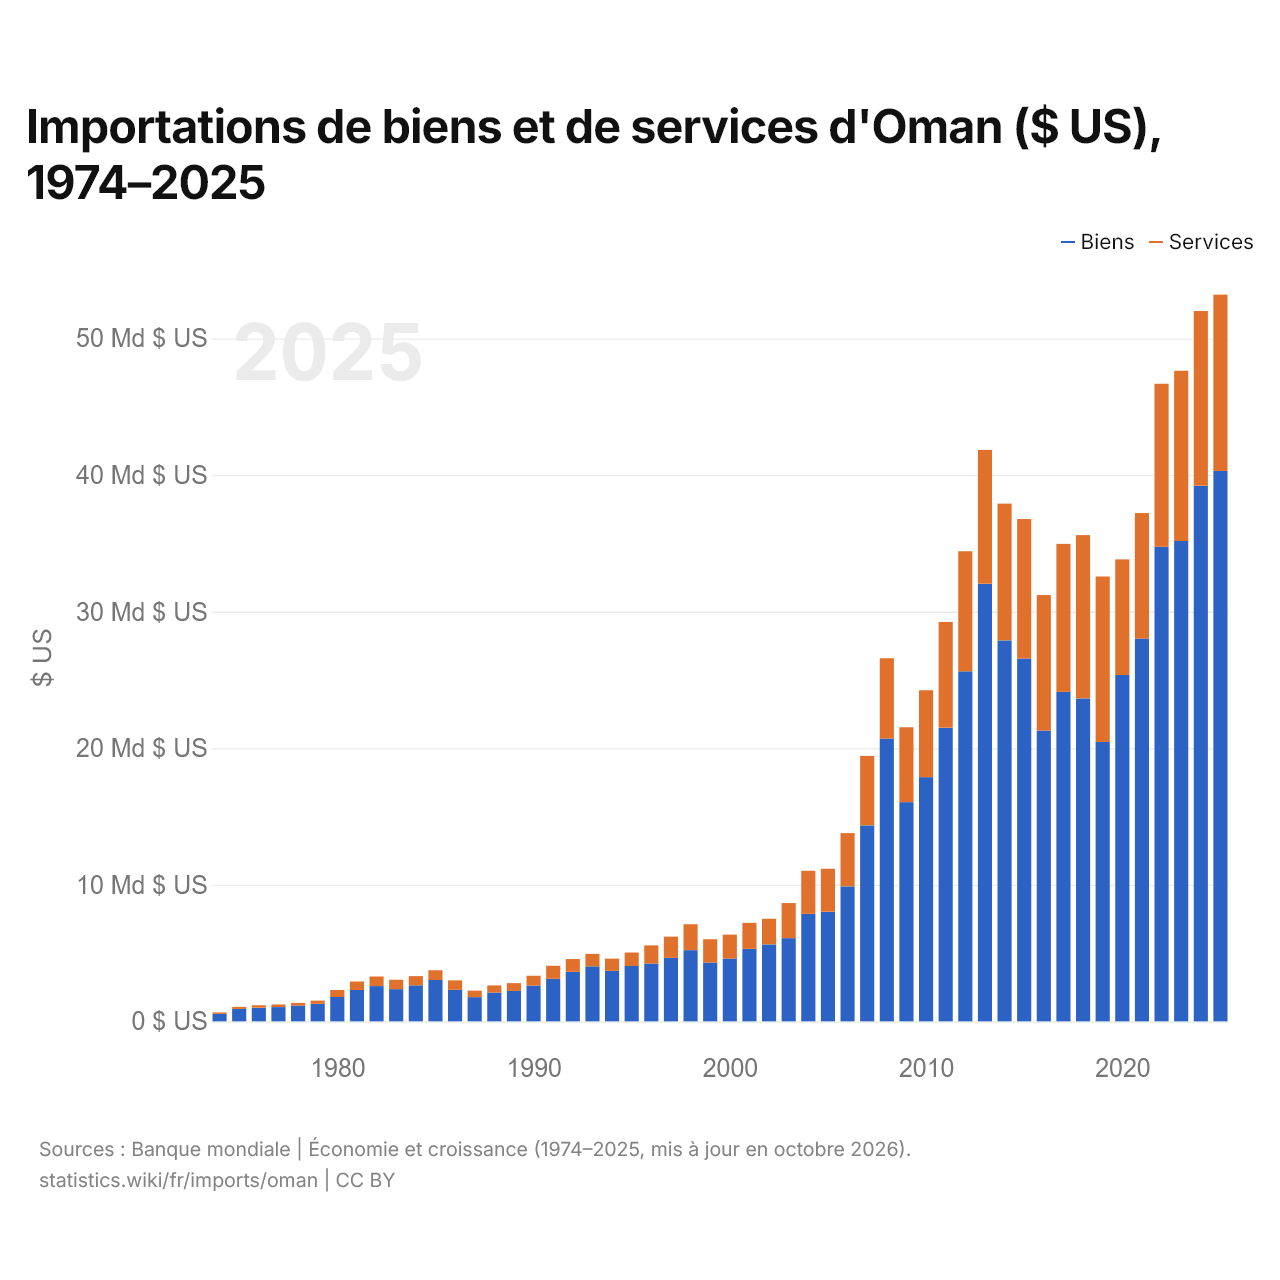
Importations de biens et de services d'Oman ($ US), 1974–2025
| Année | $ US | |
|---|---|---|
| Biens | Services | |
| 2025 | 40 300 603 965 $ US | 12 905 337 171 $ US |
| 2024 | 39 221 108 836 $ US | 12 792 025 896 $ US |
| 2023 | 35 169 193 758 $ US | 12 463 273 463 $ US |
| 2022 | 34 747 048 438 $ US | 11 934 572 538 $ US |
| 2021 | 28 023 772 993 $ US | 9 191 964 458 $ US |
| 2020 | 25 364 089 924 $ US | 8 463 005 417 $ US |
| 2019 | 20 456 783 394 $ US | 12 111 771 857 $ US |
| 2018 | 23 646 293 888 $ US | 11 954 118 375 $ US |
| 2017 | 24 121 339 458 $ US | 10 839 067 630 $ US |
| 2016 | 21 286 568 270 $ US | 9 923 117 612 $ US |
| 2015 | 26 563 679 142 $ US | 10 213 551 286 $ US |
| 2014 | 27 889 070 221 $ US | 10 013 656 597 $ US |
| 2013 | 32 043 088 583 $ US | 9 798 009 338 $ US |
| 2012 | 25 628 889 467 $ US | 8 785 439 815 $ US |
| 2011 | 21 496 759 428 $ US | 7 739 991 625 $ US |
| 2010 | 17 874 395 319 $ US | 6 363 089 727 $ US |
| 2009 | 16 051 807 542 $ US | 5 483 508 453 $ US |
| 2008 | 20 707 204 161 $ US | 5 880 387 516 $ US |
| 2007 | 14 343 276 983 $ US | 5 094 431 730 $ US |
| 2006 | 9 881 079 324 $ US | 3 899 373 212 $ US |
| 2005 | 8 028 608 583 $ US | 3 145 487 646 $ US |
| 2004 | 7 872 561 769 $ US | 3 152 301 691 $ US |
| 2003 | 6 085 825 748 $ US | 2 573 211 964 $ US |
| 2002 | 5 633 289 987 $ US | 1 880 104 031 $ US |
| 2001 | 5 308 192 458 $ US | 1 899 089 727 $ US |
| 2000 | 4 593 000 000 $ US | 1 758 498 700 $ US |
| 1999 | 4 298 999 972 $ US | 1 713 499 989 $ US |
| 1998 | 5 212 999 966 $ US | 1 891 099 988 $ US |
| 1997 | 4 644 999 940 $ US | 1 555 599 980 $ US |
| 1996 | 4 230 999 945 $ US | 1 328 099 983 $ US |
| 1995 | 4 049 934 980 $ US | 985 175 553 $ US |
| 1994 | 3 693 107 932 $ US | 900 130 039 $ US |
| 1993 | 4 029 908 973 $ US | 906 371 912 $ US |
| 1992 | 3 626 788 036 $ US | 932 379 714 $ US |
| 1991 | 3 111 833 550 $ US | 960 988 296 $ US |
| 1990 | 2 623 407 022 $ US | 718 595 579 $ US |
| 1989 | 2 225 487 646 $ US | 570 351 105 $ US |
| 1988 | 2 106 631 990 $ US | 522 756 827 $ US |
| 1987 | 1 768 530 559 $ US | 481 144 343 $ US |
| 1986 | 2 309 009 829 $ US | 688 514 269 $ US |
| 1985 | 3 027 837 693 $ US | 712 807 076 $ US |
| 1984 | 2 639 567 458 $ US | 672 558 430 $ US |
| 1983 | 2 360 451 657 $ US | 687 898 091 $ US |
| 1982 | 2 582 513 036 $ US | 700 926 464 $ US |
| 1981 | 2 296 178 351 $ US | 620 440 071 $ US |
| 1980 | 1 779 965 263 $ US | 517 660 685 $ US |
| 1979 | 1 285 176 611 $ US | 234 800 232 $ US |
| 1978 | 1 157 209 036 $ US | 193 109 439 $ US |
| 1977 | 1 044 006 951 $ US | 185 871 454 $ US |
| 1976 | 1 000 000 003 $ US | 176 896 353 $ US |
| 1975 | 907 932 834 $ US | 154 892 878 $ US |
| 1974 | 551 534 454 $ US | 103 647 945 $ US |
En 2025, les importations de biens d'Oman s'élevaient à 40,3 milliards de dollars et celles de services à 12,9 milliards de dollars ; les services représentaient 24,3 % du total, contre 15,8 % en 1974.
Oman dans le classement mondial des importations, 2025
| Rang | Pays | Importations | Part mondiale | |
|---|---|---|---|---|
| 64 |
 Slovénie |
58,4 Md $US | 0,17 % | |
| 65 |
 Croatie |
55,7 Md $US | 0,17 % | |
| 66 |
 Biélorussie |
53,3 Md $US | 0,16 % | |
| 67 |
 Oman |
53,2 Md $US | 0,16 % | |
| 68 |
 Ouzbékistan |
52,0 Md $US | 0,15 % | |
| 69 |
 RDC |
40,0 Md $US | 0,12 % | |
| 70 |
 Guatemala |
38,2 Md $US | 0,11 % |
Importations de biens et services d'Oman, % du PIB, 1967–2025
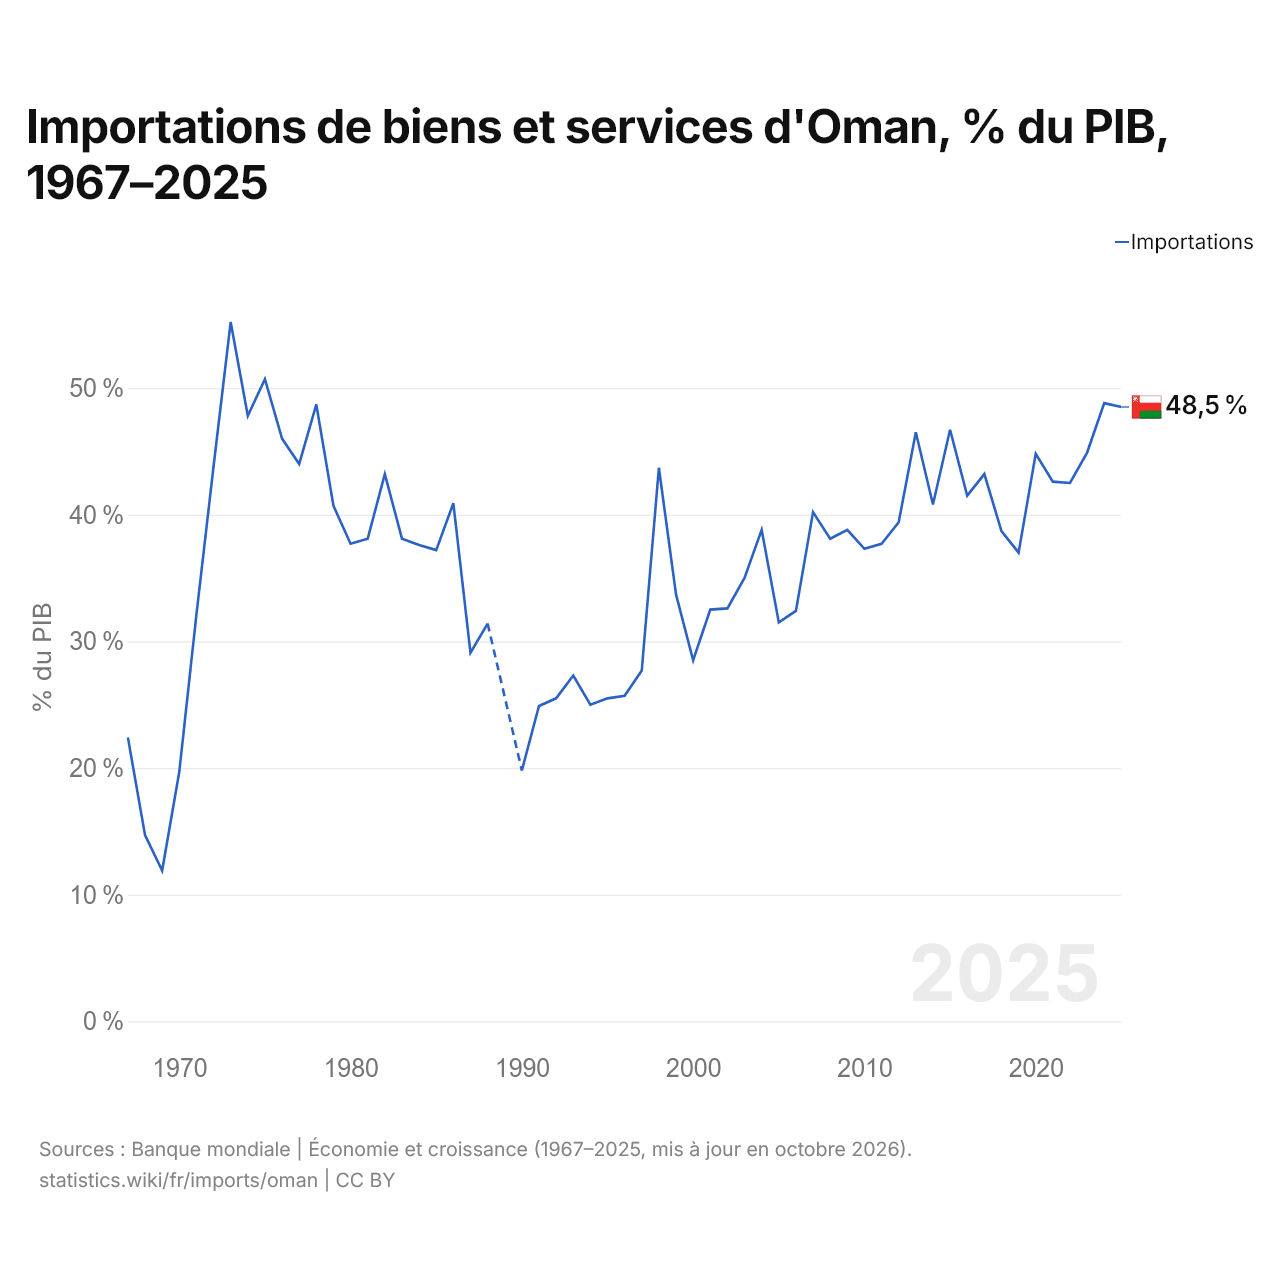
En 2025, les importations de biens et services d'Oman équivalaient à 48,5 % de son PIB, contre 22,4 % en 1967. La part la plus élevée a été de 55,2 %, en 1973.
Comparer les importations d'Oman avec celles d'autres pays
Sources :
- TradeMap (2001–2025, mis à jour en octobre 2026)
- Banque mondiale | Économie et croissance (1967–2025, mis à jour en octobre 2026)
Creative Commons Attribution (CC BY) : vous pouvez copier, partager, adapter et réutiliser ce contenu, y compris à des fins commerciales, à condition de citer statistics.wiki et d’indiquer les modifications apportées. Les sources citées ci-dessus peuvent avoir leurs propres conditions de licence.