
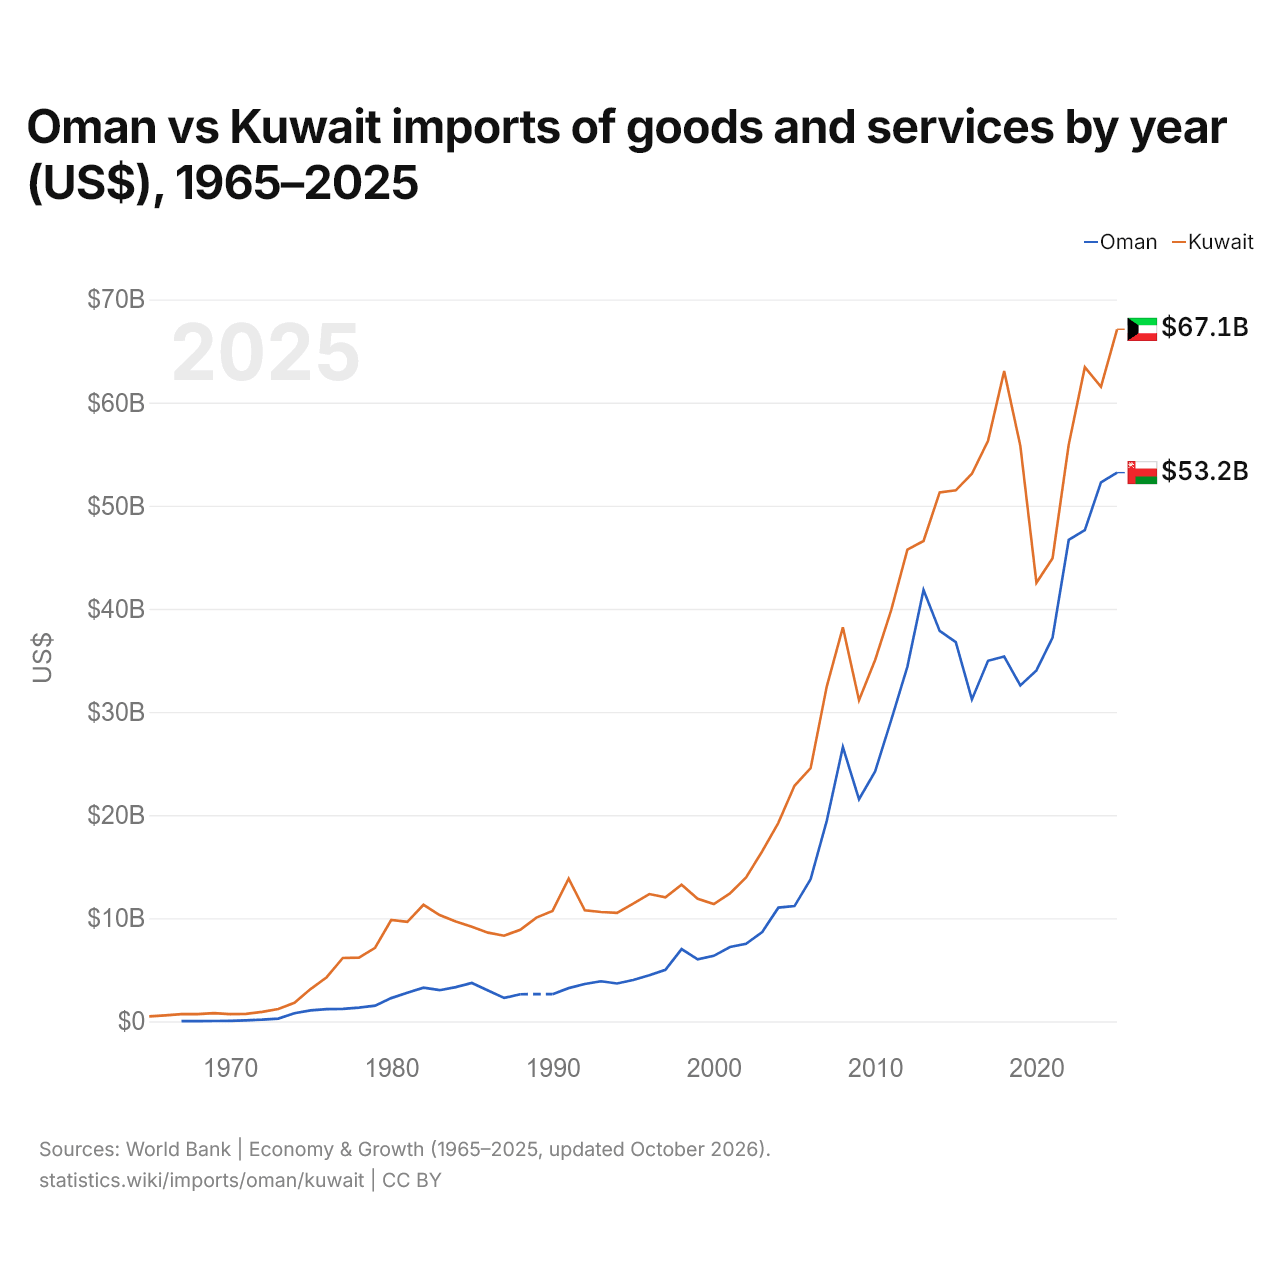
Oman vs Koweït : importations de biens et services par année ($ US), 1965–2025
1x
| Année | $ US | |
|---|---|---|
 Oman |
 Koweït |
|
| 2025 | 53 205 941 136 $ US | 67 106 804 066 $ US |
| 2024 | 52 261 638 492 $ US | 61 521 205 383 $ US |
| 2023 | 47 632 509 753 $ US | 63 425 622 996 $ US |
| 2022 | 46 681 404 421 $ US | 55 913 469 388 $ US |
| 2021 | 37 217 165 150 $ US | 44 912 694 808 $ US |
| 2020 | 34 023 407 022 $ US | 42 529 707 772 $ US |
| 2019 | 32 569 570 871 $ US | 55 817 806 338 $ US |
| 2018 | 35 373 211 964 $ US | 63 048 258 687 $ US |
| 2017 | 34 959 687 906 $ US | 56 293 171 254 $ US |
| 2016 | 31 211 963 589 $ US | 53 090 012 147 $ US |
| 2015 | 36 777 633 290 $ US | 51 488 579 434 $ US |
| 2014 | 37 856 957 087 $ US | 51 286 394 768 $ US |
| 2013 | 41 830 949 285 $ US | 46 580 345 500 $ US |
| 2012 | 34 397 919 376 $ US | 45 739 026 063 $ US |
| 2011 | 29 235 370 611 $ US | 39 894 339 787 $ US |
| 2010 | 24 236 671 001 $ US | 35 034 036 154 $ US |
| 2009 | 21 537 061 118 $ US | 31 130 878 955 $ US |
| 2008 | 26 587 776 333 $ US | 38 206 585 624 $ US |
| 2007 | 19 440 832 250 $ US | 32 461 455 101 $ US |
| 2006 | 13 778 933 680 $ US | 24 543 725 187 $ US |
| 2005 | 11 172 951 886 $ US | 22 839 041 096 $ US |
| 2004 | 11 024 707 412 $ US | 19 246 691 551 $ US |
| 2003 | 8 657 997 399 $ US | 16 499 335 597 $ US |
| 2002 | 7 513 654 096 $ US | 13 961 186 388 $ US |
| 2001 | 7 209 362 809 $ US | 12 400 466 933 $ US |
| 2000 | 6 351 105 332 $ US | 11 370 749 009 $ US |
| 1999 | 6 013 003 901 $ US | 11 878 521 098 $ US |
| 1998 | 7 003 901 170 $ US | 13 256 506 845 $ US |
| 1997 | 4 993 498 049 $ US | 12 015 862 917 $ US |
| 1996 | 4 468 140 442 $ US | 12 340 978 394 $ US |
| 1995 | 4 010 403 121 $ US | 11 409 022 677 $ US |
| 1994 | 3 672 301 691 $ US | 10 518 518 519 $ US |
| 1993 | 3 882 964 889 $ US | 10 602 648 675 $ US |
| 1992 | 3 615 084 525 $ US | 10 766 871 506 $ US |
| 1991 | 3 219 765 930 $ US | 13 840 763 854 $ US |
| 1990 | 2 634 590 377 $ US | 10 701 388 542 $ US |
| 1989 | - | 10 058 581 791 $ US |
| 1988 | 2 629 388 817 $ US | 8 884 381 552 $ US |
| 1987 | 2 270 480 884 $ US | 8 303 936 655 $ US |
| 1986 | 2 997 523 182 $ US | 8 596 155 818 $ US |
| 1985 | 3 720 377 828 $ US | 9 166 990 520 $ US |
| 1984 | 3 315 025 608 $ US | 9 687 160 122 $ US |
| 1983 | 3 019 687 319 $ US | 10 300 332 102 $ US |
| 1982 | 3 259 988 419 $ US | 11 298 630 132 $ US |
| 1981 | 2 764 910 539 $ US | 9 641 838 693 $ US |
| 1980 | 2 252 461 204 $ US | 9 822 528 922 $ US |
| 1979 | 1 519 976 549 $ US | 7 131 847 261 $ US |
| 1978 | 1 335 263 173 $ US | 6 180 627 006 $ US |
| 1977 | 1 207 295 599 $ US | 6 141 691 617 $ US |
| 1976 | 1 176 896 642 $ US | 4 275 155 872 $ US |
| 1975 | 1 062 826 288 $ US | 3 127 241 132 $ US |
| 1974 | 786 045 165 $ US | 1 800 437 317 $ US |
| 1973 | 266 627 884 $ US | 1 199 034 299 $ US |
| 1972 | 160 511 552 $ US | 919 595 439 $ US |
| 1971 | 96 727 623 $ US | 724 238 833 $ US |
| 1970 | 50 399 960 $ US | 692 999 723 $ US |
| 1969 | 28 559 977 $ US | 800 799 680 $ US |
| 1968 | 27 839 978 $ US | 694 399 722 $ US |
| 1967 | 24 026 313 $ US | 694 399 722 $ US |
| 1966 | - | 582 399 767 $ US |
| 1965 | - | 484 399 806 $ US |
En 2025, les importations de biens et services d'Oman s'élevaient à 53,2 milliards de dollars et celles du Koweït à 67,1 milliards de dollars : celles du Koweït étaient supérieures de 26 %. En 1967, les importations du Koweït étaient 29 fois plus élevées : 24 millions de dollars pour Oman et 694 millions de dollars pour le Koweït.
Oman vs Koweït : chiffres des importations
|
Oman
|
Koweït
|
|
|---|---|---|
| Importations | 53,2 Md $US (2025) | 67,1 Md $US (2025) |
| Rang mondial | 67/174 | 59/174 |
| Part mondiale | 0,16 % | 0,2 % |
| % du PIB | 48,5 % | 42,7 % |
| Première catégorie de biens | Machines, électronique et véhicules (30,8 %, 2025) | Machines, électronique et véhicules (37,1 %, 2025) |
| Première origine des biens | Chine (16,3 %, 2025) | Chine (20,6 %, 2025) |
Comparer les importations de 2 pays au choix
Sources :
- Banque mondiale | Économie et croissance (1965–2025, mis à jour en octobre 2026)
- TradeMap (2001–2025, mis à jour en octobre 2026)
Creative Commons Attribution (CC BY) : vous pouvez copier, partager, adapter et réutiliser ce contenu, y compris à des fins commerciales, à condition de citer statistics.wiki et d’indiquer les modifications apportées. Les sources citées ci-dessus peuvent avoir leurs propres conditions de licence.