
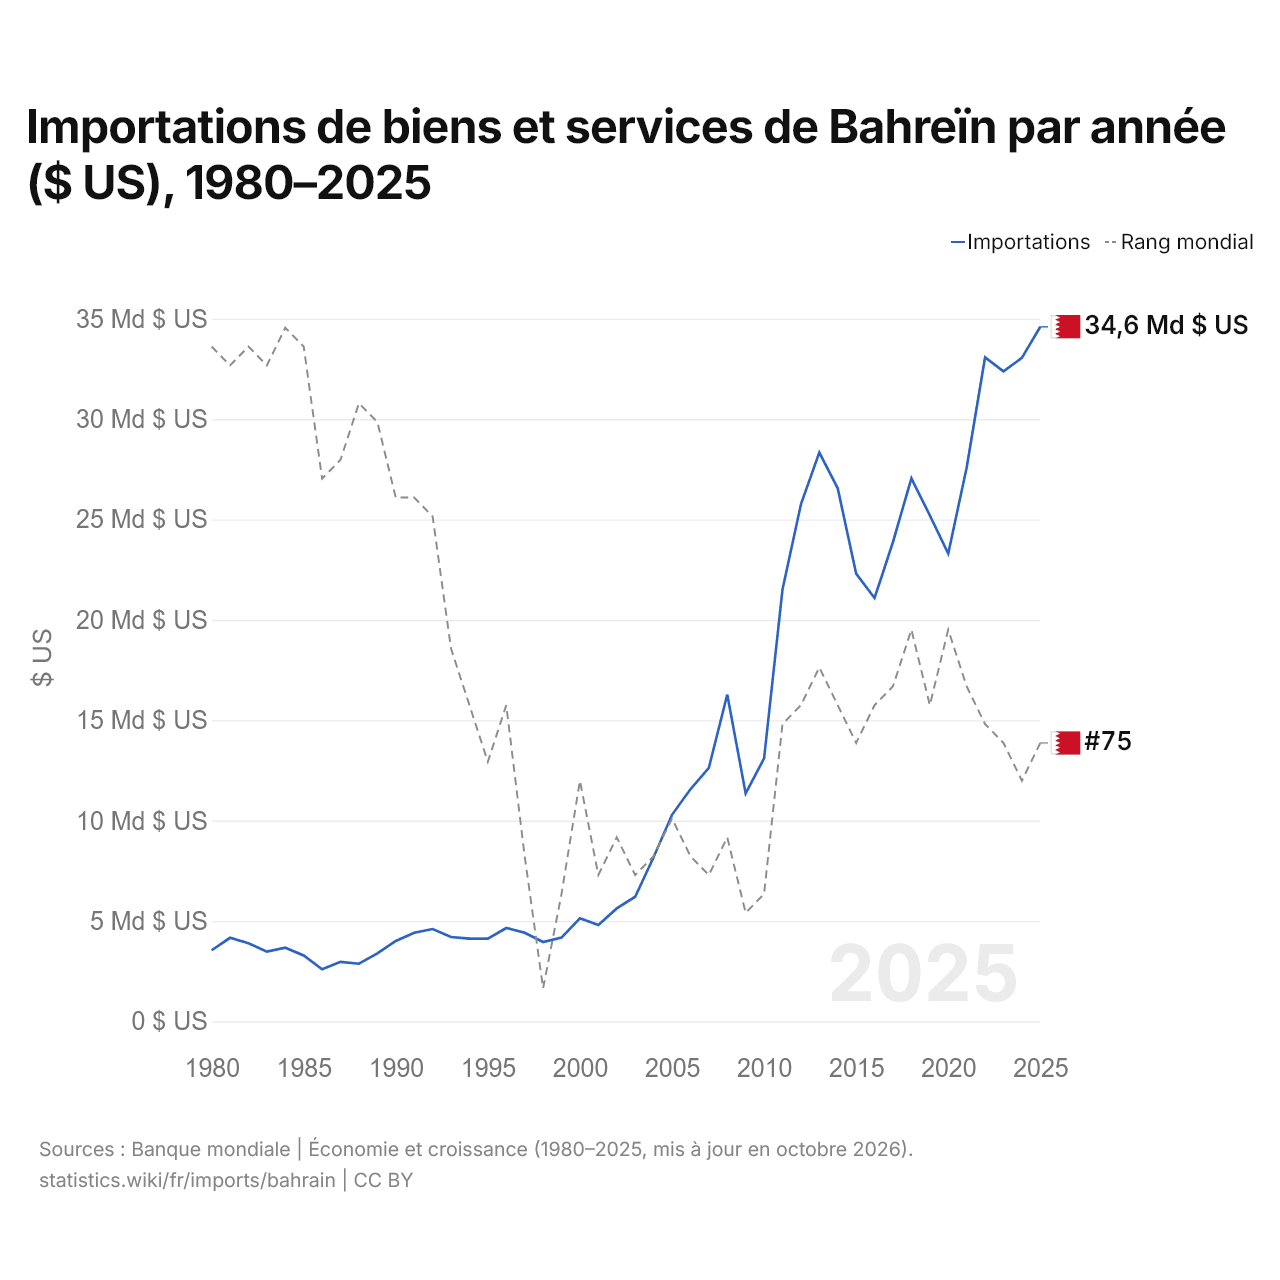
Importations de biens et services de Bahreïn par année ($ US), 1980–2025
| Année | $ US | Rang mondial |
|---|---|---|
| Importations | Rang mondial | |
| 2025 | 34 595 398 936 $ US | #75 |
| 2024 | 33 044 414 894 $ US | #77 |
| 2023 | 32 379 255 319 $ US | #75 |
| 2022 | 33 068 882 979 $ US | #74 |
| 2021 | 27 577 393 617 $ US | #72 |
| 2020 | 23 296 808 511 $ US | #69 |
| 2019 | 25 207 712 766 $ US | #73 |
| 2018 | 27 048 670 213 $ US | #69 |
| 2017 | 23 876 329 787 $ US | #72 |
| 2016 | 21 088 031 915 $ US | #73 |
| 2015 | 22 301 861 702 $ US | #75 |
| 2014 | 26 548 936 170 $ US | #73 |
| 2013 | 28 331 382 979 $ US | #71 |
| 2012 | 25 749 202 128 $ US | #73 |
| 2011 | 21 506 648 936 $ US | #74 |
| 2010 | 13 097 074 468 $ US | #83 |
| 2009 | 11 353 989 362 $ US | #84 |
| 2008 | 16 276 329 787 $ US | #80 |
| 2007 | 12 626 329 787 $ US | #82 |
| 2006 | 11 559 042 553 $ US | #81 |
| 2005 | 10 286 968 085 $ US | #79 |
| 2004 | 8 170 478 723 $ US | #81 |
| 2003 | 6 205 053 191 $ US | #82 |
| 2002 | 5 624 202 128 $ US | #80 |
| 2001 | 4 794 680 851 $ US | #82 |
| 2000 | 5 132 180 851 $ US | #77 |
| 1999 | 4 168 882 979 $ US | #83 |
| 1998 | 3 950 532 181 $ US | #88 |
| 1997 | 4 413 031 915 $ US | #81 |
| 1996 | 4 649 734 043 $ US | #73 |
| 1995 | 4 122 340 426 $ US | #76 |
| 1994 | 4 119 148 936 $ US | #73 |
| 1993 | 4 198 138 298 $ US | #70 |
| 1992 | 4 596 276 330 $ US | #63 |
| 1991 | 4 414 893 617 $ US | #62 |
| 1990 | 4 001 596 011 $ US | #62 |
| 1989 | 3 385 638 032 $ US | #58 |
| 1988 | 2 869 148 936 $ US | #57 |
| 1987 | 2 964 627 660 $ US | #60 |
| 1986 | 2 588 829 787 $ US | #61 |
| 1985 | 3 280 851 064 $ US | #54 |
| 1984 | 3 665 159 574 $ US | #53 |
| 1983 | 3 471 808 777 $ US | #55 |
| 1982 | 3 892 819 149 $ US | #54 |
| 1981 | 4 161 702 128 $ US | #55 |
| 1980 | 3 540 992 040 $ US | #54 |
En 2025, les importations de biens et services de Bahreïn s'élevaient à 34,6 milliards de dollars, contre 3,54 milliards de dollars en 1980. Le minimum a été de 2,59 milliards de dollars, en 1986. Elles se classaient au 75e rang mondial, en hausse par rapport au 77e rang en 2024. Leur meilleur rang a été le 53e, occupé pour la dernière fois en 1984.
En 2025, les importations de biens et services de Bahreïn étaient les 25es plus élevées de 44 pays situés en Asie (à égalité avec le Cambodge). En 2025, les exportations de Bahreïn dépassaient ses importations de 8,81 milliards de dollars, soit un excédent commercial. Le commerce de Bahreïn, exportations et importations réunies, équivalait à 159,3 % de son PIB en 2025, au 14e rang mondial.
Importations de biens de Bahreïn par catégorie, 2025
Importations de biens, 2025: 23,3 Md $US
En 2025, la première catégorie des importations de biens de Bahreïn était « pétrole, gaz, minerais et autres matières premières », avec 46,0 %, suivie de « machines, électronique et véhicules », avec 22,8 %.
Origines des importations de biens de Bahreïn : les 10 premières, 2025
| Rang | Pays | Importations de biens | Part | |
|---|---|---|---|---|
| 1 |
 Arabie saoudite |
7,75 Md $US | 33,3 % | |
| 2 |
 Chine |
2,35 Md $US | 10,1 % | |
| 3 |
 Australie |
1,55 Md $US | 6,64 % | |
| 4 |
 EAU |
1,43 Md $US | 6,14 % | vs EAU |
| 5 |
 Brésil |
1,18 Md $US | 5,04 % | |
| 6 |
 États-Unis |
1,03 Md $US | 4,42 % | |
| 7 |
 Inde |
786 M $US | 3,37 % | |
| 8 |
 Japon |
755 M $US | 3,24 % | |
| 9 |
 France |
711 M $US | 3,05 % | vs France |
| 10 |
 Allemagne |
538 M $US | 2,31 % | |
| Autres partenaires et non précisés | 5,22 Md $US | 22,4 % |
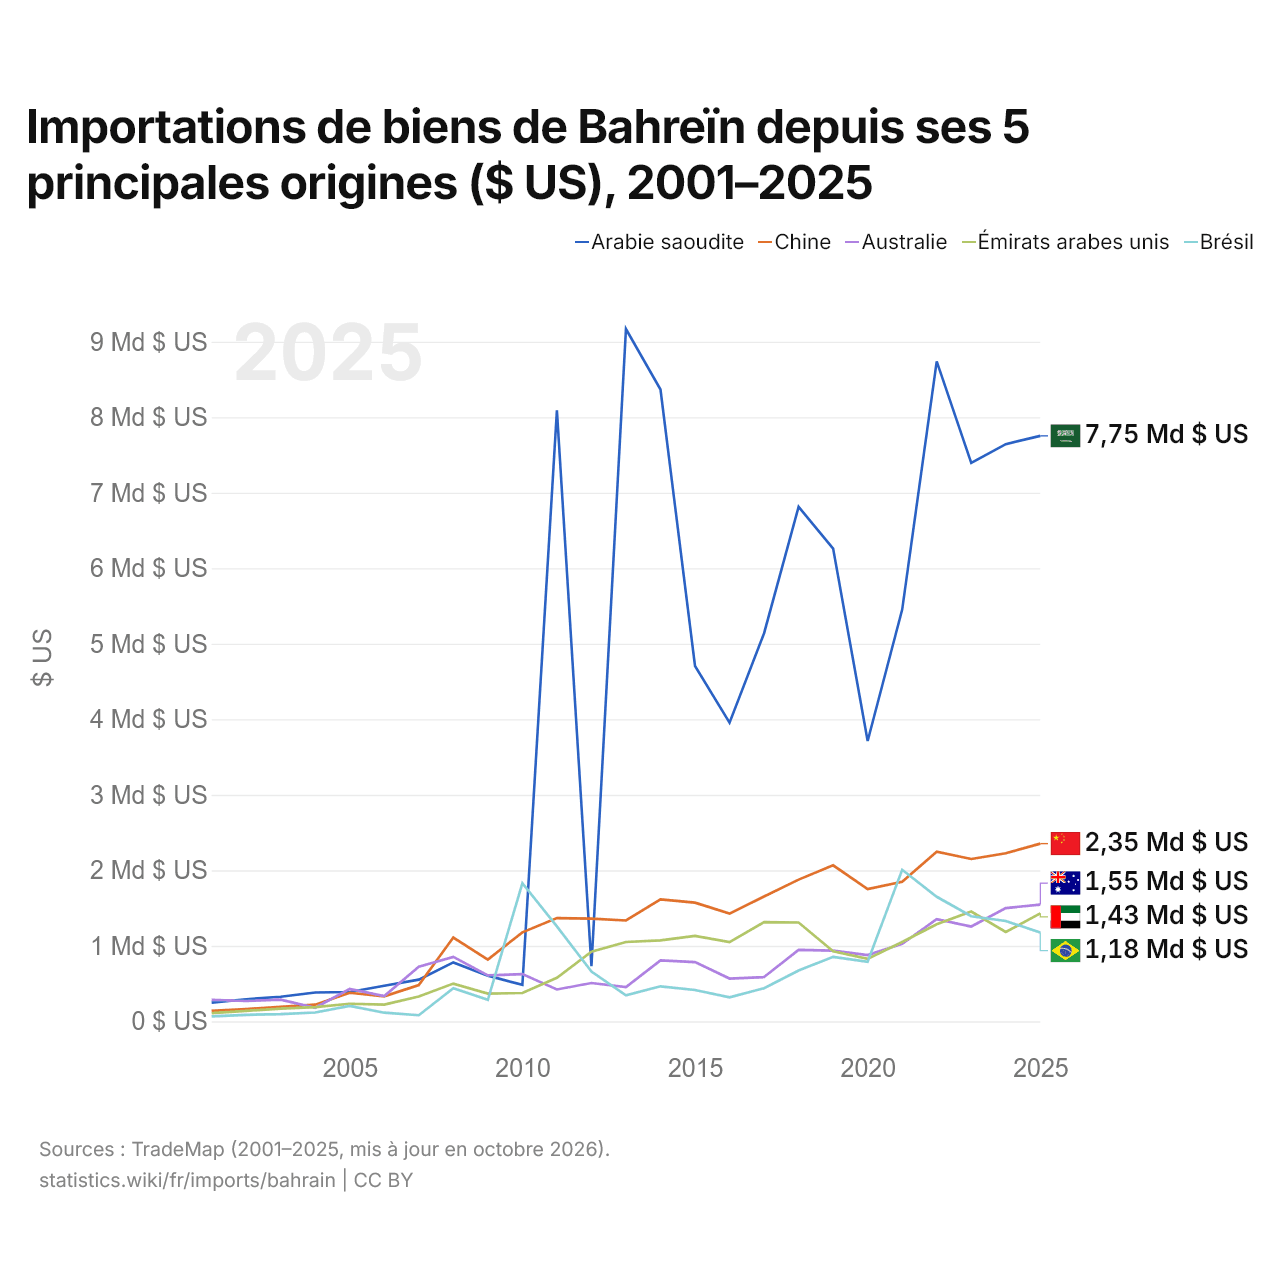
Importations de biens de Bahreïn depuis ses 5 principales origines ($ US), 2001–2025
| Année | $ US | ||||
|---|---|---|---|---|---|
| Arabie saoudite | Chine | Australie | Émirats arabes unis | Brésil | |
| 2025 | 7 753 443 000 $ US | 2 353 450 000 $ US | 1 546 058 000 $ US | 1 429 848 000 $ US | 1 175 392 000 $ US |
| 2024 | 7 643 091 000 $ US | 2 226 501 000 $ US | 1 500 217 000 $ US | 1 182 919 000 $ US | 1 329 428 000 $ US |
| 2023 | 7 394 291 000 $ US | 2 149 970 000 $ US | 1 255 601 000 $ US | 1 453 989 000 $ US | 1 391 606 000 $ US |
| 2022 | 8 739 921 000 $ US | 2 246 461 000 $ US | 1 352 874 000 $ US | 1 285 691 000 $ US | 1 649 250 000 $ US |
| 2021 | 5 452 803 000 $ US | 1 847 527 000 $ US | 1 026 802 000 $ US | 1 050 756 000 $ US | 2 006 839 000 $ US |
| 2020 | 3 712 303 000 $ US | 1 751 021 000 $ US | 878 070 000 $ US | 827 215 000 $ US | 787 951 000 $ US |
| 2019 | 6 260 210 000 $ US | 2 065 479 000 $ US | 936 866 000 $ US | 927 677 000 $ US | 854 081 000 $ US |
| 2018 | 6 813 520 000 $ US | 1 876 796 000 $ US | 945 281 000 $ US | 1 308 319 000 $ US | 672 082 000 $ US |
| 2017 | 5 139 869 000 $ US | 1 653 774 000 $ US | 586 327 000 $ US | 1 314 520 000 $ US | 438 757 000 $ US |
| 2016 | 3 954 938 000 $ US | 1 426 491 000 $ US | 566 549 000 $ US | 1 048 780 000 $ US | 316 747 000 $ US |
| 2015 | 4 706 523 000 $ US | 1 571 377 000 $ US | 785 083 000 $ US | 1 131 288 000 $ US | 414 299 000 $ US |
| 2014 | 8 367 389 000 $ US | 1 615 882 000 $ US | 806 470 000 $ US | 1 071 891 000 $ US | 463 766 000 $ US |
| 2013 | 9 168 084 000 $ US | 1 335 873 000 $ US | 453 474 000 $ US | 1 051 032 000 $ US | 343 661 000 $ US |
| 2012 | 730 472 000 $ US | 1 360 004 000 $ US | 507 812 000 $ US | 921 739 000 $ US | 659 874 000 $ US |
| 2011 | 8 090 864 000 $ US | 1 367 036 000 $ US | 422 005 000 $ US | 577 139 000 $ US | 1 257 981 000 $ US |
| 2010 | 483 624 000 $ US | 1 178 035 000 $ US | 626 102 000 $ US | 374 665 000 $ US | 1 828 591 000 $ US |
| 2009 | 604 838 000 $ US | 817 954 000 $ US | 607 882 000 $ US | 366 854 000 $ US | 284 181 000 $ US |
| 2008 | 780 366 000 $ US | 1 109 838 000 $ US | 853 453 000 $ US | 499 485 000 $ US | 439 793 000 $ US |
| 2007 | 552 189 000 $ US | 479 746 000 $ US | 724 729 000 $ US | 327 694 000 $ US | 80 989 000 $ US |
| 2006 | 470 627 000 $ US | 330 452 000 $ US | 333 685 000 $ US | 221 042 000 $ US | 114 457 000 $ US |
| 2005 | 388 477 000 $ US | 378 725 000 $ US | 429 518 000 $ US | 232 619 000 $ US | 203 873 000 $ US |
| 2004 | 381 896 000 $ US | 220 612 000 $ US | 180 164 000 $ US | 188 481 000 $ US | 117 180 000 $ US |
| 2003 | 325 302 000 $ US | 193 657 000 $ US | 286 575 000 $ US | 169 057 000 $ US | 95 089 000 $ US |
| 2002 | 292 171 000 $ US | 163 271 000 $ US | 268 996 000 $ US | 139 449 000 $ US | 85 893 000 $ US |
| 2001 | 247 316 000 $ US | 137 463 000 $ US | 284 306 000 $ US | 108 835 000 $ US | 66 697 000 $ US |
En 2025, les importations de biens s'élevaient à 7,75 milliards de dollars en provenance de l'Arabie saoudite, 2,35 milliards de dollars en provenance de la Chine, 1,55 milliard de dollars en provenance de l'Australie, 1,43 milliard de dollars en provenance des Émirats arabes unis et 1,18 milliard de dollars en provenance du Brésil. Le premier rang des cinq fournisseurs de Bahreïn est occupé par l'Arabie saoudite depuis 2013. Le changement le plus récent dans leur ordre remonte à 2025, quand les importations de Bahreïn en provenance des Émirats arabes unis ont dépassé celles en provenance du Brésil.
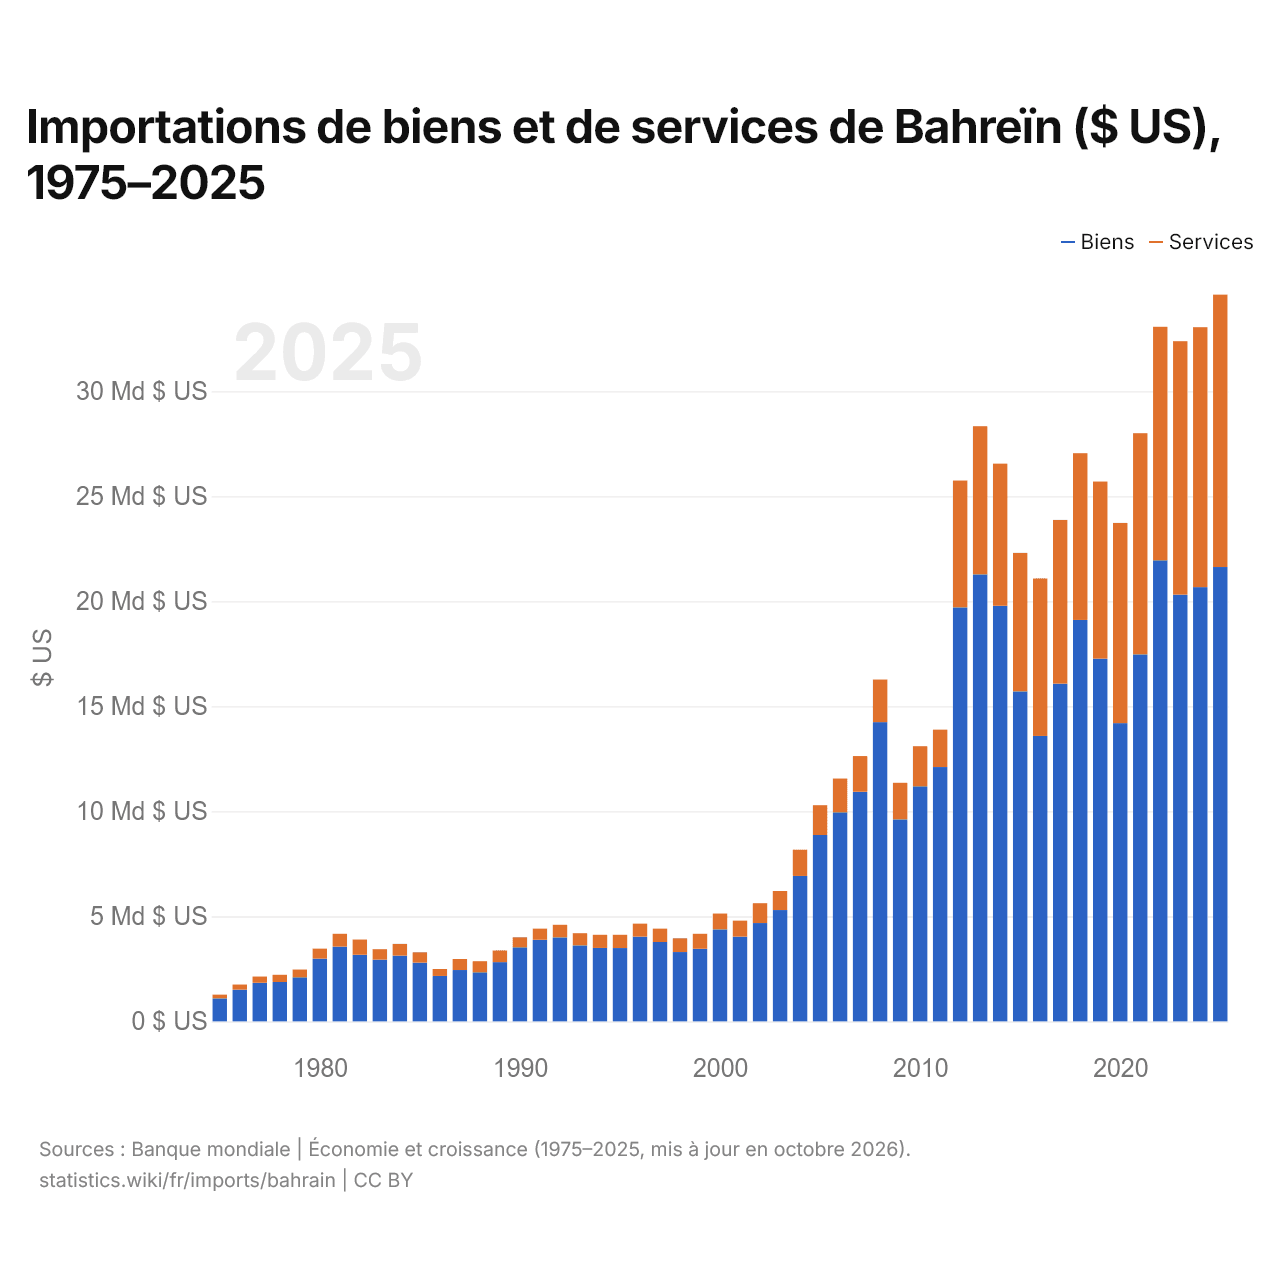
Importations de biens et de services de Bahreïn ($ US), 1975–2025
| Année | $ US | |
|---|---|---|
| Biens | Services | |
| 2025 | 21 628 377 660 $ US | 12 967 021 277 $ US |
| 2024 | 20 670 478 723 $ US | 12 373 936 170 $ US |
| 2023 | 20 310 904 255 $ US | 12 068 351 064 $ US |
| 2022 | 21 949 202 128 $ US | 11 117 287 234 $ US |
| 2021 | 17 464 361 702 $ US | 10 531 382 979 $ US |
| 2020 | 14 192 819 149 $ US | 9 535 106 383 $ US |
| 2019 | 17 263 297 872 $ US | 8 440 159 574 $ US |
| 2018 | 19 110 106 383 $ US | 7 938 563 830 $ US |
| 2017 | 16 076 063 830 $ US | 7 796 010 638 $ US |
| 2016 | 13 588 297 872 $ US | 7 499 734 043 $ US |
| 2015 | 15 709 574 468 $ US | 6 592 287 234 $ US |
| 2014 | 19 784 521 277 $ US | 6 764 414 894 $ US |
| 2013 | 21 280 053 191 $ US | 7 051 329 787 $ US |
| 2012 | 19 704 521 277 $ US | 6 044 680 851 $ US |
| 2011 | 12 105 851 064 $ US | 1 778 457 447 $ US |
| 2010 | 11 190 425 532 $ US | 1 905 053 191 $ US |
| 2009 | 9 613 031 915 $ US | 1 740 957 447 $ US |
| 2008 | 14 246 276 596 $ US | 2 030 053 191 $ US |
| 2007 | 10 925 398 936 $ US | 1 700 930 851 $ US |
| 2006 | 9 953 803 191 $ US | 1 605 239 362 $ US |
| 2005 | 8 870 744 681 $ US | 1 416 223 404 $ US |
| 2004 | 6 922 632 979 $ US | 1 247 797 766 $ US |
| 2003 | 5 298 377 660 $ US | 906 682 660 $ US |
| 2002 | 4 678 484 043 $ US | 945 395 266 $ US |
| 2001 | 4 029 095 745 $ US | 765 732 633 $ US |
| 2000 | 4 375 292 553 $ US | 756 759 707 $ US |
| 1999 | 3 452 606 574 $ US | 716 136 582 $ US |
| 1998 | 3 298 670 542 $ US | 651 861 767 $ US |
| 1997 | 3 778 191 841 $ US | 634 840 485 $ US |
| 1996 | 4 036 968 434 $ US | 612 766 010 $ US |
| 1995 | 3 488 298 143 $ US | 634 042 602 $ US |
| 1994 | 3 497 340 751 $ US | 621 808 569 $ US |
| 1993 | 3 616 223 508 $ US | 581 914 910 $ US |
| 1992 | 3 992 287 234 $ US | 603 989 362 $ US |
| 1991 | 3 880 585 106 $ US | 534 308 511 $ US |
| 1990 | 3 524 202 128 $ US | 474 468 085 $ US |
| 1989 | 2 820 212 766 $ US | 556 382 979 $ US |
| 1988 | 2 334 042 553 $ US | 529 255 319 $ US |
| 1987 | 2 442 287 234 $ US | 525 000 000 $ US |
| 1986 | 2 164 627 660 $ US | 327 127 660 $ US |
| 1985 | 2 796 010 638 $ US | 488 563 830 $ US |
| 1984 | 3 131 648 940 $ US | 555 053 192 $ US |
| 1983 | 2 935 638 306 $ US | 499 468 086 $ US |
| 1982 | 3 167 819 157 $ US | 729 787 236 $ US |
| 1981 | 3 559 308 520 $ US | 610 106 385 $ US |
| 1980 | 2 987 531 297 $ US | 473 739 758 $ US |
| 1979 | 2 094 767 671 $ US | 369 741 954 $ US |
| 1978 | 1 873 257 860 $ US | 342 750 956 $ US |
| 1977 | 1 836 977 131 $ US | 296 221 409 $ US |
| 1976 | 1 510 114 408 $ US | 243 175 437 $ US |
| 1975 | 1 090 012 645 $ US | 179 266 751 $ US |
En 2025, les importations de biens de Bahreïn s'élevaient à 21,6 milliards de dollars et celles de services à 13 milliards de dollars ; les services représentaient 37,5 % du total, contre 14,1 % en 1975.
Bahreïn dans le classement mondial des importations, 2025
| Rang | Pays | Importations | Part mondiale | |
|---|---|---|---|---|
| 72 |
 Estonie |
36,4 Md $US | 0,11 % | |
| 73 |
 Équateur |
36,4 Md $US | 0,11 % | |
| 74 |
 Rép. dominicaine |
35,5 Md $US | 0,11 % | |
| 75 |
 Bahreïn |
34,6 Md $US | 0,1 % | |
| 76 |
 Cambodge |
34,6 Md $US | 0,1 % | |
| 77 |
 Panama |
34,0 Md $US (2024) | 0,11 % | |
| 78 |
 Costa Rica |
33,6 Md $US | 0,1 % |
Importations de biens et services de Bahreïn, % du PIB, 1980–2025
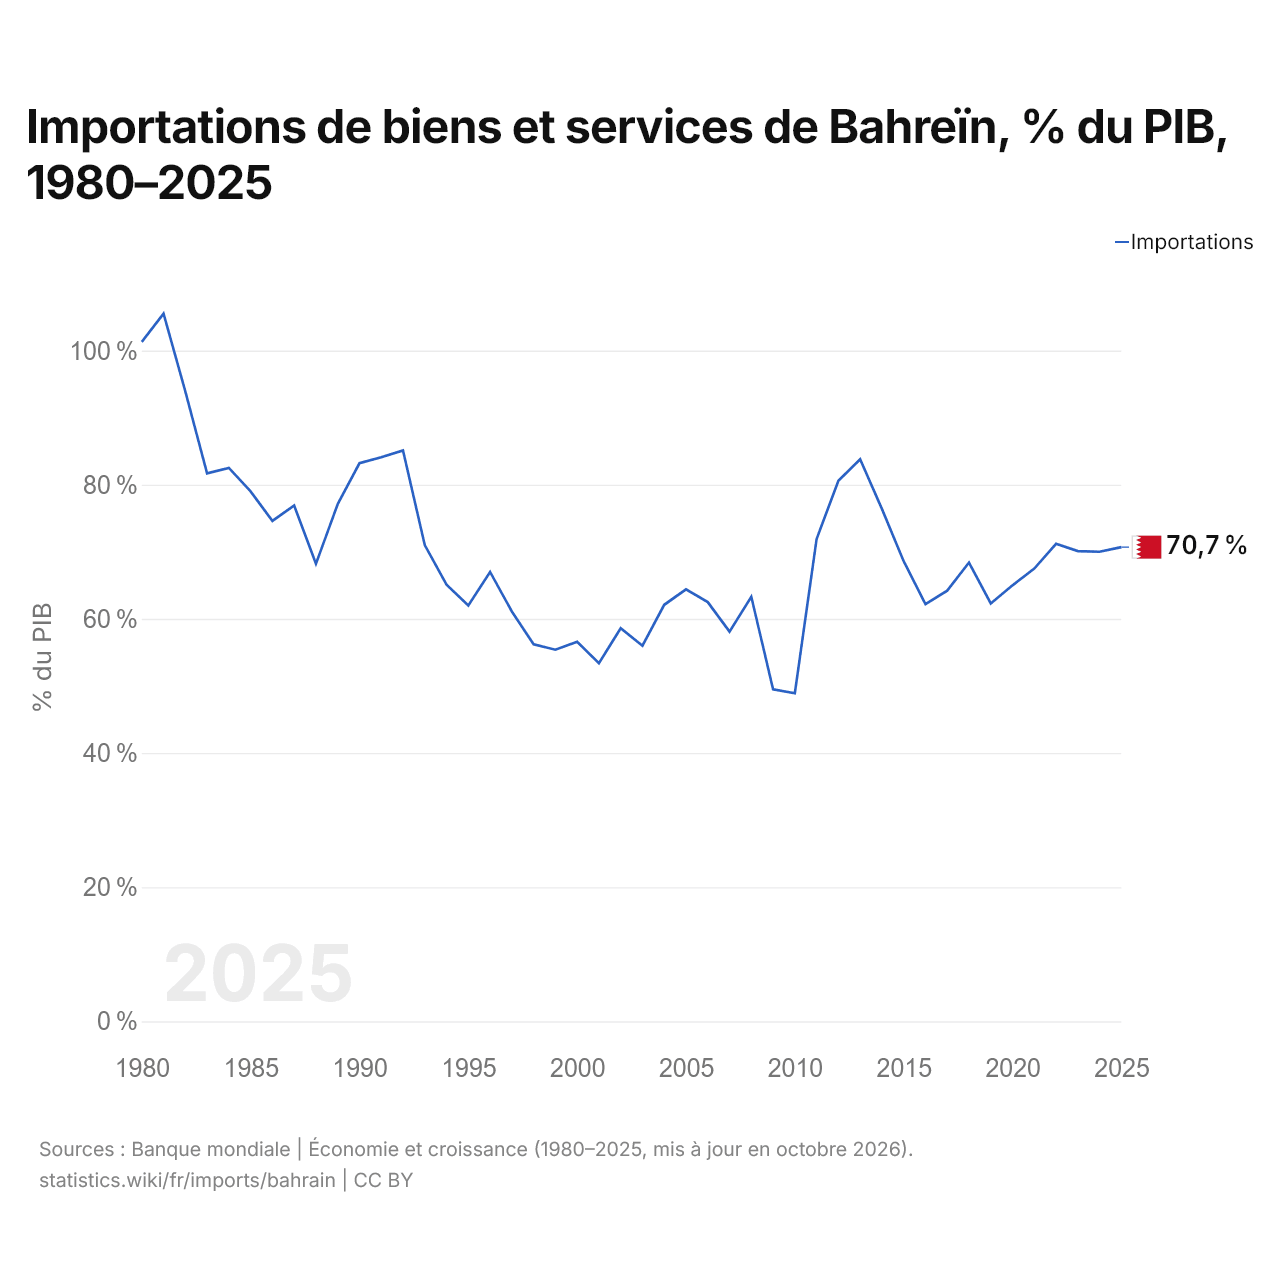
En 2025, les importations de biens et services de Bahreïn équivalaient à 70,7 % de son PIB, contre 101,3 % en 1980. La part la plus élevée a été de 105,5 %, en 1981.
Comparer les importations de Bahreïn avec celles d'autres pays
Sources :
- TradeMap (2001–2025, mis à jour en octobre 2026)
- Banque mondiale | Économie et croissance (1975–2025, mis à jour en octobre 2026)
Creative Commons Attribution (CC BY) : vous pouvez copier, partager, adapter et réutiliser ce contenu, y compris à des fins commerciales, à condition de citer statistics.wiki et d’indiquer les modifications apportées. Les sources citées ci-dessus peuvent avoir leurs propres conditions de licence.