
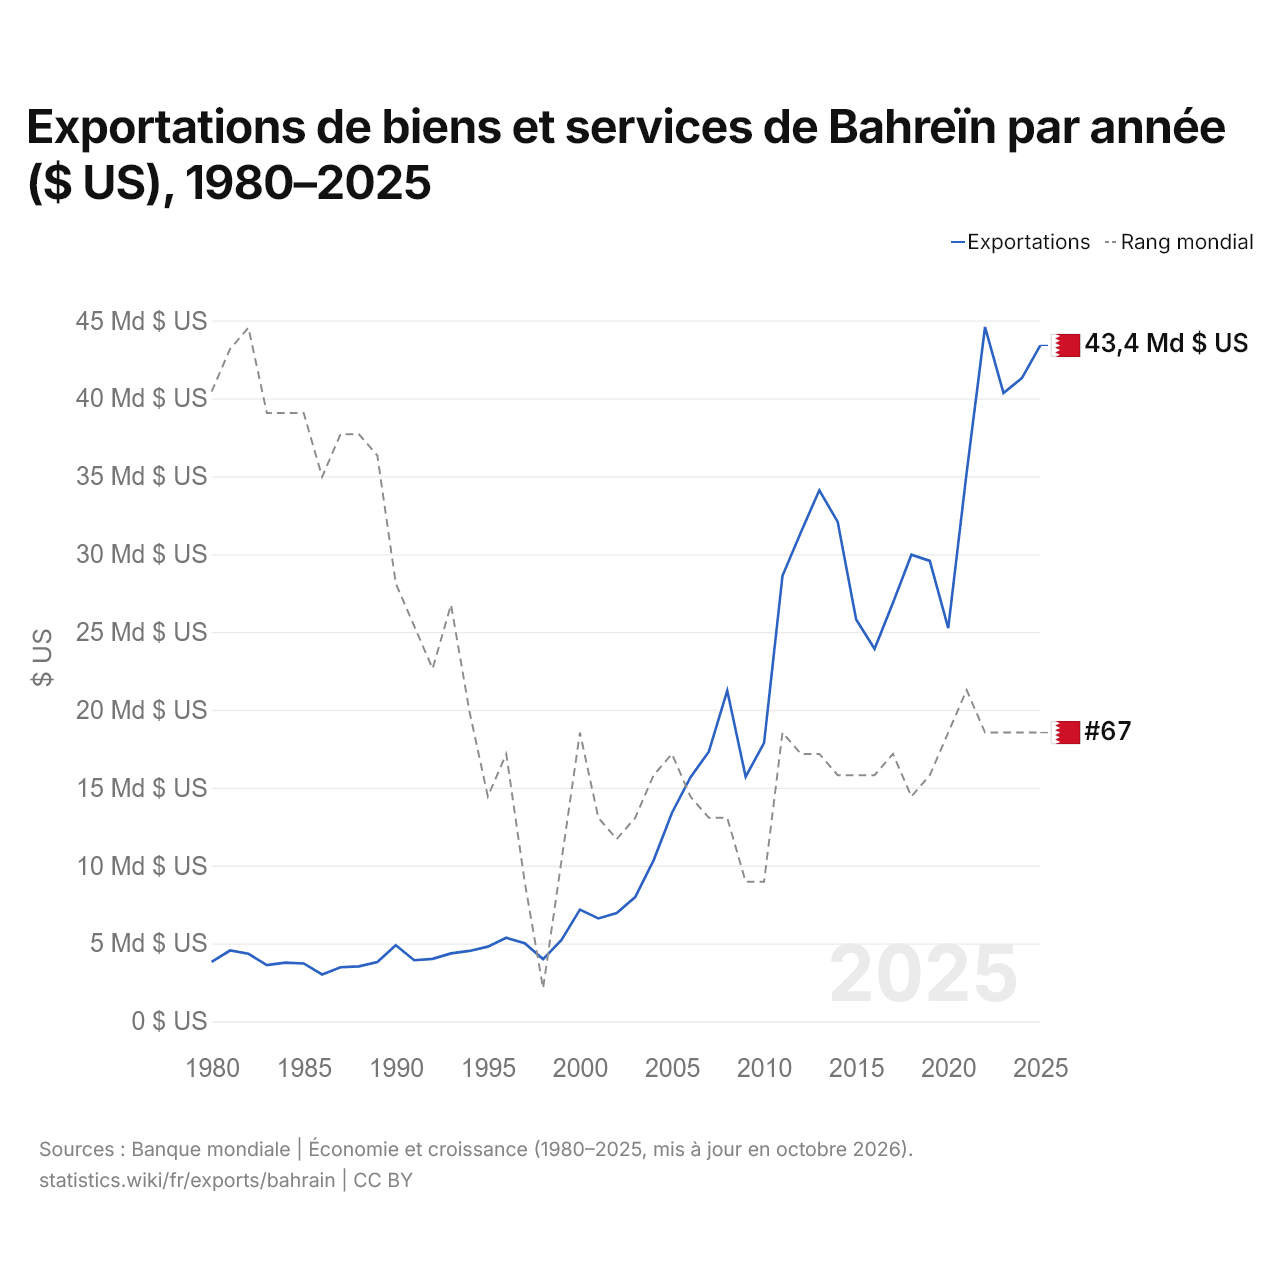
Exportations de biens et services de Bahreïn par année ($ US), 1980–2025
| Année | $ US | Rang mondial |
|---|---|---|
| Exportations | Rang mondial | |
| 2025 | 43 402 393 617 $ US | #67 |
| 2024 | 41 303 457 447 $ US | #67 |
| 2023 | 40 349 468 085 $ US | #67 |
| 2022 | 44 581 914 894 $ US | #67 |
| 2021 | 35 234 574 468 $ US | #65 |
| 2020 | 25 249 202 128 $ US | #67 |
| 2019 | 29 564 361 702 $ US | #69 |
| 2018 | 29 959 042 553 $ US | #70 |
| 2017 | 26 881 914 894 $ US | #68 |
| 2016 | 23 918 617 021 $ US | #69 |
| 2015 | 25 805 319 149 $ US | #69 |
| 2014 | 32 069 148 936 $ US | #69 |
| 2013 | 34 102 925 532 $ US | #68 |
| 2012 | 31 409 042 553 $ US | #68 |
| 2011 | 28 609 308 511 $ US | #67 |
| 2010 | 17 880 319 149 $ US | #74 |
| 2009 | 15 704 787 234 $ US | #74 |
| 2008 | 21 231 382 979 $ US | #71 |
| 2007 | 17 314 361 702 $ US | #71 |
| 2006 | 15 662 234 043 $ US | #70 |
| 2005 | 13 396 808 511 $ US | #68 |
| 2004 | 10 336 702 128 $ US | #69 |
| 2003 | 7 980 851 064 $ US | #71 |
| 2002 | 6 956 117 021 $ US | #72 |
| 2001 | 6 607 446 809 $ US | #71 |
| 2000 | 7 176 063 830 $ US | #67 |
| 1999 | 5 221 808 511 $ US | #73 |
| 1998 | 3 994 946 809 $ US | #79 |
| 1997 | 5 020 744 947 $ US | #74 |
| 1996 | 5 364 361 436 $ US | #68 |
| 1995 | 4 796 010 638 $ US | #70 |
| 1994 | 4 520 478 723 $ US | #66 |
| 1993 | 4 361 702 128 $ US | #61 |
| 1992 | 4 009 042 287 $ US | #64 |
| 1991 | 3 923 935 904 $ US | #62 |
| 1990 | 4 887 765 691 $ US | #60 |
| 1989 | 3 811 169 947 $ US | #54 |
| 1988 | 3 529 787 234 $ US | #53 |
| 1987 | 3 472 340 426 $ US | #53 |
| 1986 | 3 013 031 915 $ US | #55 |
| 1985 | 3 716 489 628 $ US | #52 |
| 1984 | 3 768 351 064 $ US | #52 |
| 1983 | 3 611 169 947 $ US | #52 |
| 1982 | 4 337 766 223 $ US | #48 |
| 1981 | 4 547 340 160 $ US | #49 |
| 1980 | 3 813 478 376 $ US | #51 |
En 2025, les exportations de biens et services de Bahreïn s'élevaient à 43,4 milliards de dollars, contre 3,81 milliards de dollars en 1980. Le maximum a été de 44,6 milliards de dollars, en 2022. Elles se classaient au 67e rang mondial, un rang qu'elles occupent depuis 2022. Leur meilleur rang a été le 48e, occupé pour la dernière fois en 1982.
En 2025, les exportations de biens et services de Bahreïn étaient les 23es plus élevées de 44 pays situés en Asie. Les importations de biens et services de Bahreïn s'élevaient à 34,6 milliards de dollars en 2025, au 75e rang mondial. En 2025, les exportations de Bahreïn dépassaient ses importations de 8,81 milliards de dollars, soit un excédent commercial.
Exportations de biens de Bahreïn par catégorie, 2025
Exportations de biens, 2025: 21,2 Md $US
En 2025, la première catégorie des exportations de biens de Bahreïn était « pétrole, gaz, minerais et autres matières premières », avec 48,6 %, suivie de « métaux communs (fer, acier, cuivre, aluminium) », avec 31,4 %.
Destinations des exportations de biens de Bahreïn : les 10 premières, 2025
| Rang | Pays | Exportations de biens | Part | |
|---|---|---|---|---|
| 1 |
 Arabie saoudite |
3,03 Md $US | 14,3 % | |
| 2 |
 EAU |
1,90 Md $US | 8,96 % | vs EAU |
| 3 |
 États-Unis |
1,07 Md $US | 5,03 % | |
| 4 |
 Pays-Bas |
524 M $US | 2,47 % | |
| 5 |
 Qatar |
485 M $US | 2,29 % | vs Qatar |
| 6 |
 Inde |
441 M $US | 2,08 % | |
| 7 |
 Italie |
411 M $US | 1,94 % | |
| 8 |
 Espagne |
383 M $US | 1,8 % | |
| 9 |
 Algérie |
335 M $US | 1,58 % | |
| 10 |
 Grèce |
303 M $US | 1,43 % | |
| Autres partenaires et non précisés | 12,3 Md $US | 58,2 % |
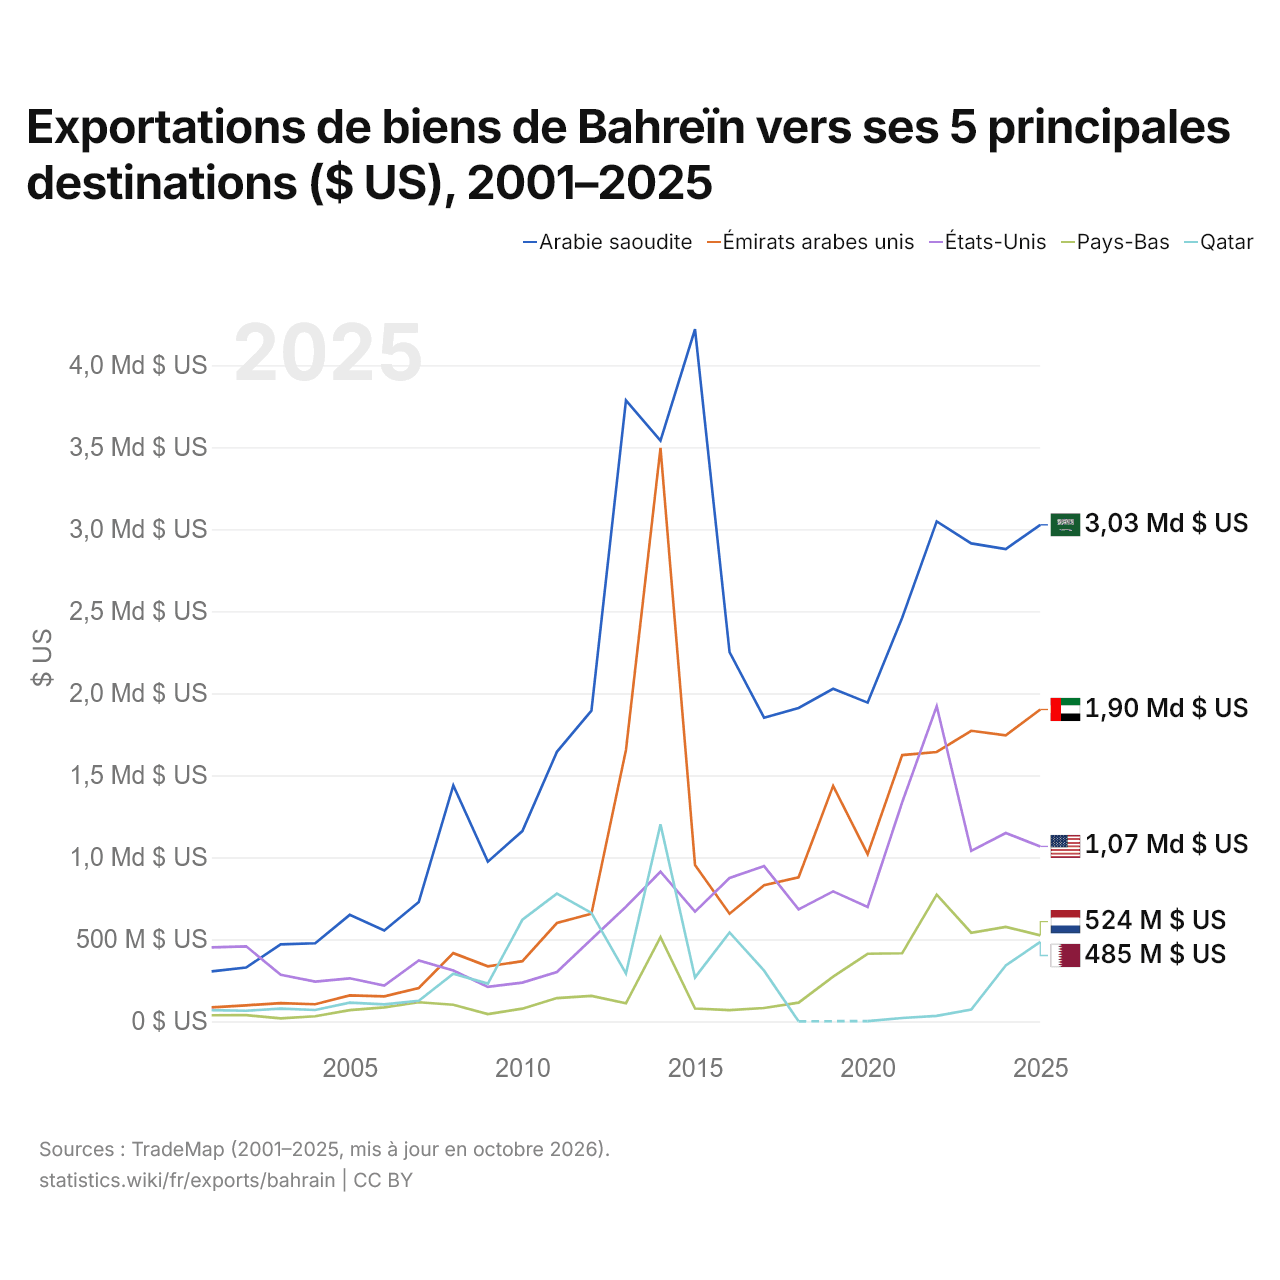
Exportations de biens de Bahreïn vers ses 5 principales destinations ($ US), 2001–2025
| Année | $ US | ||||
|---|---|---|---|---|---|
| Arabie saoudite | Émirats arabes unis | États-Unis | Pays-Bas | Qatar | |
| 2025 | 3 027 061 000 $ US | 1 901 084 000 $ US | 1 066 571 000 $ US | 524 085 000 $ US | 485 000 000 $ US |
| 2024 | 2 879 780 000 $ US | 1 743 394 000 $ US | 1 147 903 000 $ US | 575 889 000 $ US | 340 378 000 $ US |
| 2023 | 2 913 823 000 $ US | 1 771 326 000 $ US | 1 039 411 000 $ US | 539 837 000 $ US | 71 906 000 $ US |
| 2022 | 3 048 114 000 $ US | 1 642 291 000 $ US | 1 921 323 000 $ US | 772 510 000 $ US | 33 303 000 $ US |
| 2021 | 2 460 690 000 $ US | 1 623 377 000 $ US | 1 335 722 000 $ US | 415 125 000 $ US | 20 071 000 $ US |
| 2020 | 1 943 090 000 $ US | 1 019 173 000 $ US | 697 257 000 $ US | 411 931 000 $ US | 1 378 000 $ US |
| 2019 | 2 027 447 000 $ US | 1 435 559 000 $ US | 792 258 000 $ US | 272 650 000 $ US | - |
| 2018 | 1 910 685 000 $ US | 877 928 000 $ US | 682 596 000 $ US | 113 718 000 $ US | 8 000 $ US |
| 2017 | 1 851 208 000 $ US | 829 680 000 $ US | 946 880 000 $ US | 81 244 000 $ US | 309 083 000 $ US |
| 2016 | 2 251 480 000 $ US | 656 085 000 $ US | 874 287 000 $ US | 68 494 000 $ US | 541 843 000 $ US |
| 2015 | 4 219 382 000 $ US | 953 373 000 $ US | 668 621 000 $ US | 77 954 000 $ US | 267 573 000 $ US |
| 2014 | 3 540 320 000 $ US | 3 496 135 000 $ US | 912 272 000 $ US | 512 799 000 $ US | 1 200 778 000 $ US |
| 2013 | 3 786 414 000 $ US | 1 654 411 000 $ US | 698 280 000 $ US | 109 915 000 $ US | 291 565 000 $ US |
| 2012 | 1 894 264 000 $ US | 656 337 000 $ US | 499 889 000 $ US | 155 345 000 $ US | 660 937 000 $ US |
| 2011 | 1 643 085 000 $ US | 599 476 000 $ US | 301 092 000 $ US | 141 842 000 $ US | 778 246 000 $ US |
| 2010 | 1 159 643 000 $ US | 366 830 000 $ US | 236 284 000 $ US | 77 102 000 $ US | 619 447 000 $ US |
| 2009 | 973 410 000 $ US | 335 558 000 $ US | 209 990 000 $ US | 44 039 000 $ US | 229 904 000 $ US |
| 2008 | 1 438 877 000 $ US | 415 838 000 $ US | 309 561 000 $ US | 101 145 000 $ US | 289 819 000 $ US |
| 2007 | 727 467 000 $ US | 203 167 000 $ US | 370 988 000 $ US | 116 170 000 $ US | 125 117 000 $ US |
| 2006 | 553 619 000 $ US | 152 308 000 $ US | 218 576 000 $ US | 85 271 000 $ US | 103 803 000 $ US |
| 2005 | 649 015 000 $ US | 158 446 000 $ US | 262 274 000 $ US | 68 015 000 $ US | 114 000 000 $ US |
| 2004 | 476 232 000 $ US | 103 938 000 $ US | 242 119 000 $ US | 30 929 000 $ US | 68 957 000 $ US |
| 2003 | 468 951 000 $ US | 111 220 000 $ US | 284 092 000 $ US | 17 770 000 $ US | 77 712 000 $ US |
| 2002 | 327 950 000 $ US | 97 745 000 $ US | 457 458 000 $ US | 37 618 000 $ US | 64 692 000 $ US |
| 2001 | 304 662 000 $ US | 85 228 000 $ US | 450 777 000 $ US | 36 887 000 $ US | 68 644 000 $ US |
En 2025, les exportations de biens s'élevaient à 3,03 milliards de dollars vers l'Arabie saoudite, 1,9 milliard de dollars vers les Émirats arabes unis, 1,07 milliard de dollars vers les États-Unis, 524 millions de dollars vers les Pays-Bas et 485 millions de dollars vers le Qatar. Le premier rang des cinq destinations de Bahreïn est occupé par l'Arabie saoudite depuis 2003. Le changement le plus récent dans leur ordre remonte à 2023, quand les exportations de Bahreïn vers les Émirats arabes unis ont dépassé celles vers les États-Unis.
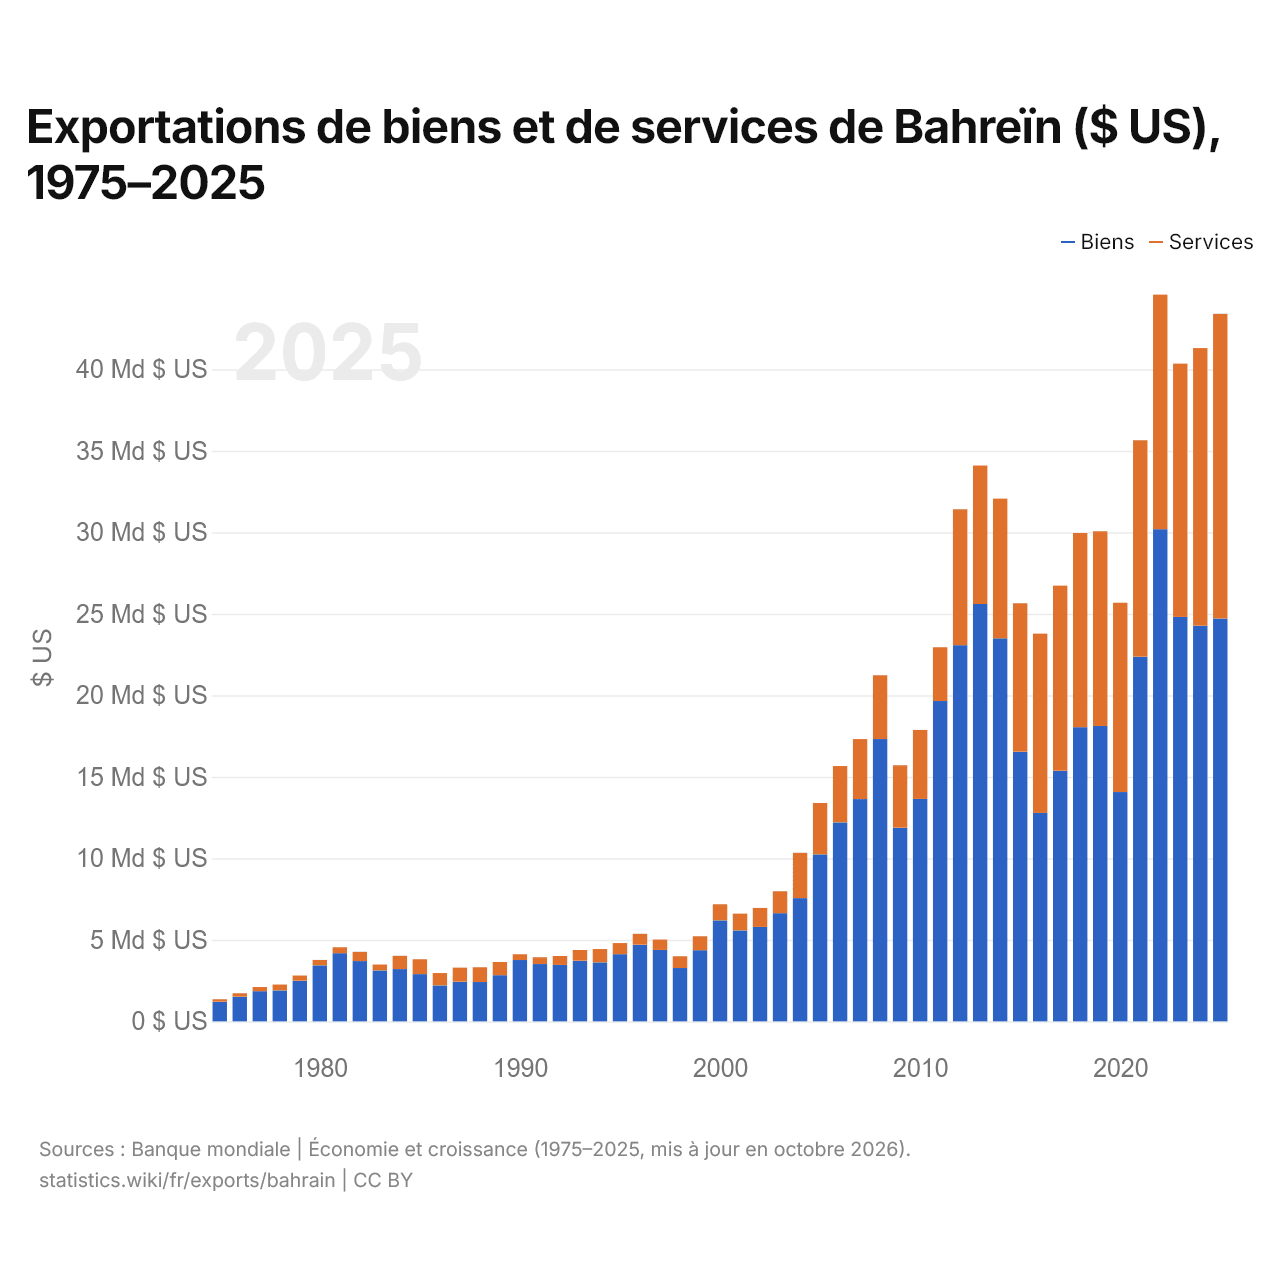
Exportations de biens et de services de Bahreïn ($ US), 1975–2025
| Année | $ US | |
|---|---|---|
| Biens | Services | |
| 2025 | 24 711 968 085 $ US | 18 690 425 532 $ US |
| 2024 | 24 278 457 447 $ US | 17 025 000 000 $ US |
| 2023 | 24 813 563 830 $ US | 15 535 904 255 $ US |
| 2022 | 30 193 882 979 $ US | 14 385 638 298 $ US |
| 2021 | 22 369 414 894 $ US | 13 283 510 638 $ US |
| 2020 | 14 065 691 489 $ US | 11 614 627 660 $ US |
| 2019 | 18 119 680 851 $ US | 11 940 159 574 $ US |
| 2018 | 18 043 617 021 $ US | 11 915 425 532 $ US |
| 2017 | 15 376 063 830 $ US | 11 351 595 745 $ US |
| 2016 | 12 784 574 468 $ US | 10 997 606 383 $ US |
| 2015 | 16 540 425 532 $ US | 9 112 500 000 $ US |
| 2014 | 23 497 872 340 $ US | 8 571 276 596 $ US |
| 2013 | 25 602 393 617 $ US | 8 500 531 915 $ US |
| 2012 | 23 076 595 745 $ US | 8 332 446 809 $ US |
| 2011 | 19 650 265 957 $ US | 3 295 744 681 $ US |
| 2010 | 13 647 074 468 $ US | 4 233 244 681 $ US |
| 2009 | 11 873 670 213 $ US | 3 831 117 021 $ US |
| 2008 | 17 315 691 489 $ US | 3 915 691 489 $ US |
| 2007 | 13 633 510 638 $ US | 3 680 851 064 $ US |
| 2006 | 12 200 000 000 $ US | 3 462 270 456 $ US |
| 2005 | 10 242 021 277 $ US | 3 154 904 509 $ US |
| 2004 | 7 558 244 681 $ US | 2 778 483 776 $ US |
| 2003 | 6 631 382 979 $ US | 1 349 279 140 $ US |
| 2002 | 5 795 212 766 $ US | 1 160 828 532 $ US |
| 2001 | 5 575 797 872 $ US | 1 030 580 534 $ US |
| 2000 | 6 194 946 809 $ US | 981 175 734 $ US |
| 1999 | 4 362 766 199 $ US | 858 938 915 $ US |
| 1998 | 3 270 213 092 $ US | 724 734 115 $ US |
| 1997 | 4 382 979 131 $ US | 637 234 102 $ US |
| 1996 | 4 702 128 066 $ US | 666 223 462 $ US |
| 1995 | 4 114 362 021 $ US | 683 244 734 $ US |
| 1994 | 3 617 021 613 $ US | 818 617 097 $ US |
| 1993 | 3 723 404 363 $ US | 651 861 721 $ US |
| 1992 | 3 465 425 532 $ US | 542 819 149 $ US |
| 1991 | 3 513 297 872 $ US | 411 170 213 $ US |
| 1990 | 3 760 638 298 $ US | 358 510 638 $ US |
| 1989 | 2 831 117 021 $ US | 809 574 468 $ US |
| 1988 | 2 411 436 170 $ US | 901 595 745 $ US |
| 1987 | 2 429 521 277 $ US | 863 563 830 $ US |
| 1986 | 2 199 468 085 $ US | 764 361 702 $ US |
| 1985 | 2 896 808 511 $ US | 911 436 170 $ US |
| 1984 | 3 203 989 365 $ US | 813 829 788 $ US |
| 1983 | 3 119 414 902 $ US | 366 755 320 $ US |
| 1982 | 3 694 973 414 $ US | 567 553 193 $ US |
| 1981 | 4 177 127 671 $ US | 360 904 256 $ US |
| 1980 | 3 433 154 361 $ US | 332 891 039 $ US |
| 1979 | 2 499 099 234 $ US | 313 664 861 $ US |
| 1978 | 1 891 840 743 $ US | 364 172 891 $ US |
| 1977 | 1 848 856 317 $ US | 255 781 626 $ US |
| 1976 | 1 517 950 623 $ US | 201 466 552 $ US |
| 1975 | 1 203 034 137 $ US | 156 257 902 $ US |
En 2025, les exportations de biens de Bahreïn s'élevaient à 24,7 milliards de dollars et celles de services à 18,7 milliards de dollars ; les services représentaient 43,1 % du total, contre 11,5 % en 1975.
Bahreïn dans le classement mondial des exportations, 2025






Exportations de biens et services de Bahreïn, % du PIB, 1980–2025
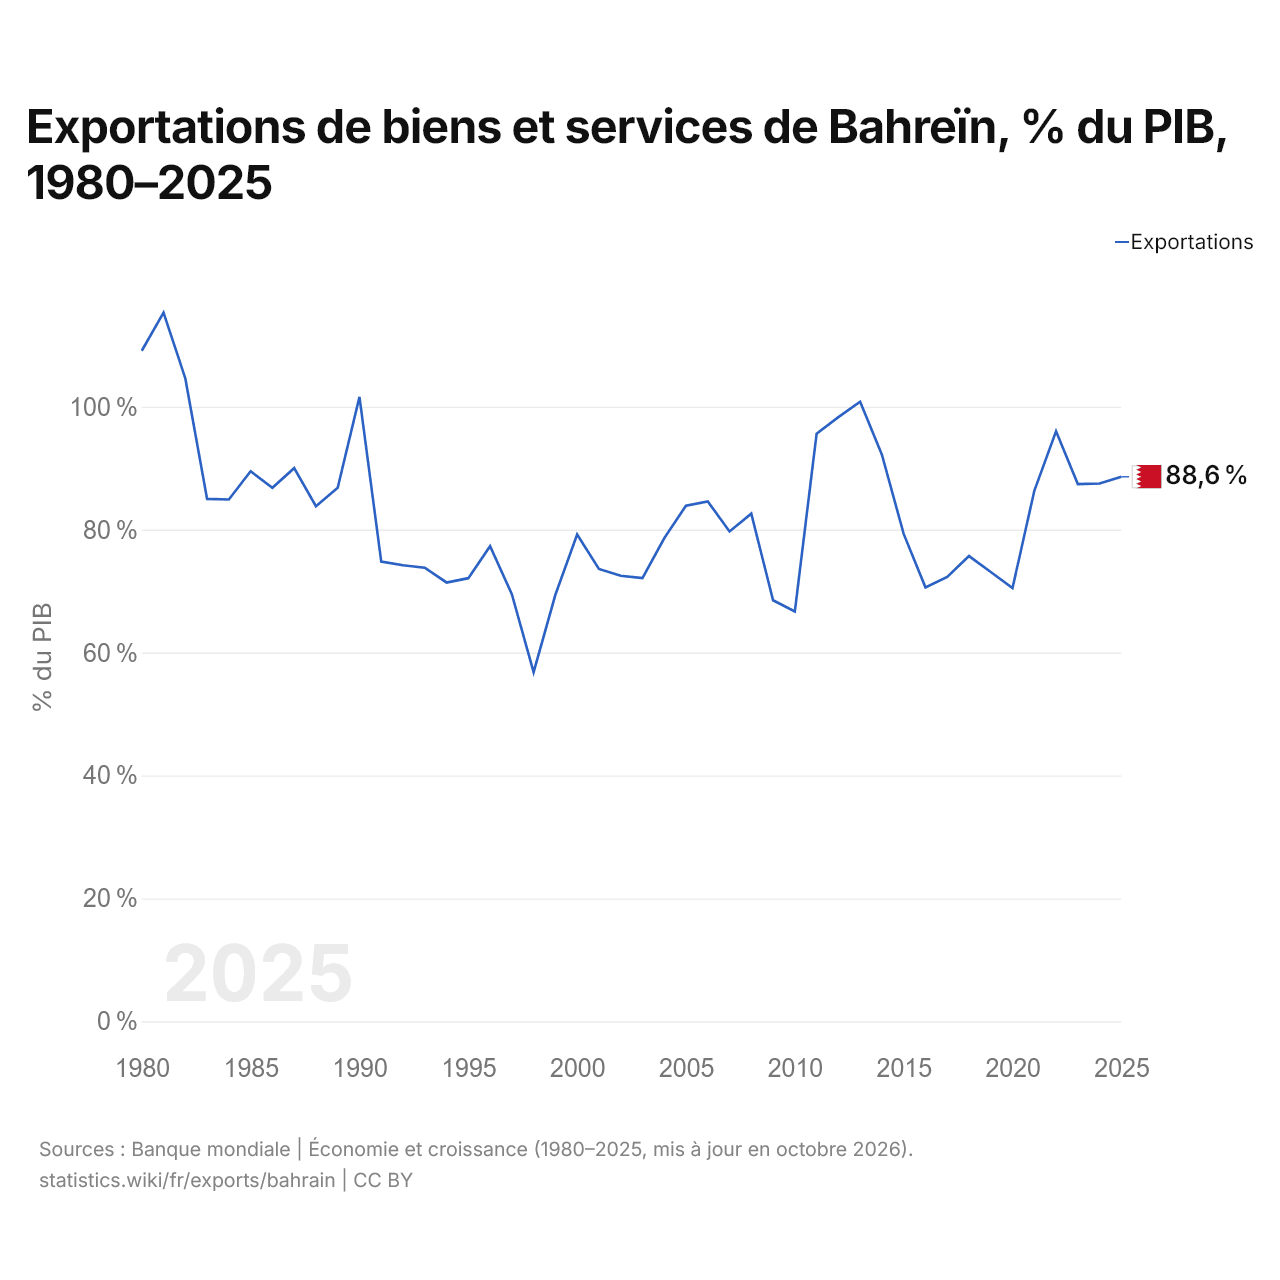
En 2025, les exportations de biens et services de Bahreïn équivalaient à 88,6 % de son PIB, contre 109,1 % en 1980. La part la plus élevée a été de 115,3 %, en 1981.
Comparer les exportations de Bahreïn avec celles d'autres pays
Sources :
- TradeMap (2001–2025, mis à jour en octobre 2026)
- Banque mondiale | Économie et croissance (1975–2025, mis à jour en octobre 2026)
Creative Commons Attribution (CC BY) : vous pouvez copier, partager, adapter et réutiliser ce contenu, y compris à des fins commerciales, à condition de citer statistics.wiki et d’indiquer les modifications apportées. Les sources citées ci-dessus peuvent avoir leurs propres conditions de licence.