
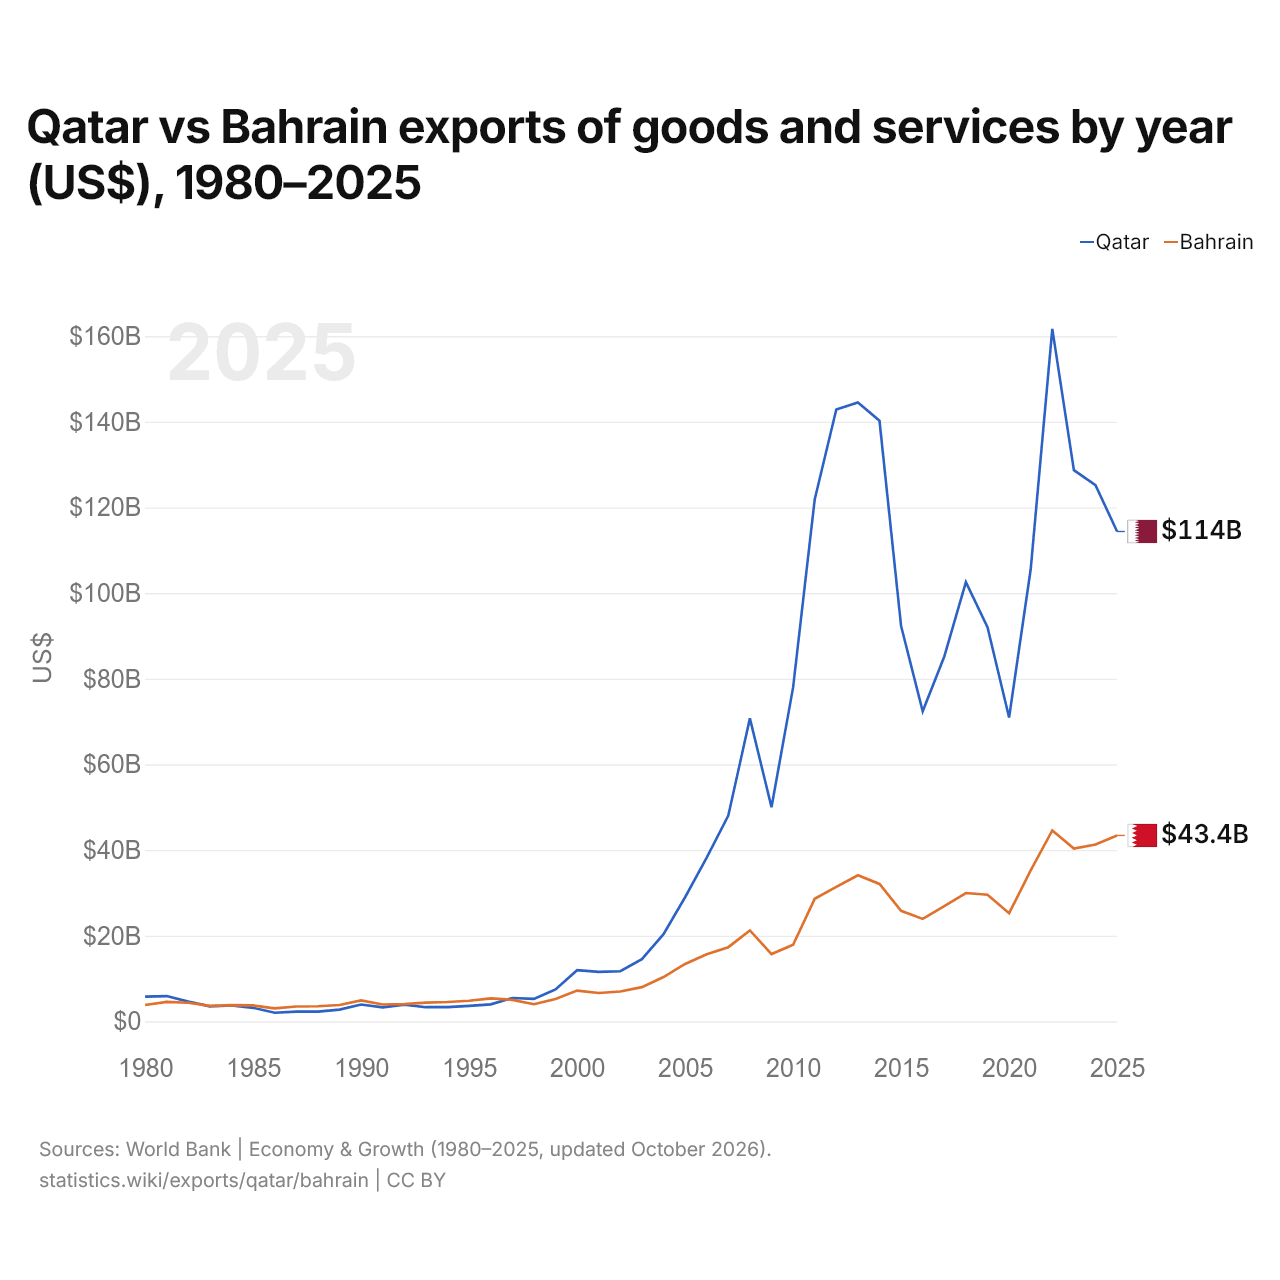
Qatar vs Bahreïn : exportations de biens et services par année ($ US), 1980–2025
| Année | $ US | |
|---|---|---|
 Qatar |
 Bahreïn |
|
| 2025 | 114 384 615 385 $ US | 43 402 393 617 $ US |
| 2024 | 125 216 483 516 $ US | 41 303 457 447 $ US |
| 2023 | 128 709 226 088 $ US | 40 349 468 085 $ US |
| 2022 | 161 692 857 143 $ US | 44 581 914 894 $ US |
| 2021 | 105 549 450 549 $ US | 35 234 574 468 $ US |
| 2020 | 70 933 241 758 $ US | 25 249 202 128 $ US |
| 2019 | 92 046 153 846 $ US | 29 564 361 702 $ US |
| 2018 | 102 560 989 011 $ US | 29 959 042 553 $ US |
| 2017 | 85 204 395 604 $ US | 26 881 914 894 $ US |
| 2016 | 72 397 252 747 $ US | 23 918 617 021 $ US |
| 2015 | 92 291 208 791 $ US | 25 805 319 149 $ US |
| 2014 | 140 228 846 154 $ US | 32 069 148 936 $ US |
| 2013 | 144 510 439 560 $ US | 34 102 925 532 $ US |
| 2012 | 142 876 098 901 $ US | 31 409 042 553 $ US |
| 2011 | 121 837 912 088 $ US | 28 609 308 511 $ US |
| 2010 | 77 975 824 176 $ US | 17 880 319 149 $ US |
| 2009 | 50 009 065 934 $ US | 15 704 787 234 $ US |
| 2008 | 70 732 692 308 $ US | 21 231 382 979 $ US |
| 2007 | 48 048 351 648 $ US | 17 314 361 702 $ US |
| 2006 | 38 244 780 220 $ US | 15 662 234 043 $ US |
| 2005 | 28 982 692 308 $ US | 13 396 808 511 $ US |
| 2004 | 20 363 186 813 $ US | 10 336 702 128 $ US |
| 2003 | 14 519 780 220 $ US | 7 980 851 064 $ US |
| 2002 | 11 684 615 385 $ US | 6 956 117 021 $ US |
| 2001 | 11 556 593 407 $ US | 6 607 446 809 $ US |
| 2000 | 11 949 450 549 $ US | 7 176 063 830 $ US |
| 1999 | 7 440 934 066 $ US | 5 221 808 511 $ US |
| 1998 | 5 240 109 890 $ US | 3 994 946 809 $ US |
| 1997 | 5 454 670 330 $ US | 5 020 744 947 $ US |
| 1996 | 3 961 263 736 $ US | 5 364 361 436 $ US |
| 1995 | 3 608 241 786 $ US | 4 796 010 638 $ US |
| 1994 | 3 309 340 659 $ US | 4 520 478 723 $ US |
| 1993 | 3 299 725 275 $ US | 4 361 702 128 $ US |
| 1992 | 3 901 923 077 $ US | 4 009 042 287 $ US |
| 1991 | 3 265 384 615 $ US | 3 923 935 904 $ US |
| 1990 | 3 934 890 110 $ US | 4 887 765 691 $ US |
| 1989 | 2 743 406 593 $ US | 3 811 169 947 $ US |
| 1988 | 2 263 461 538 $ US | 3 529 787 234 $ US |
| 1987 | 2 249 450 549 $ US | 3 472 340 426 $ US |
| 1986 | 2 013 736 264 $ US | 3 013 031 915 $ US |
| 1985 | 3 159 890 110 $ US | 3 716 489 628 $ US |
| 1984 | 3 695 054 945 $ US | 3 768 351 064 $ US |
| 1983 | 3 503 571 429 $ US | 3 611 169 947 $ US |
| 1982 | 4 602 472 527 $ US | 4 337 766 223 $ US |
| 1981 | 5 897 802 198 $ US | 4 547 340 160 $ US |
| 1980 | 5 777 191 864 $ US | 3 813 478 376 $ US |
En 2025, les exportations de biens et services du Qatar s'élevaient à 114 milliards de dollars et celles de Bahreïn à 43,4 milliards de dollars : celles du Qatar étaient 2,6 fois plus élevées. En 1980, les exportations du Qatar étaient 1,5 fois plus élevées : 5,78 milliards de dollars pour le Qatar et 3,81 milliards de dollars pour Bahreïn.
Les exportations de biens et services du Qatar sont supérieures à celles de Bahreïn chaque année depuis 1997.
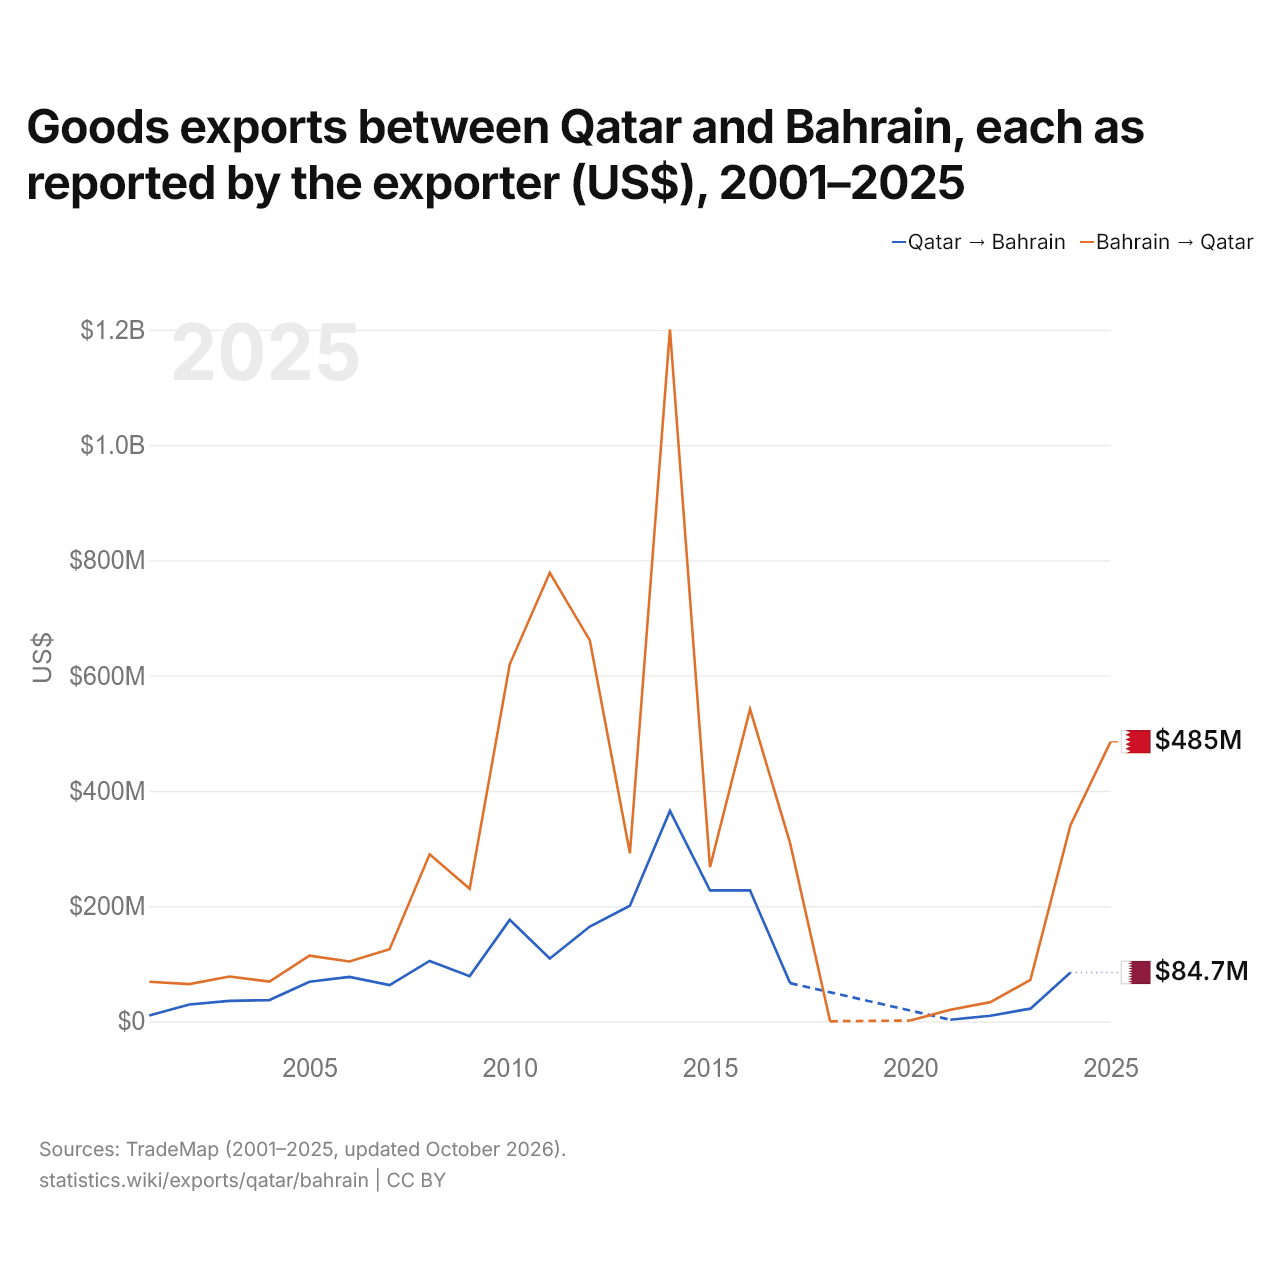
Exportations de biens entre le Qatar et Bahreïn, selon chaque exportateur ($ US), 2001–2025
| Année | $ US | |
|---|---|---|
| Qatar → Bahreïn | Bahreïn → Qatar | |
| 2025 | - | 485 000 000 $ US |
| 2024 | 84 704 000 $ US | 340 378 000 $ US |
| 2023 | 22 009 000 $ US | 71 906 000 $ US |
| 2022 | 9 743 000 $ US | 33 303 000 $ US |
| 2021 | 2 805 000 $ US | 20 071 000 $ US |
| 2020 | - | 1 378 000 $ US |
| 2019 | - | - |
| 2018 | - | 8 000 $ US |
| 2017 | 66 296 000 $ US | 309 083 000 $ US |
| 2016 | 227 197 000 $ US | 541 843 000 $ US |
| 2015 | 227 197 000 $ US | 267 573 000 $ US |
| 2014 | 365 134 000 $ US | 1 200 778 000 $ US |
| 2013 | 200 466 000 $ US | 291 565 000 $ US |
| 2012 | 164 503 000 $ US | 660 937 000 $ US |
| 2011 | 108 918 000 $ US | 778 246 000 $ US |
| 2010 | 176 115 000 $ US | 619 447 000 $ US |
| 2009 | 78 381 000 $ US | 229 904 000 $ US |
| 2008 | 104 764 000 $ US | 289 819 000 $ US |
| 2007 | 62 936 000 $ US | 125 117 000 $ US |
| 2006 | 77 110 000 $ US | 103 803 000 $ US |
| 2005 | 68 731 000 $ US | 114 000 000 $ US |
| 2004 | 36 868 000 $ US | 68 957 000 $ US |
| 2003 | 35 387 000 $ US | 77 712 000 $ US |
| 2002 | 29 245 000 $ US | 64 692 000 $ US |
| 2001 | 10 116 000 $ US | 68 644 000 $ US |
Les exportations de biens du Qatar vers Bahreïn, selon le Qatar, s'élevaient à 84,7 millions de dollars, et celles de Bahreïn vers le Qatar, selon Bahreïn, à 340 millions de dollars : 4,0 fois plus pour celles de Bahreïn. En 2001, elles s'élevaient à 10,1 millions de dollars pour le Qatar et à 68,6 millions de dollars pour Bahreïn.
Qatar vs Bahreïn : chiffres des exportations
|
Qatar
|
Bahreïn
|
|
|---|---|---|
| Exportations | 114 Md $US (2025) | 43,4 Md $US (2025) |
| Rang mondial | 45/176 | 67/176 |
| Part mondiale | 0,33 % | 0,12 % |
| % du PIB | 53,1 % | 88,6 % |
| Première catégorie de biens | Pétrole, gaz, minerais et autres matières premières (87,9 %, 2024) | Pétrole, gaz, minerais et autres matières premières (48,6 %, 2025) |
| Première destination des biens | Chine (19,9 %, 2024) | Arabie saoudite (14,3 %, 2025) |
Comparer les exportations de 2 pays au choix
Sources :
- Banque mondiale | Économie et croissance (1980–2025, mis à jour en octobre 2026)
- TradeMap (2001–2025, mis à jour en octobre 2026)
Creative Commons Attribution (CC BY) : vous pouvez copier, partager, adapter et réutiliser ce contenu, y compris à des fins commerciales, à condition de citer statistics.wiki et d’indiquer les modifications apportées. Les sources citées ci-dessus peuvent avoir leurs propres conditions de licence.