
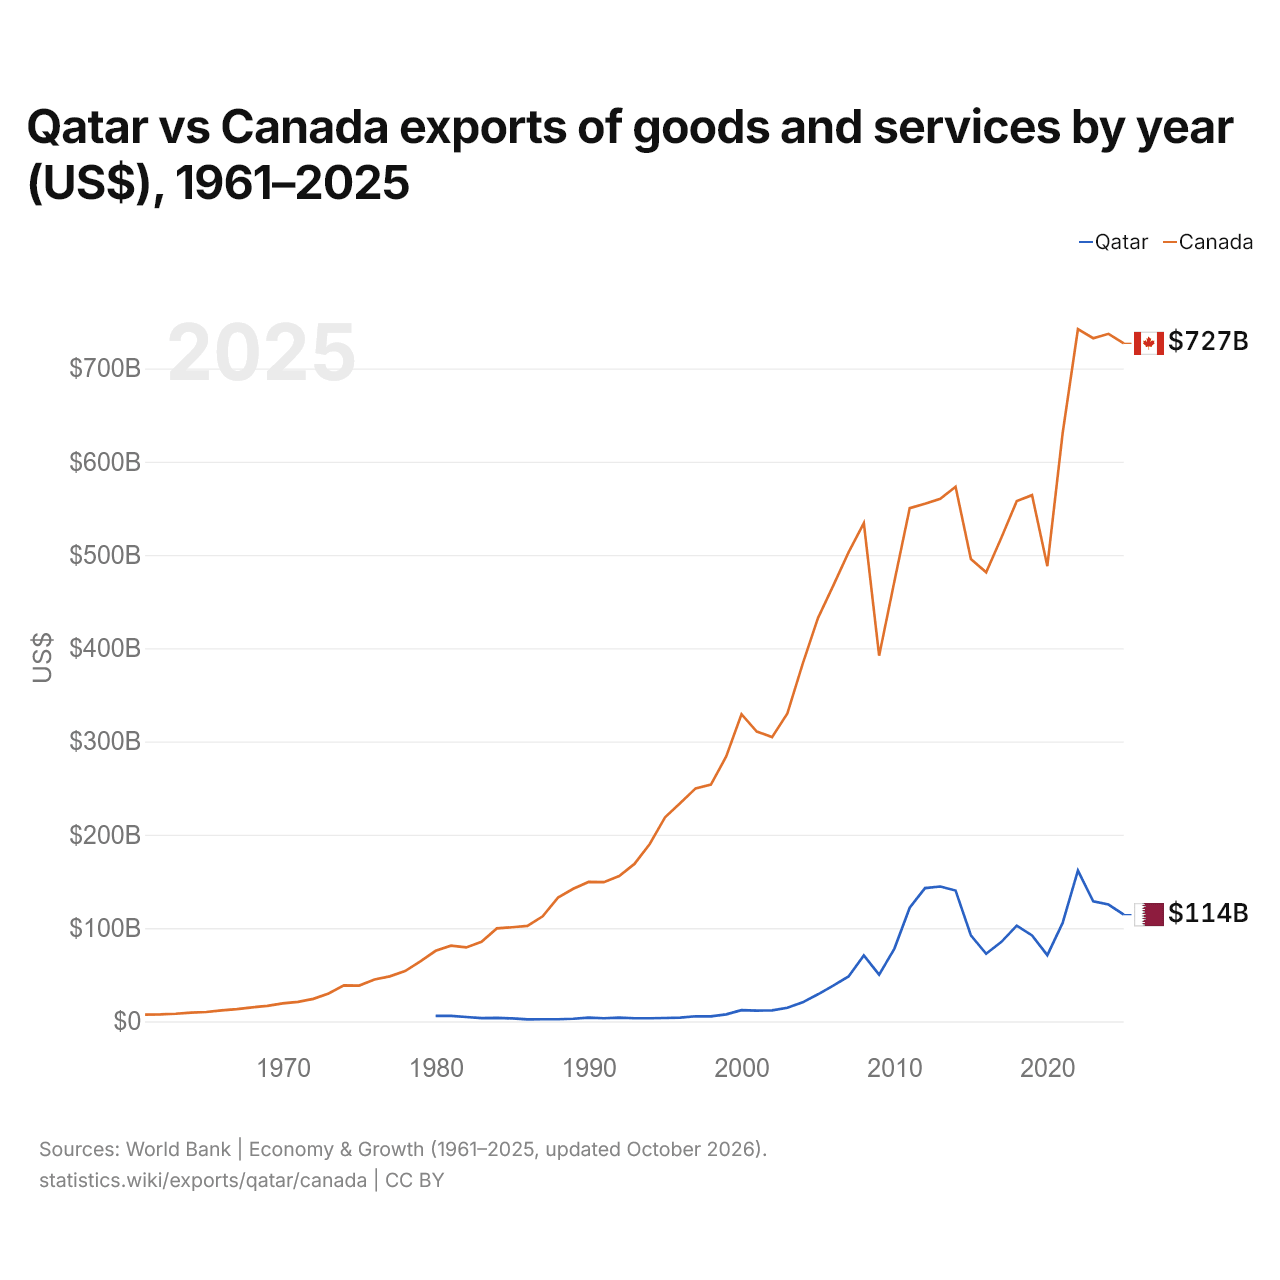
Qatar vs Canada : exportations de biens et services par année ($ US), 1961–2025
| Année | $ US | |
|---|---|---|
 Qatar |
 Canada |
|
| 2025 | 114 384 615 385 $ US | 726 879 970 410 $ US |
| 2024 | 125 216 483 516 $ US | 737 073 649 329 $ US |
| 2023 | 128 709 226 088 $ US | 732 380 673 864 $ US |
| 2022 | 161 692 857 143 $ US | 742 056 361 163 $ US |
| 2021 | 105 549 450 549 $ US | 630 478 158 310 $ US |
| 2020 | 70 933 241 758 $ US | 487 990 676 643 $ US |
| 2019 | 92 046 153 846 $ US | 564 142 104 615 $ US |
| 2018 | 102 560 989 011 $ US | 557 719 627 178 $ US |
| 2017 | 85 204 395 604 $ US | 518 766 780 220 $ US |
| 2016 | 72 397 252 747 $ US | 481 357 649 980 $ US |
| 2015 | 92 291 208 791 $ US | 495 747 450 358 $ US |
| 2014 | 140 228 846 154 $ US | 573 083 180 254 $ US |
| 2013 | 144 510 439 560 $ US | 560 108 797 443 $ US |
| 2012 | 142 876 098 901 $ US | 554 964 544 783 $ US |
| 2011 | 121 837 912 088 $ US | 550 163 771 962 $ US |
| 2010 | 77 975 824 176 $ US | 471 736 717 163 $ US |
| 2009 | 50 009 065 934 $ US | 391 985 828 012 $ US |
| 2008 | 70 732 692 308 $ US | 534 150 890 347 $ US |
| 2007 | 48 048 351 648 $ US | 502 770 691 742 $ US |
| 2006 | 38 244 780 220 $ US | 467 052 186 178 $ US |
| 2005 | 28 982 692 308 $ US | 432 369 202 839 $ US |
| 2004 | 20 363 186 813 $ US | 383 240 584 166 $ US |
| 2003 | 14 519 780 220 $ US | 330 149 882 235 $ US |
| 2002 | 11 684 615 385 $ US | 304 705 919 837 $ US |
| 2001 | 11 556 593 407 $ US | 310 667 613 636 $ US |
| 2000 | 11 949 450 549 $ US | 329 258 635 782 $ US |
| 1999 | 7 440 934 066 $ US | 283 991 384 533 $ US |
| 1998 | 5 240 109 890 $ US | 253 784 967 981 $ US |
| 1997 | 5 454 670 330 $ US | 249 765 997 400 $ US |
| 1996 | 3 961 263 736 $ US | 233 945 727 906 $ US |
| 1995 | 3 608 241 786 $ US | 218 740 163 218 $ US |
| 1994 | 3 309 340 659 $ US | 190 114 967 780 $ US |
| 1993 | 3 299 725 275 $ US | 168 751 259 592 $ US |
| 1992 | 3 901 923 077 $ US | 155 724 331 927 $ US |
| 1991 | 3 265 384 615 $ US | 149 170 812 604 $ US |
| 1990 | 3 934 890 110 $ US | 149 461 775 797 $ US |
| 1989 | 2 743 406 593 $ US | 142 065 878 378 $ US |
| 1988 | 2 263 461 538 $ US | 132 708 214 837 $ US |
| 1987 | 2 249 450 549 $ US | 112 629 713 424 $ US |
| 1986 | 2 013 736 264 $ US | 102 284 994 602 $ US |
| 1985 | 3 159 890 110 $ US | 100 872 940 315 $ US |
| 1984 | 3 695 054 945 $ US | 99 654 852 907 $ US |
| 1983 | 3 503 571 429 $ US | 85 210 159 039 $ US |
| 1982 | 4 602 472 527 $ US | 79 268 055 443 $ US |
| 1981 | 5 897 802 198 $ US | 81 065 977 146 $ US |
| 1980 | 5 777 191 864 $ US | 75 584 160 109 $ US |
| 1979 | - | 64 212 907 632 $ US |
| 1978 | - | 53 813 447 883 $ US |
| 1977 | - | 48 202 162 670 $ US |
| 1976 | - | 44 942 190 669 $ US |
| 1975 | - | 38 302 202 123 $ US |
| 1974 | - | 38 617 586 912 $ US |
| 1973 | - | 29 896 010 399 $ US |
| 1972 | - | 24 070 108 092 $ US |
| 1971 | - | 20 913 052 090 $ US |
| 1970 | - | 19 265 001 436 $ US |
| 1969 | - | 16 551 276 495 $ US |
| 1968 | - | 15 002 668 948 $ US |
| 1967 | - | 13 131 449 205 $ US |
| 1966 | - | 11 675 300 777 $ US |
| 1965 | - | 9 996 446 867 $ US |
| 1964 | - | 9 398 224 064 $ US |
| 1963 | - | 8 094 515 611 $ US |
| 1962 | - | 7 439 414 166 $ US |
| 1961 | - | 7 215 712 237 $ US |
En 2025, les exportations de biens et services du Qatar s'élevaient à 114 milliards de dollars et celles du Canada à 727 milliards de dollars : celles du Canada étaient 6,4 fois plus élevées. En 1980, les exportations du Canada étaient 13 fois plus élevées : 5,78 milliards de dollars pour le Qatar et 75,6 milliards de dollars pour le Canada.
Les exportations de biens et services du Canada sont supérieures à celles du Qatar chaque année depuis 1980.
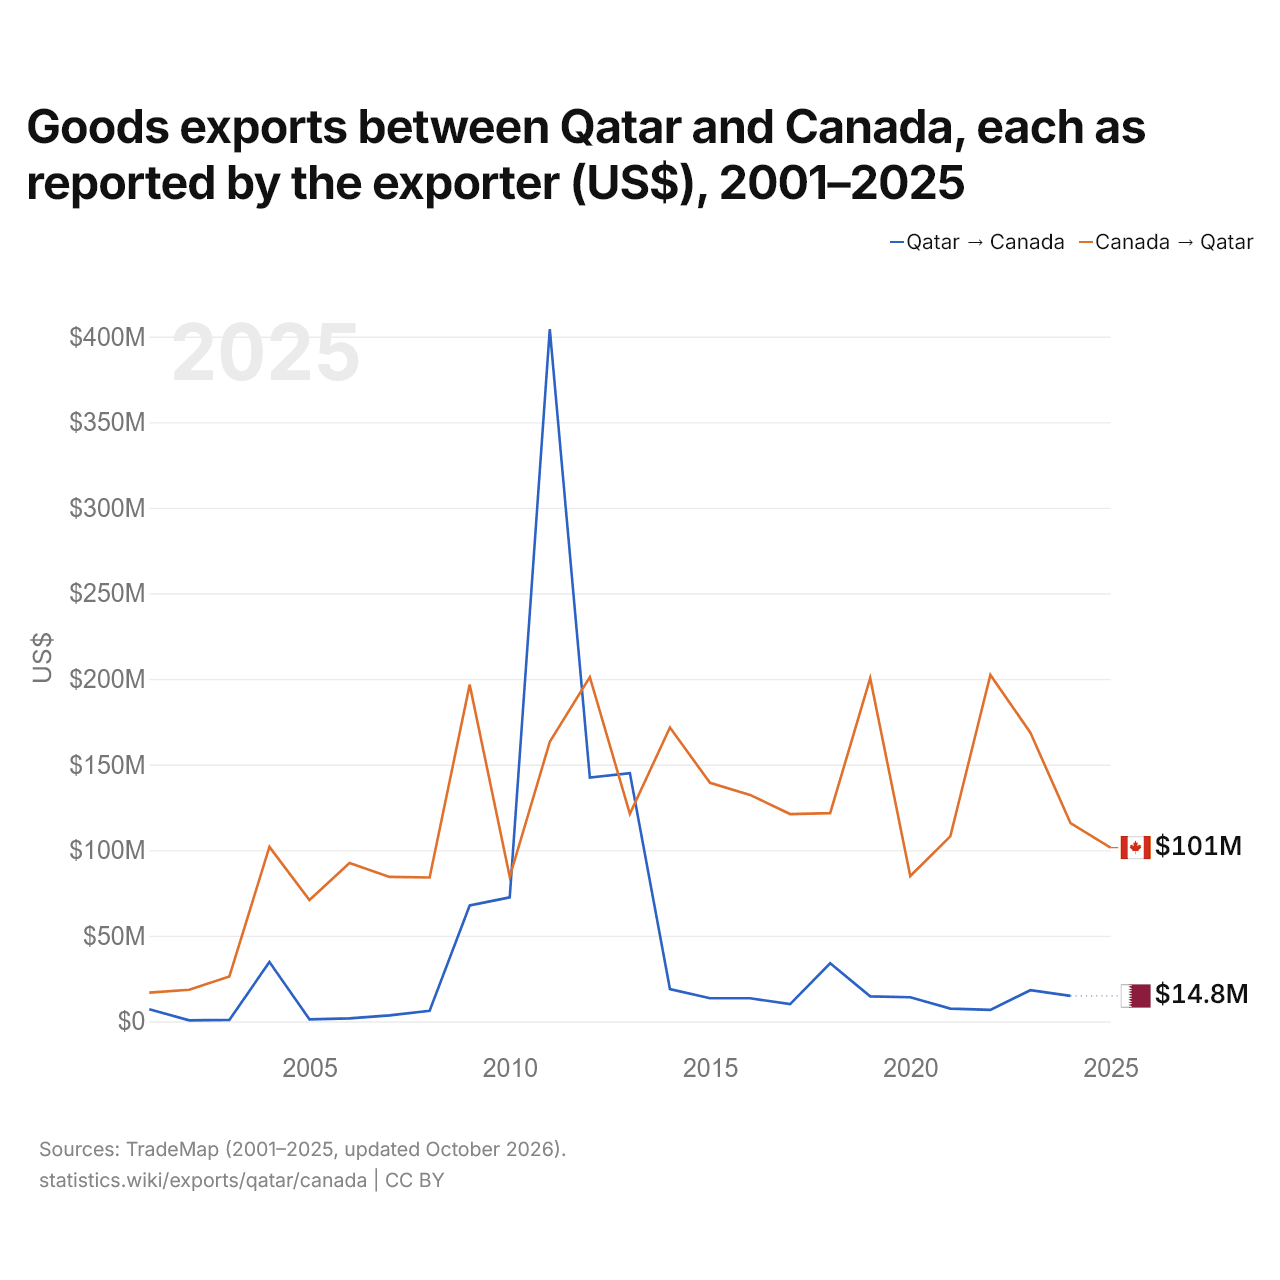
Exportations de biens entre le Qatar et le Canada, selon chaque exportateur ($ US), 2001–2025
| Année | $ US | |
|---|---|---|
| Qatar → Canada | Canada → Qatar | |
| 2025 | - | 101 471 000 $ US |
| 2024 | 14 840 000 $ US | 115 836 000 $ US |
| 2023 | 18 190 000 $ US | 168 591 000 $ US |
| 2022 | 6 668 000 $ US | 202 366 000 $ US |
| 2021 | 7 465 000 $ US | 108 055 000 $ US |
| 2020 | 14 057 000 $ US | 84 876 000 $ US |
| 2019 | 14 566 000 $ US | 200 467 000 $ US |
| 2018 | 33 926 000 $ US | 121 577 000 $ US |
| 2017 | 10 073 000 $ US | 121 079 000 $ US |
| 2016 | 13 487 000 $ US | 132 276 000 $ US |
| 2015 | 13 487 000 $ US | 139 312 000 $ US |
| 2014 | 18 856 000 $ US | 171 650 000 $ US |
| 2013 | 144 942 000 $ US | 121 223 000 $ US |
| 2012 | 142 379 000 $ US | 201 108 000 $ US |
| 2011 | 404 293 000 $ US | 163 244 000 $ US |
| 2010 | 72 412 000 $ US | 84 428 000 $ US |
| 2009 | 67 655 000 $ US | 196 670 000 $ US |
| 2008 | 6 191 000 $ US | 84 043 000 $ US |
| 2007 | 3 513 000 $ US | 84 370 000 $ US |
| 2006 | 1 730 000 $ US | 92 515 000 $ US |
| 2005 | 1 191 000 $ US | 70 854 000 $ US |
| 2004 | 34 644 000 $ US | 101 912 000 $ US |
| 2003 | 813 000 $ US | 26 199 000 $ US |
| 2002 | 596 000 $ US | 18 454 000 $ US |
| 2001 | 7 011 000 $ US | 16 780 000 $ US |
Les exportations de biens du Qatar vers le Canada, selon le Qatar, s'élevaient à 14,8 millions de dollars, et celles du Canada vers le Qatar, selon le Canada, à 116 millions de dollars : 7,8 fois plus pour celles du Canada. En 2001, elles s'élevaient à 7,01 millions de dollars pour le Qatar et à 16,8 millions de dollars pour le Canada.
Qatar vs Canada : chiffres des exportations
|
Qatar
|
Canada
|
|
|---|---|---|
| Exportations | 114 Md $US (2025) | 727 Md $US (2025) |
| Rang mondial | 45/176 | 14/176 |
| Part mondiale | 0,33 % | 2,08 % |
| % du PIB | 53,1 % | 31,3 % |
| Première catégorie de biens | Pétrole, gaz, minerais et autres matières premières (87,9 %, 2024) | Pétrole, gaz, minerais et autres matières premières (30,4 %, 2025) |
| Première destination des biens | Chine (19,9 %, 2024) | États-Unis (72,6 %, 2025) |
Comparer les exportations de 2 pays au choix
Sources :
- Banque mondiale | Économie et croissance (1961–2025, mis à jour en octobre 2026)
- TradeMap (2001–2025, mis à jour en octobre 2026)
Creative Commons Attribution (CC BY) : vous pouvez copier, partager, adapter et réutiliser ce contenu, y compris à des fins commerciales, à condition de citer statistics.wiki et d’indiquer les modifications apportées. Les sources citées ci-dessus peuvent avoir leurs propres conditions de licence.