
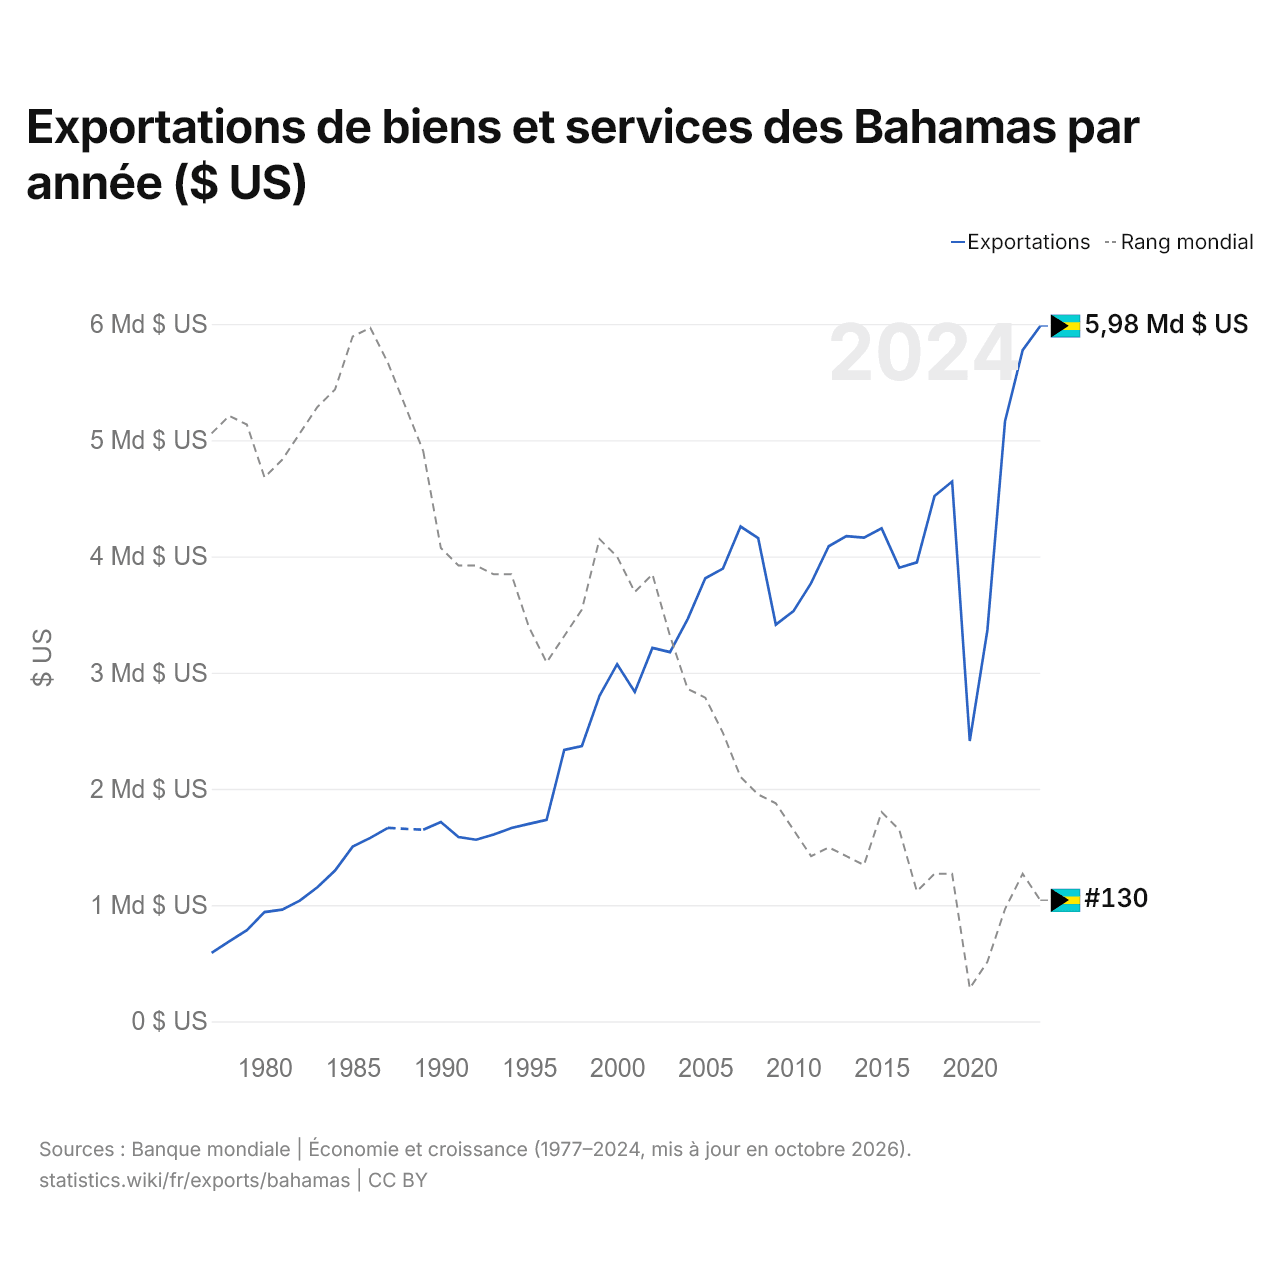
Exportations de biens et services des Bahamas par année ($ US)
| Année | $ US | Rang mondial |
|---|---|---|
| Exportations | Rang mondial | |
| 2024 | 5 982 200 000 $ US | #130 |
| 2023 | 5 774 300 000 $ US | #127 |
| 2022 | 5 163 900 000 $ US | #131 |
| 2021 | 3 366 900 000 $ US | #137 |
| 2020 | 2 411 900 000 $ US | #140 |
| 2019 | 4 644 400 000 $ US | #127 |
| 2018 | 4 519 000 000 $ US | #127 |
| 2017 | 3 948 900 000 $ US | #129 |
| 2016 | 3 903 100 000 $ US | #122 |
| 2015 | 4 241 600 000 $ US | #120 |
| 2014 | 4 161 900 000 $ US | #126 |
| 2013 | 4 175 100 000 $ US | #125 |
| 2012 | 4 087 400 000 $ US | #124 |
| 2011 | 3 769 900 000 $ US | #125 |
| 2010 | 3 528 800 000 $ US | #122 |
| 2009 | 3 412 900 000 $ US | #119 |
| 2008 | 4 157 100 000 $ US | #118 |
| 2007 | 4 257 100 000 $ US | #116 |
| 2006 | 3 895 000 000 $ US | #111 |
| 2005 | 3 812 500 000 $ US | #107 |
| 2004 | 3 460 500 000 $ US | #106 |
| 2003 | 3 176 400 000 $ US | #100 |
| 2002 | 3 212 800 000 $ US | #93 |
| 2001 | 2 834 100 000 $ US | #95 |
| 2000 | 3 072 900 000 $ US | #91 |
| 1999 | 2 801 300 000 $ US | #89 |
| 1998 | 2 368 200 000 $ US | #97 |
| 1997 | 2 335 400 000 $ US | #100 |
| 1996 | 1 733 680 000 $ US | #103 |
| 1995 | 1 699 040 000 $ US | #99 |
| 1994 | 1 662 790 000 $ US | #93 |
| 1993 | 1 606 810 000 $ US | #93 |
| 1992 | 1 562 180 000 $ US | #92 |
| 1991 | 1 585 170 000 $ US | #92 |
| 1990 | 1 714 730 000 $ US | #90 |
| 1989 | 1 648 320 000 $ US | #79 |
| 1988 | - | - |
| 1987 | 1 664 300 000 $ US | #69 |
| 1986 | 1 577 900 000 $ US | #65 |
| 1985 | 1 503 600 000 $ US | #66 |
| 1984 | 1 297 900 000 $ US | #72 |
| 1983 | 1 153 500 000 $ US | #74 |
| 1982 | 1 038 300 000 $ US | #77 |
| 1981 | 961 200 000 $ US | #80 |
| 1980 | 939 800 000 $ US | #82 |
| 1979 | 785 000 000 $ US | #76 |
| 1978 | 688 100 000 $ US | #75 |
| 1977 | 589 300 000 $ US | #77 |
Les exportations de biens et services des Bahamas s'élèvent à 5,98 milliards de dollars (2024), contre 589 millions de dollars en 1977. Elles se classent au 130e rang mondial, en baisse par rapport au 127e rang l'année précédente. Leur meilleur rang a été le 65e, occupé pour la dernière fois en 1986.
Les exportations de biens et services des Bahamas sont les 21es plus élevées de 27 pays situés en Amérique latine. Les importations de biens et services des Bahamas s'élèvent à 6,56 milliards de dollars (2024), au 132e rang mondial. Les importations des Bahamas dépassent leurs exportations de 582 millions de dollars, soit un déficit commercial (2024).
Exportations de biens des Bahamas par catégorie, 2025
Exportations de biens, 2025: 678 M $US
En 2025, la première catégorie des exportations de biens des Bahamas était « machines, électronique et véhicules », avec 25,5 %, suivie de « bois, papier et imprimés », avec 19,9 %.
Destinations des exportations de biens des Bahamas : les 10 premières, 2025
| Rang | Pays | Exportations de biens | Part | |
|---|---|---|---|---|
| 1 |
 États-Unis |
558 M $US | 82,4 % | |
| 2 |
 Antigua-et-Barbuda |
28,4 M $US | 4,19 % | |
| 3 |
 France |
18,1 M $US | 2,66 % | vs France |
| 4 |
 Belgique |
14,5 M $US | 2,15 % | |
| 5 |
 Colombie |
4,35 M $US | 0,64 % | |
| 6 |
 Irlande |
4,10 M $US | 0,61 % | |
| 7 |
 Italie |
2,21 M $US | 0,33 % | |
| 8 |
 Inde |
2,10 M $US | 0,31 % | |
| 9 |
 Royaume-Uni |
1,84 M $US | 0,27 % | |
| 10 |
 Australie |
1,72 M $US | 0,25 % | |
| Autres partenaires et non précisés | 41,9 M $US | 6,19 % |
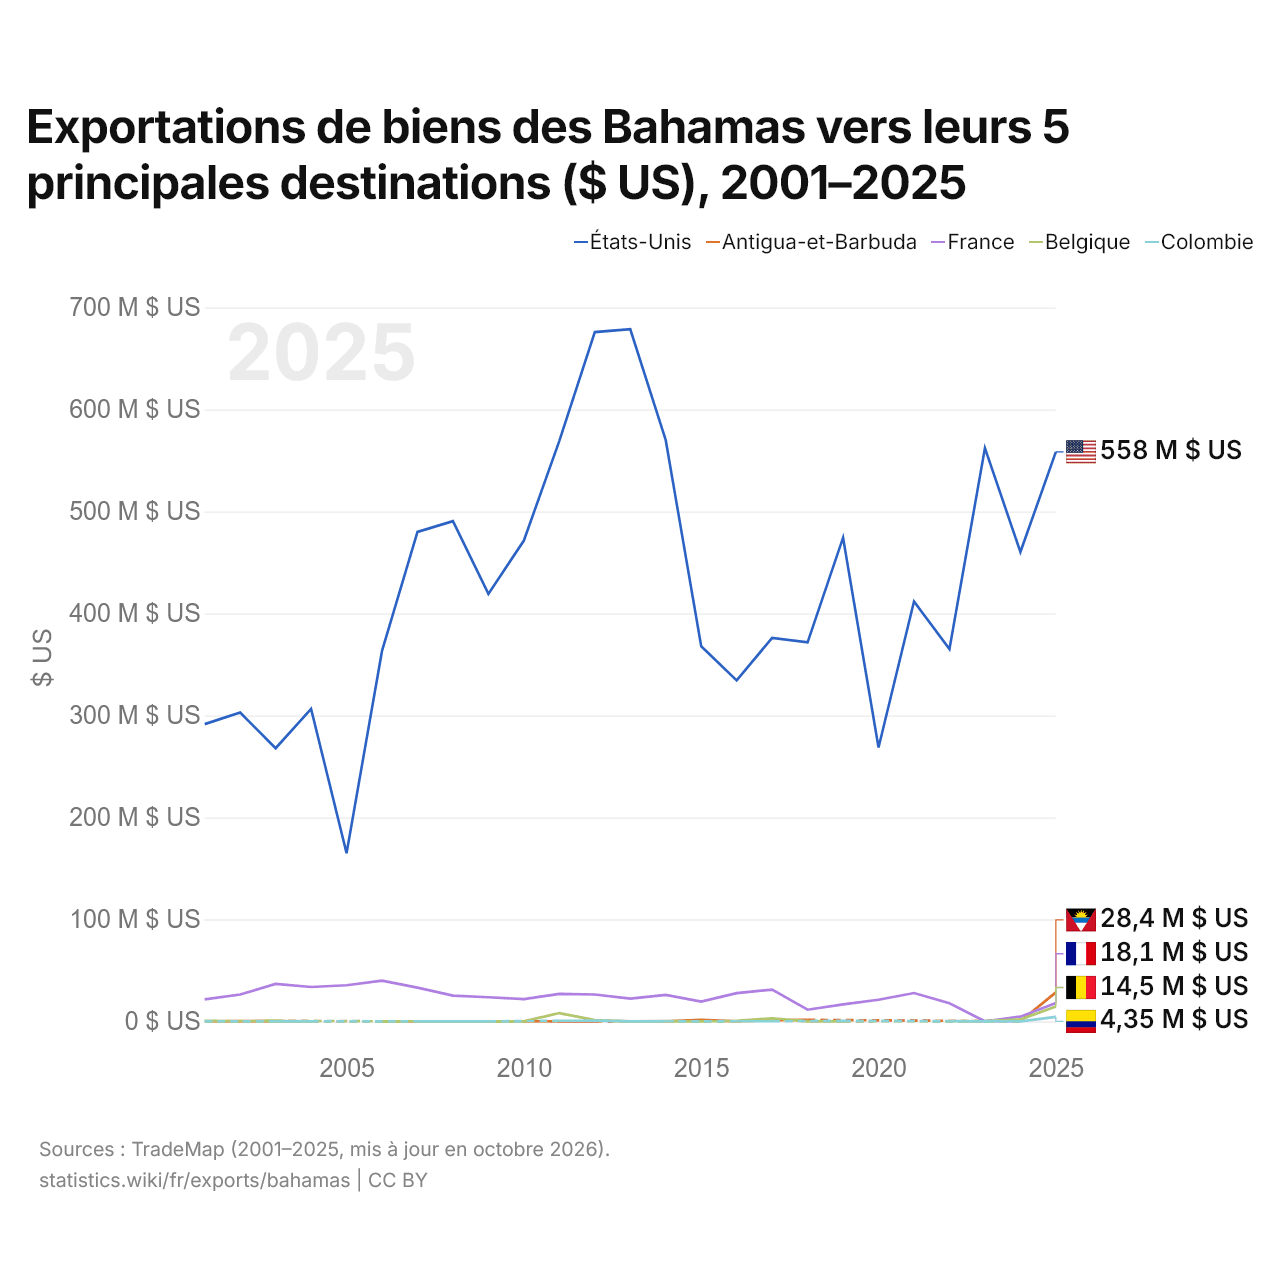
Exportations de biens des Bahamas vers leurs 5 principales destinations ($ US), 2001–2025
| Année | $ US | ||||
|---|---|---|---|---|---|
| États-Unis | Antigua-et-Barbuda | France | Belgique | Colombie | |
| 2025 | 558 392 000 $ US | 28 402 000 $ US | 18 054 000 $ US | 14 547 000 $ US | 4 347 000 $ US |
| 2024 | 460 238 000 $ US | 17 000 $ US | 4 609 000 $ US | 1 813 000 $ US | 17 000 $ US |
| 2023 | 562 178 000 $ US | - | 29 000 $ US | 139 000 $ US | 9 000 $ US |
| 2022 | 365 150 000 $ US | - | 17 646 000 $ US | - | 220 000 $ US |
| 2021 | 411 741 000 $ US | - | 27 780 000 $ US | - | - |
| 2020 | 268 505 000 $ US | - | 21 189 000 $ US | - | - |
| 2019 | 474 305 000 $ US | - | 16 654 000 $ US | 15 000 $ US | 520 000 $ US |
| 2018 | 371 644 000 $ US | 1 442 000 $ US | 11 384 000 $ US | 38 000 $ US | - |
| 2017 | 376 030 000 $ US | 1 148 000 $ US | 31 129 000 $ US | 2 963 000 $ US | 167 000 $ US |
| 2016 | 334 309 000 $ US | 6 000 $ US | 27 626 000 $ US | 422 000 $ US | 120 000 $ US |
| 2015 | 367 790 000 $ US | 1 539 000 $ US | 19 360 000 $ US | 1 000 $ US | - |
| 2014 | 569 874 000 $ US | 3 000 $ US | 25 855 000 $ US | 211 000 $ US | 71 000 $ US |
| 2013 | 678 644 000 $ US | - | 22 275 000 $ US | 9 000 $ US | 5 000 $ US |
| 2012 | 675 873 000 $ US | 6 000 $ US | 26 323 000 $ US | 1 226 000 $ US | 656 000 $ US |
| 2011 | 569 237 000 $ US | 41 000 $ US | 26 890 000 $ US | 8 107 000 $ US | 542 000 $ US |
| 2010 | 471 504 000 $ US | 42 000 $ US | 21 814 000 $ US | 29 000 $ US | - |
| 2009 | 419 155 000 $ US | 40 000 $ US | 23 610 000 $ US | 21 000 $ US | 1 000 $ US |
| 2008 | 490 467 000 $ US | 57 000 $ US | 25 275 000 $ US | 38 000 $ US | 3 000 $ US |
| 2007 | 479 936 000 $ US | 44 000 $ US | 33 013 000 $ US | 64 000 $ US | 9 000 $ US |
| 2006 | 363 221 000 $ US | 56 000 $ US | 39 966 000 $ US | 9 000 $ US | - |
| 2005 | 164 925 000 $ US | - | 35 366 000 $ US | - | - |
| 2004 | 306 404 000 $ US | 23 000 $ US | 33 706 000 $ US | - | 7 000 $ US |
| 2003 | 267 766 000 $ US | 154 000 $ US | 36 712 000 $ US | 636 000 $ US | 9 000 $ US |
| 2002 | 302 772 000 $ US | 129 000 $ US | 26 270 000 $ US | 46 000 $ US | - |
| 2001 | 291 466 000 $ US | 94 000 $ US | 21 497 000 $ US | 602 000 $ US | 2 000 $ US |
En 2025, les exportations de biens s'élevaient à 558 millions de dollars vers les États-Unis, 28,4 millions de dollars vers Antigua-et-Barbuda, 18,1 millions de dollars vers la France, 14,5 millions de dollars vers la Belgique et 4,35 millions de dollars vers la Colombie. Le premier rang des cinq destinations des Bahamas est occupé par les États-Unis chaque année depuis 2001. Le changement le plus récent dans leur ordre remonte à 2025, quand les exportations des Bahamas vers Antigua-et-Barbuda ont dépassé celles vers la France.
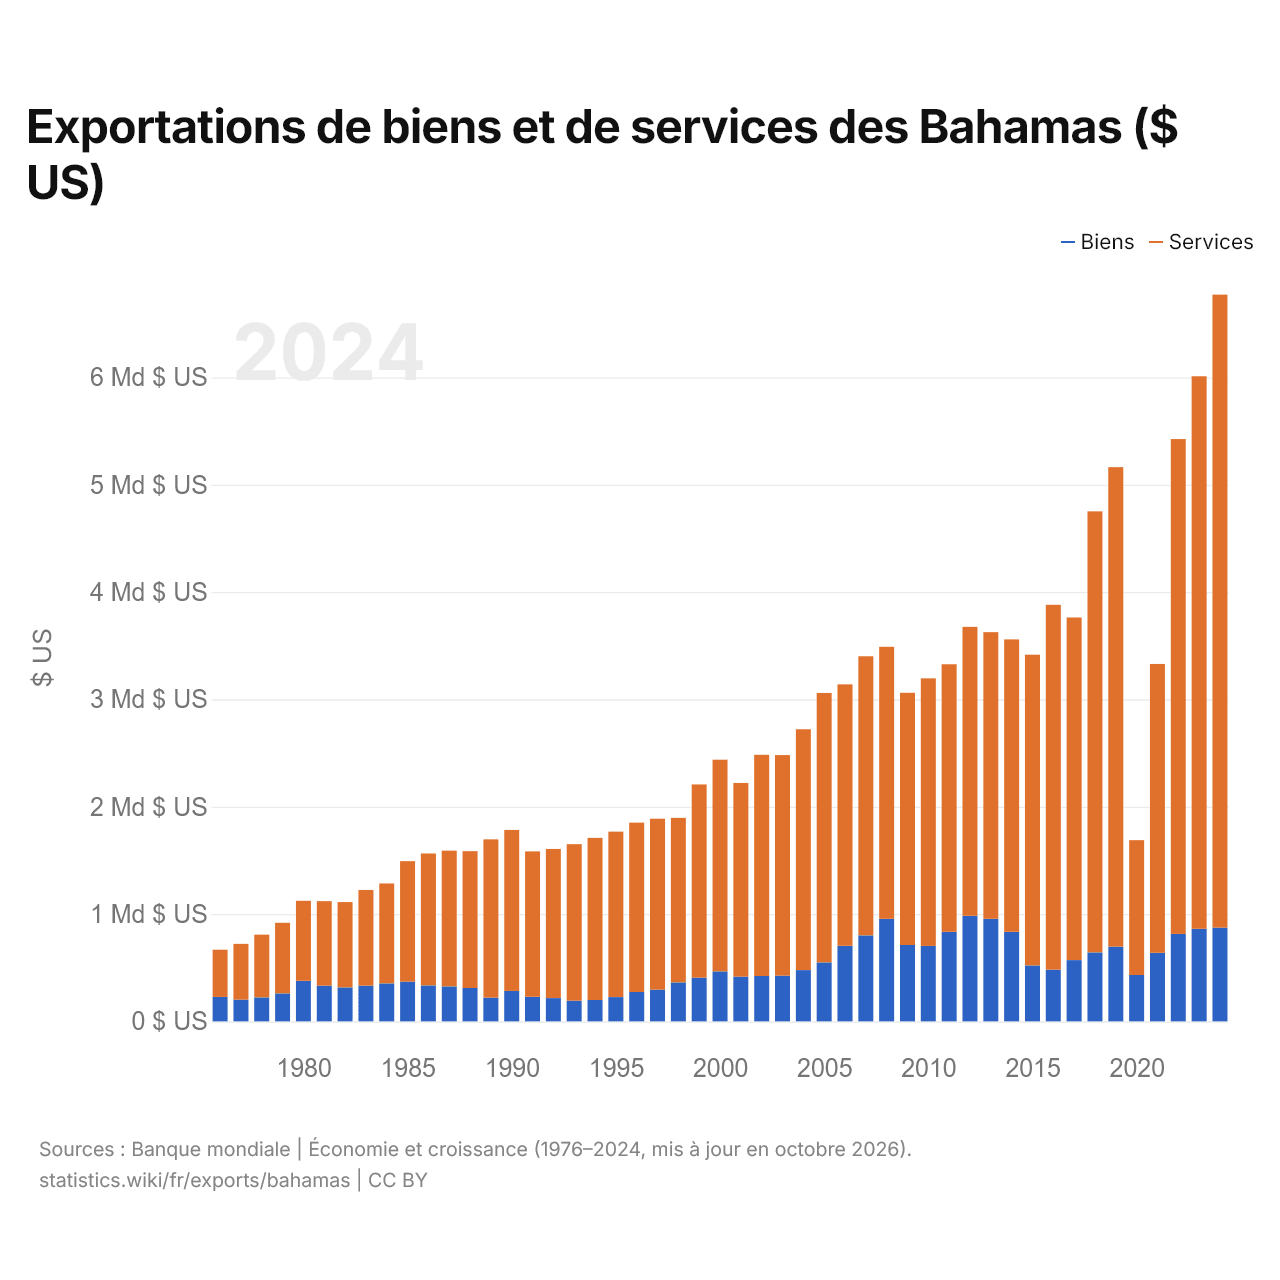
Exportations de biens et de services des Bahamas ($ US)
| Année | $ US | |
|---|---|---|
| Biens | Services | |
| 2024 | 873 793 415 $ US | 5 896 984 361 $ US |
| 2023 | 862 216 445 $ US | 5 148 414 907 $ US |
| 2022 | 814 400 357 $ US | 4 611 012 020 $ US |
| 2021 | 638 590 377 $ US | 2 691 240 181 $ US |
| 2020 | 431 367 905 $ US | 1 257 053 699 $ US |
| 2019 | 695 323 347 $ US | 4 468 513 518 $ US |
| 2018 | 641 734 134 $ US | 4 110 150 473 $ US |
| 2017 | 570 600 437 $ US | 3 192 086 157 $ US |
| 2016 | 481 397 433 $ US | 3 399 808 723 $ US |
| 2015 | 520 531 829 $ US | 2 895 504 509 $ US |
| 2014 | 833 944 932 $ US | 2 724 801 051 $ US |
| 2013 | 954 914 000 $ US | 2 671 240 000 $ US |
| 2012 | 984 017 000 $ US | 2 691 377 600 $ US |
| 2011 | 833 539 000 $ US | 2 493 608 000 $ US |
| 2010 | 702 435 000 $ US | 2 493 573 000 $ US |
| 2009 | 710 680 000 $ US | 2 350 857 000 $ US |
| 2008 | 955 822 000 $ US | 2 533 924 563 $ US |
| 2007 | 801 874 138 $ US | 2 599 340 000 $ US |
| 2006 | 703 540 000 $ US | 2 436 080 000 $ US |
| 2005 | 549 132 570 $ US | 2 510 904 015 $ US |
| 2004 | 477 460 000 $ US | 2 244 080 000 $ US |
| 2003 | 426 530 000 $ US | 2 054 660 000 $ US |
| 2002 | 422 066 878 $ US | 2 061 792 178 $ US |
| 2001 | 416 900 000 $ US | 1 804 400 000 $ US |
| 2000 | 464 800 000 $ US | 1 973 220 000 $ US |
| 1999 | 406 800 000 $ US | 1 800 600 000 $ US |
| 1998 | 362 900 000 $ US | 1 533 000 000 $ US |
| 1997 | 295 000 000 $ US | 1 592 900 000 $ US |
| 1996 | 273 300 000 $ US | 1 578 200 000 $ US |
| 1995 | 225 400 000 $ US | 1 542 300 000 $ US |
| 1994 | 198 500 000 $ US | 1 510 600 000 $ US |
| 1993 | 192 200 000 $ US | 1 459 000 000 $ US |
| 1992 | 216 600 000 $ US | 1 389 600 000 $ US |
| 1991 | 229 400 000 $ US | 1 354 000 000 $ US |
| 1990 | 283 500 000 $ US | 1 500 100 000 $ US |
| 1989 | 221 000 000 $ US | 1 474 300 000 $ US |
| 1988 | 310 800 000 $ US | 1 275 200 000 $ US |
| 1987 | 324 800 000 $ US | 1 265 600 000 $ US |
| 1986 | 335 300 000 $ US | 1 228 700 000 $ US |
| 1985 | 370 500 000 $ US | 1 121 900 000 $ US |
| 1984 | 353 800 000 $ US | 931 200 000 $ US |
| 1983 | 332 900 000 $ US | 891 100 000 $ US |
| 1982 | 316 900 000 $ US | 794 100 000 $ US |
| 1981 | 332 100 000 $ US | 787 500 000 $ US |
| 1980 | 377 100 000 $ US | 746 000 000 $ US |
| 1979 | 260 700 000 $ US | 657 100 000 $ US |
| 1978 | 224 400 000 $ US | 583 100 000 $ US |
| 1977 | 201 900 000 $ US | 519 700 000 $ US |
| 1976 | 227 500 000 $ US | 440 000 000 $ US |
Les exportations de biens des Bahamas s'élèvent à 874 millions de dollars (2024) et celles de services à 5,9 milliards de dollars ; les services représentent 87,1 % du total, contre 65,9 % en 1976.
Les Bahamas dans le classement mondial des exportations
| Rang | Pays | Exportations | Part mondiale | |
|---|---|---|---|---|
| 127 |
 Maldives |
6,24 Md $US (2025) | 0,02 % | |
| 128 |
 Kirghizistan |
6,07 Md $US (2025) | 0,02 % | |
| 129 |
 Liban |
6,06 Md $US | 0,02 % | |
| 130 |
 Bahamas |
5,98 Md $US | 0,02 % | |
| 131 |
 Guinée équatoriale |
5,97 Md $US (2025) | 0,02 % | |
| 132 |
 Djibouti |
5,11 Md $US (2025) | 0,01 % | |
| 133 |
 Îles Caïmans |
5,04 Md $US | 0,02 % |
Exportations de biens et services des Bahamas, % du PIB
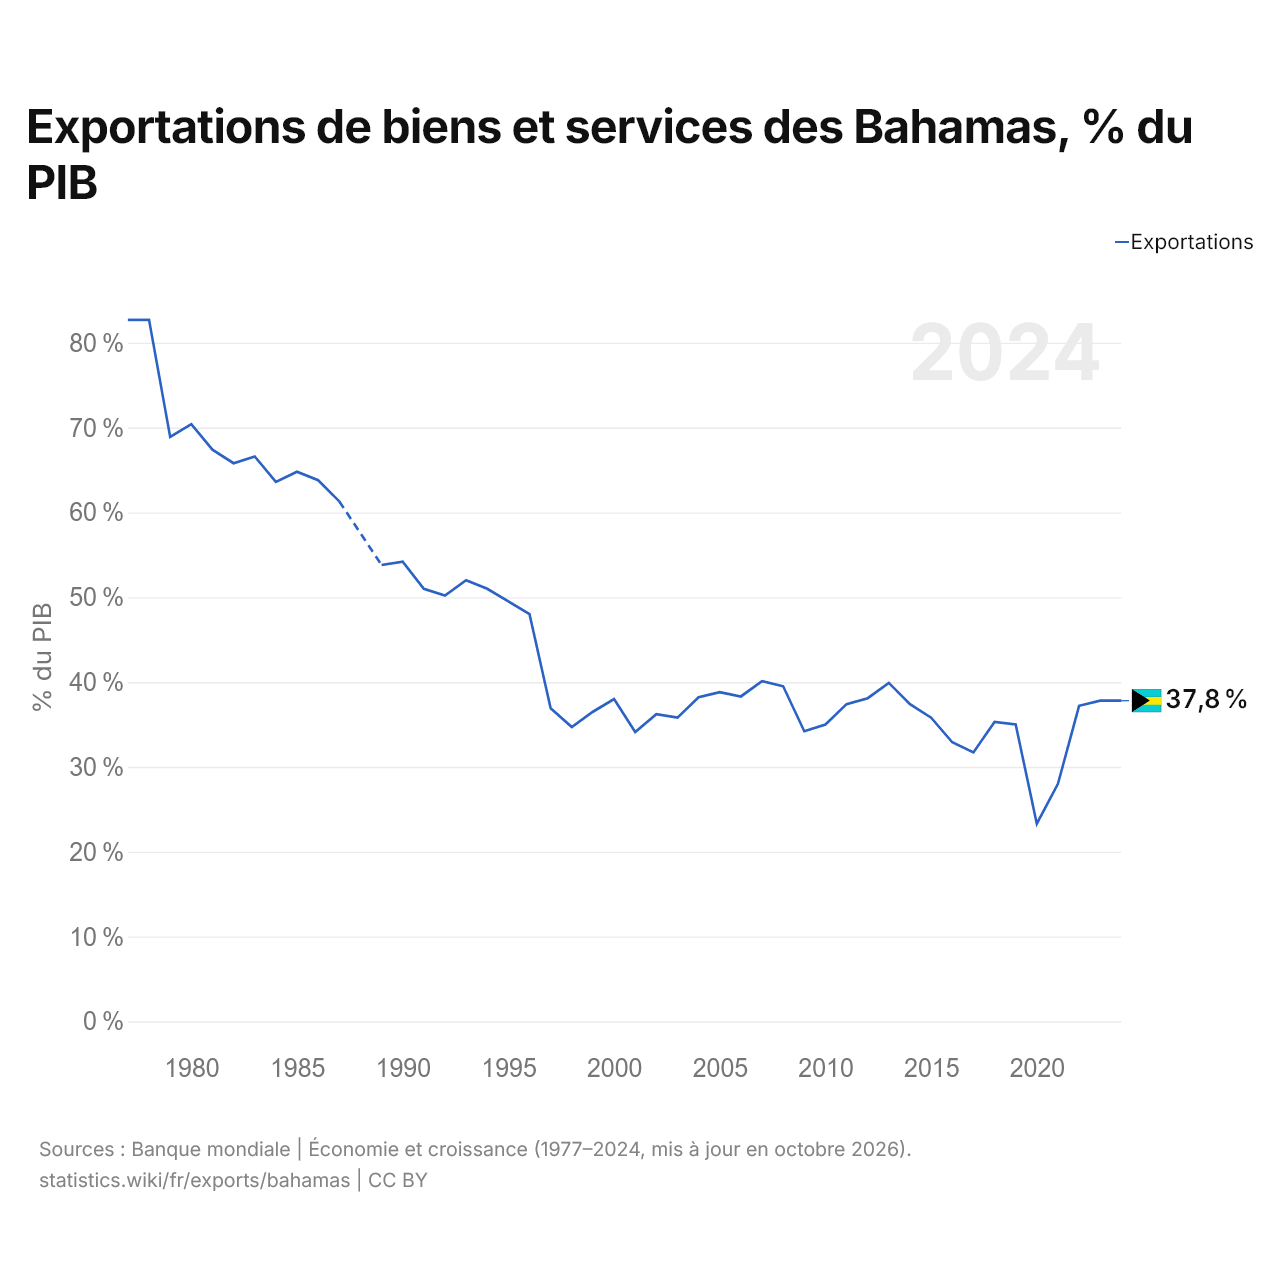
Les exportations de biens et services des Bahamas équivalent à 37,8 % de leur PIB (2024), contre 82,7 % en 1977. La part la plus faible a été de 23,3 %, en 2020.
Comparer les exportations des Bahamas avec celles d'autres pays
Sources :
- Banque mondiale | Économie et croissance (1976–2025, mis à jour en octobre 2026)
- TradeMap (2001–2025, mis à jour en octobre 2026)
Creative Commons Attribution (CC BY) : vous pouvez copier, partager, adapter et réutiliser ce contenu, y compris à des fins commerciales, à condition de citer statistics.wiki et d’indiquer les modifications apportées. Les sources citées ci-dessus peuvent avoir leurs propres conditions de licence.