
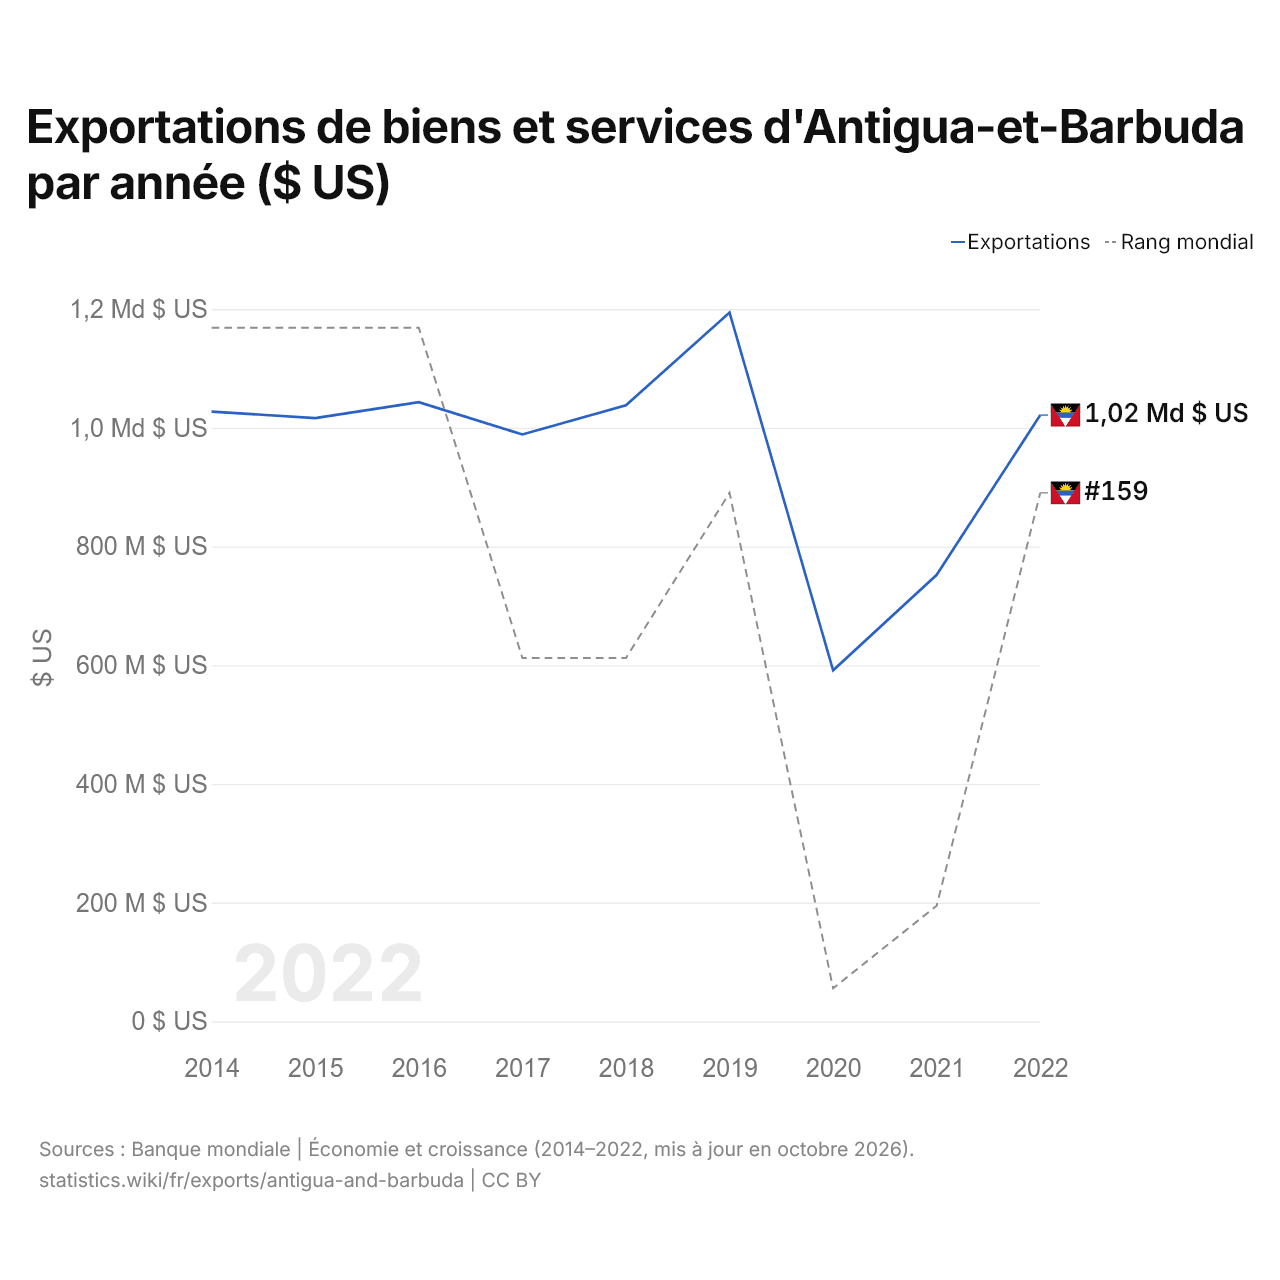
Exportations de biens et services d'Antigua-et-Barbuda par année ($ US)
| Année | $ US | Rang mondial |
|---|---|---|
| Exportations | Rang mondial | |
| 2022 | 1 021 455 556 $ US | #159 |
| 2021 | 752 377 778 $ US | #164 |
| 2020 | 591 277 778 $ US | #165 |
| 2019 | 1 194 092 593 $ US | #159 |
| 2018 | 1 037 966 667 $ US | #161 |
| 2017 | 988 692 593 $ US | #161 |
| 2016 | 1 043 081 481 $ US | #157 |
| 2015 | 1 016 366 667 $ US | #157 |
| 2014 | 1 027 285 185 $ US | #157 |
Les exportations de biens et services d'Antigua-et-Barbuda s'élèvent à 1,02 milliard de dollars (2022), contre 1,03 milliard de dollars en 2014. Le maximum a été de 1,19 milliard de dollars, en 2019. Elles se classent au 159e rang mondial, en hausse par rapport au 164e rang l'année précédente. Leur meilleur rang a été le 157e, occupé pour la dernière fois en 2016.
Les exportations de biens et services d'Antigua-et-Barbuda sont les 26es plus élevées de 27 pays situés en Amérique latine. Les importations de biens et services d'Antigua-et-Barbuda s'élèvent à 1,18 milliard de dollars (2022), au 160e rang mondial. Les importations d'Antigua-et-Barbuda dépassent ses exportations de 154 millions de dollars, soit un déficit commercial (2022).
Exportations de biens d'Antigua-et-Barbuda par catégorie, 2025
Exportations de biens, 2025: 36,4 M $US
En 2025, la première catégorie des exportations de biens d'Antigua-et-Barbuda était « machines, électronique et véhicules », avec 24,9 %, suivie de « pétrole, gaz, minerais et autres matières premières », avec 21,0 %.
Destinations des exportations de biens d'Antigua-et-Barbuda : les 10 premières, 2025
| Rang | Pays | Exportations de biens | Part | |
|---|---|---|---|---|
| 1 |
 États-Unis |
10,2 M $US | 28,2 % | |
| 2 |
 Royaume-Uni |
3,24 M $US | 8,9 % | |
| 3 |
 Pays-Bas |
2,97 M $US | 8,16 % | |
| 4 |
 Chine |
2,36 M $US | 6,5 % | |
| 5 |
 Sainte-Lucie |
1,57 M $US | 4,32 % | |
| 6 |
 France |
1,36 M $US | 3,75 % | |
| 7 |
 Saint-Christophe |
985 k $US | 2,71 % | |
| 8 |
 Espagne |
926 k $US | 2,54 % | |
| 9 |
 Dominique |
535 k $US | 1,47 % | |
| 10 |
 Trinité-et-Tobago |
401 k $US | 1,1 % | |
| Autres partenaires et non précisés | 11,8 M $US | 32,4 % |
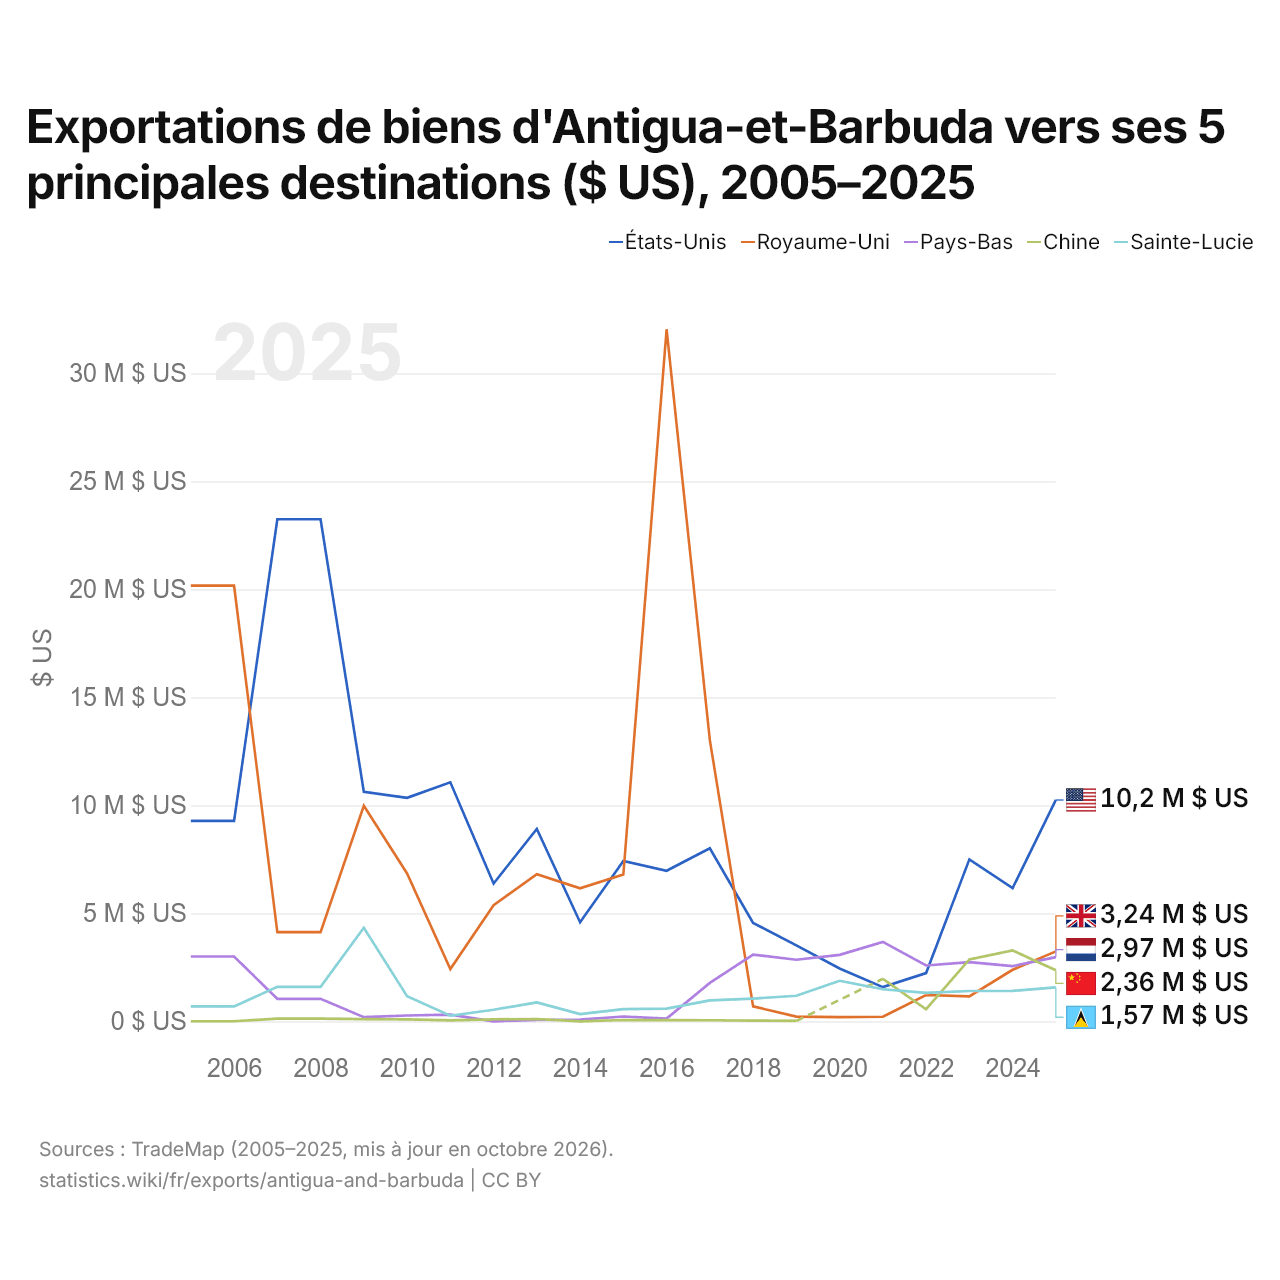
Exportations de biens d'Antigua-et-Barbuda vers ses 5 principales destinations ($ US), 2005–2025
| Année | $ US | ||||
|---|---|---|---|---|---|
| États-Unis | Royaume-Uni | Pays-Bas | Chine | Sainte-Lucie | |
| 2025 | 10 248 000 $ US | 3 239 000 $ US | 2 970 000 $ US | 2 364 000 $ US | 1 572 000 $ US |
| 2024 | 6 165 000 $ US | 2 387 000 $ US | 2 556 000 $ US | 3 283 000 $ US | 1 410 000 $ US |
| 2023 | 7 498 000 $ US | 1 154 000 $ US | 2 742 000 $ US | 2 865 000 $ US | 1 404 000 $ US |
| 2022 | 2 233 000 $ US | 1 220 000 $ US | 2 585 000 $ US | 559 000 $ US | 1 318 000 $ US |
| 2021 | 1 583 000 $ US | 214 000 $ US | 3 677 000 $ US | 1 969 000 $ US | 1 487 000 $ US |
| 2020 | 2 449 000 $ US | 192 000 $ US | 3 077 000 $ US | - | 1 877 000 $ US |
| 2019 | 3 514 000 $ US | 217 000 $ US | 2 850 000 $ US | 19 000 $ US | 1 182 000 $ US |
| 2018 | 4 556 000 $ US | 692 000 $ US | 3 090 000 $ US | 35 000 $ US | 1 054 000 $ US |
| 2017 | 8 015 000 $ US | 13 020 000 $ US | 1 781 000 $ US | 51 000 $ US | 972 000 $ US |
| 2016 | 6 972 000 $ US | 32 040 000 $ US | 124 000 $ US | 54 000 $ US | 590 000 $ US |
| 2015 | 7 427 000 $ US | 6 797 000 $ US | 224 000 $ US | 62 000 $ US | 567 000 $ US |
| 2014 | 4 585 000 $ US | 6 155 000 $ US | 77 000 $ US | 1 000 $ US | 336 000 $ US |
| 2013 | 8 911 000 $ US | 6 812 000 $ US | 66 000 $ US | 109 000 $ US | 875 000 $ US |
| 2012 | 6 382 000 $ US | 5 375 000 $ US | 1 000 $ US | 92 000 $ US | 538 000 $ US |
| 2011 | 11 067 000 $ US | 2 419 000 $ US | 308 000 $ US | 46 000 $ US | 259 000 $ US |
| 2010 | 10 346 000 $ US | 6 849 000 $ US | 270 000 $ US | 92 000 $ US | 1 163 000 $ US |
| 2009 | 10 627 000 $ US | 9 984 000 $ US | 195 000 $ US | 101 000 $ US | 4 332 000 $ US |
| 2008 | 23 245 000 $ US | 4 130 000 $ US | 1 043 000 $ US | 124 000 $ US | 1 597 000 $ US |
| 2007 | 23 245 000 $ US | 4 130 000 $ US | 1 043 000 $ US | 124 000 $ US | 1 597 000 $ US |
| 2006 | 9 277 000 $ US | 20 168 000 $ US | 3 002 000 $ US | 4 000 $ US | 692 000 $ US |
| 2005 | 9 277 000 $ US | 20 168 000 $ US | 3 002 000 $ US | 4 000 $ US | 692 000 $ US |
En 2025, les exportations de biens s'élevaient à 10,2 millions de dollars vers les États-Unis, 3,24 millions de dollars vers le Royaume-Uni, 2,97 millions de dollars vers les Pays-Bas, 2,36 millions de dollars vers la Chine et 1,57 million de dollars vers Sainte-Lucie. Le premier rang des cinq destinations d'Antigua-et-Barbuda est occupé par les États-Unis depuis 2023. Le changement le plus récent dans leur ordre remonte à 2025, quand les exportations d'Antigua-et-Barbuda vers le Royaume-Uni ont dépassé celles vers les Pays-Bas.
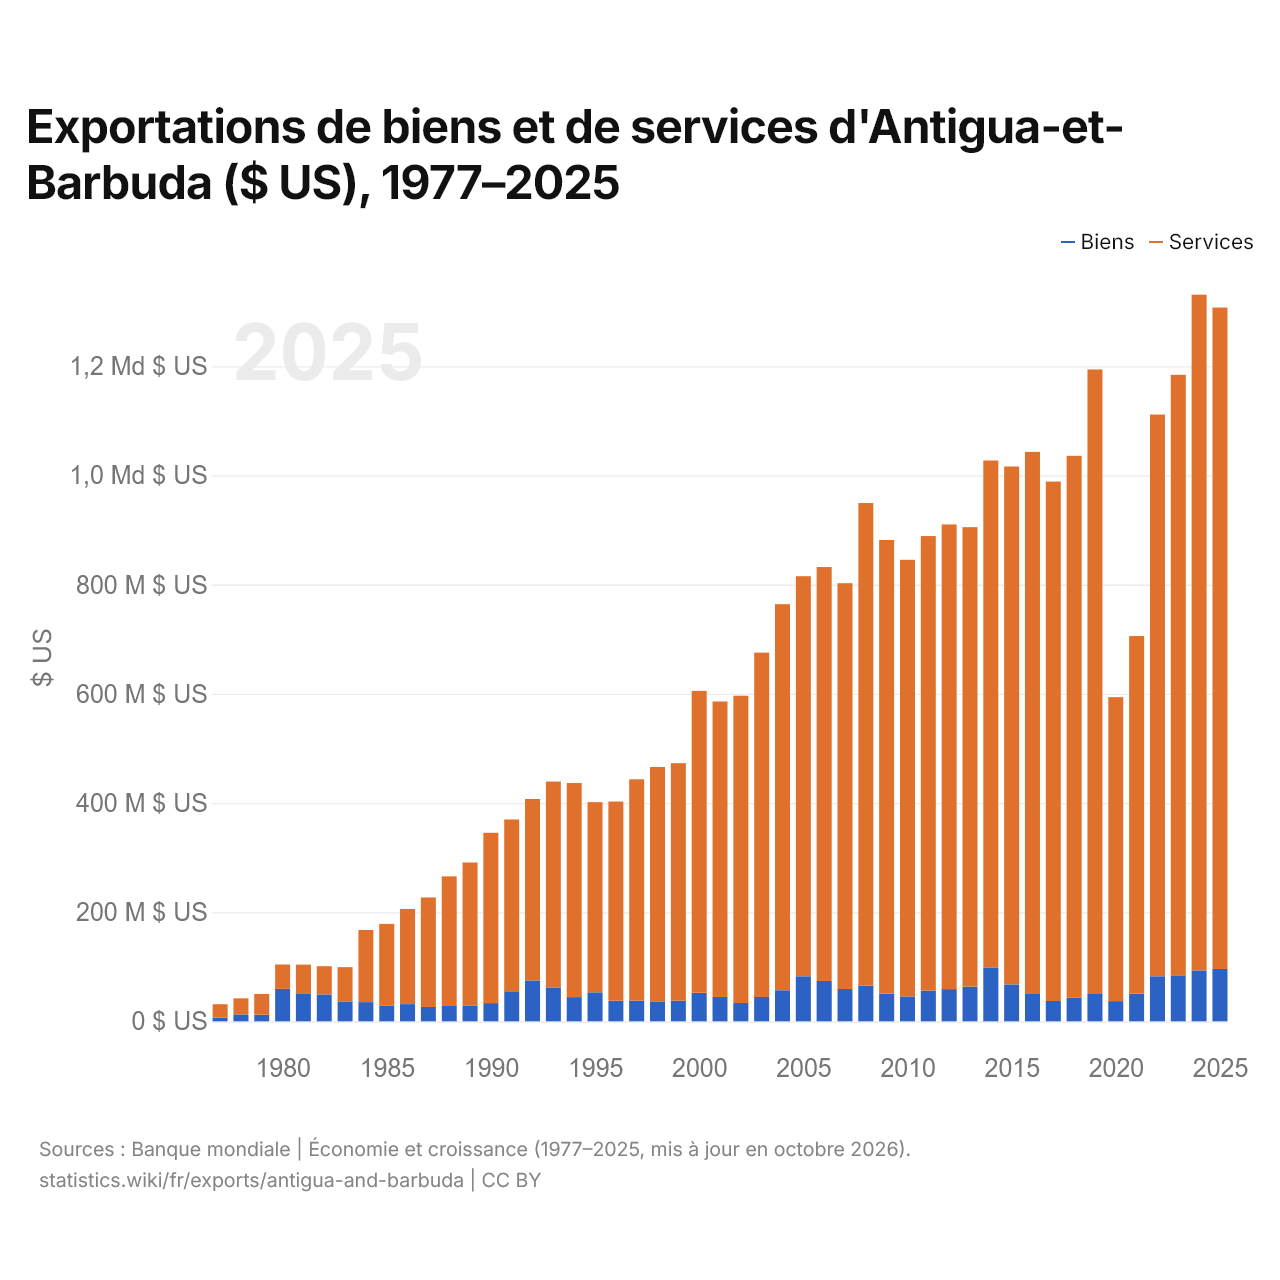
Exportations de biens et de services d'Antigua-et-Barbuda ($ US), 1977–2025
| Année | $ US | |
|---|---|---|
| Biens | Services | |
| 2025 | 96 003 268 $ US | 1 211 430 374 $ US |
| 2024 | 93 409 894 $ US | 1 237 661 384 $ US |
| 2023 | 84 434 882 $ US | 1 099 806 436 $ US |
| 2022 | 82 674 688 $ US | 1 028 839 011 $ US |
| 2021 | 50 554 548 $ US | 655 142 283 $ US |
| 2020 | 37 147 485 $ US | 556 783 970 $ US |
| 2019 | 50 071 207 $ US | 1 144 014 004 $ US |
| 2018 | 42 970 058 $ US | 992 975 685 $ US |
| 2017 | 37 177 842 $ US | 951 516 081 $ US |
| 2016 | 50 060 383 $ US | 993 021 884 $ US |
| 2015 | 67 572 502 $ US | 948 793 867 $ US |
| 2014 | 98 707 946 $ US | 928 576 599 $ US |
| 2013 | 63 497 723 $ US | 841 739 707 $ US |
| 2012 | 59 042 073 $ US | 851 106 541 $ US |
| 2011 | 56 151 357 $ US | 832 747 230 $ US |
| 2010 | 45 715 381 $ US | 799 738 496 $ US |
| 2009 | 50 741 040 $ US | 830 922 844 $ US |
| 2008 | 65 385 681 $ US | 883 983 991 $ US |
| 2007 | 59 283 602 $ US | 743 317 728 $ US |
| 2006 | 73 995 931 $ US | 758 147 239 $ US |
| 2005 | 82 670 221 $ US | 732 676 400 $ US |
| 2004 | 57 061 044 $ US | 707 074 324 $ US |
| 2003 | 44 725 100 $ US | 630 612 524 $ US |
| 2002 | 33 639 382 $ US | 562 757 954 $ US |
| 2001 | 44 649 630 $ US | 541 279 385 $ US |
| 2000 | 52 353 967 $ US | 553 022 068 $ US |
| 1999 | 37 875 585 $ US | 434 956 523 $ US |
| 1998 | 36 433 333 $ US | 429 466 667 $ US |
| 1997 | 37 874 074 $ US | 405 414 815 $ US |
| 1996 | 38 033 333 $ US | 364 488 889 $ US |
| 1995 | 53 144 444 $ US | 348 462 963 $ US |
| 1994 | 44 448 148 $ US | 392 011 111 $ US |
| 1993 | 62 077 778 $ US | 377 088 889 $ US |
| 1992 | 75 007 407 $ US | 332 362 963 $ US |
| 1991 | 55 203 704 $ US | 314 659 259 $ US |
| 1990 | 33 425 926 $ US | 311 874 074 $ US |
| 1989 | 29 144 444 $ US | 261 792 593 $ US |
| 1988 | 28 192 593 $ US | 237 333 333 $ US |
| 1987 | 26 303 704 $ US | 200 681 481 $ US |
| 1986 | 31 529 630 $ US | 174 362 963 $ US |
| 1985 | 28 300 000 $ US | 150 300 000 $ US |
| 1984 | 35 200 000 $ US | 132 100 000 $ US |
| 1983 | 36 500 000 $ US | 62 800 000 $ US |
| 1982 | 49 300 000 $ US | 51 700 000 $ US |
| 1981 | 51 400 000 $ US | 52 500 000 $ US |
| 1980 | 59 500 000 $ US | 44 600 000 $ US |
| 1979 | 12 000 000 $ US | 38 200 000 $ US |
| 1978 | 12 600 000 $ US | 29 500 000 $ US |
| 1977 | 6 600 000 $ US | 24 700 000 $ US |
En 2025, les exportations de biens d'Antigua-et-Barbuda s'élevaient à 96 millions de dollars et celles de services à 1,21 milliard de dollars ; les services représentaient 92,7 % du total, contre 78,9 % en 1977.
Antigua-et-Barbuda dans le classement mondial des exportations
| Rang | Pays | Exportations | Part mondiale | |
|---|---|---|---|---|
| 156 |
 Cap-Vert |
1,28 Md $US (2025) | 0,004 % | |
| 157 |
 Lesotho |
1,27 Md $US (2025) | 0,004 % | |
| 158 |
 Bhoutan |
1,05 Md $US (2024) | 0,003 % | |
| 159 |
 Antigua-et-Barbuda |
1,02 Md $US | 0,003 % | |
| 160 |
 Soudan |
664 M $US (2025) | 0,002 % | |
| 161 |
 Îles Salomon |
643 M $US (2024) | 0,002 % | |
| 162 |
 RCA |
593 M $US (2025) | 0,002 % |
Exportations de biens et services d'Antigua-et-Barbuda, % du PIB
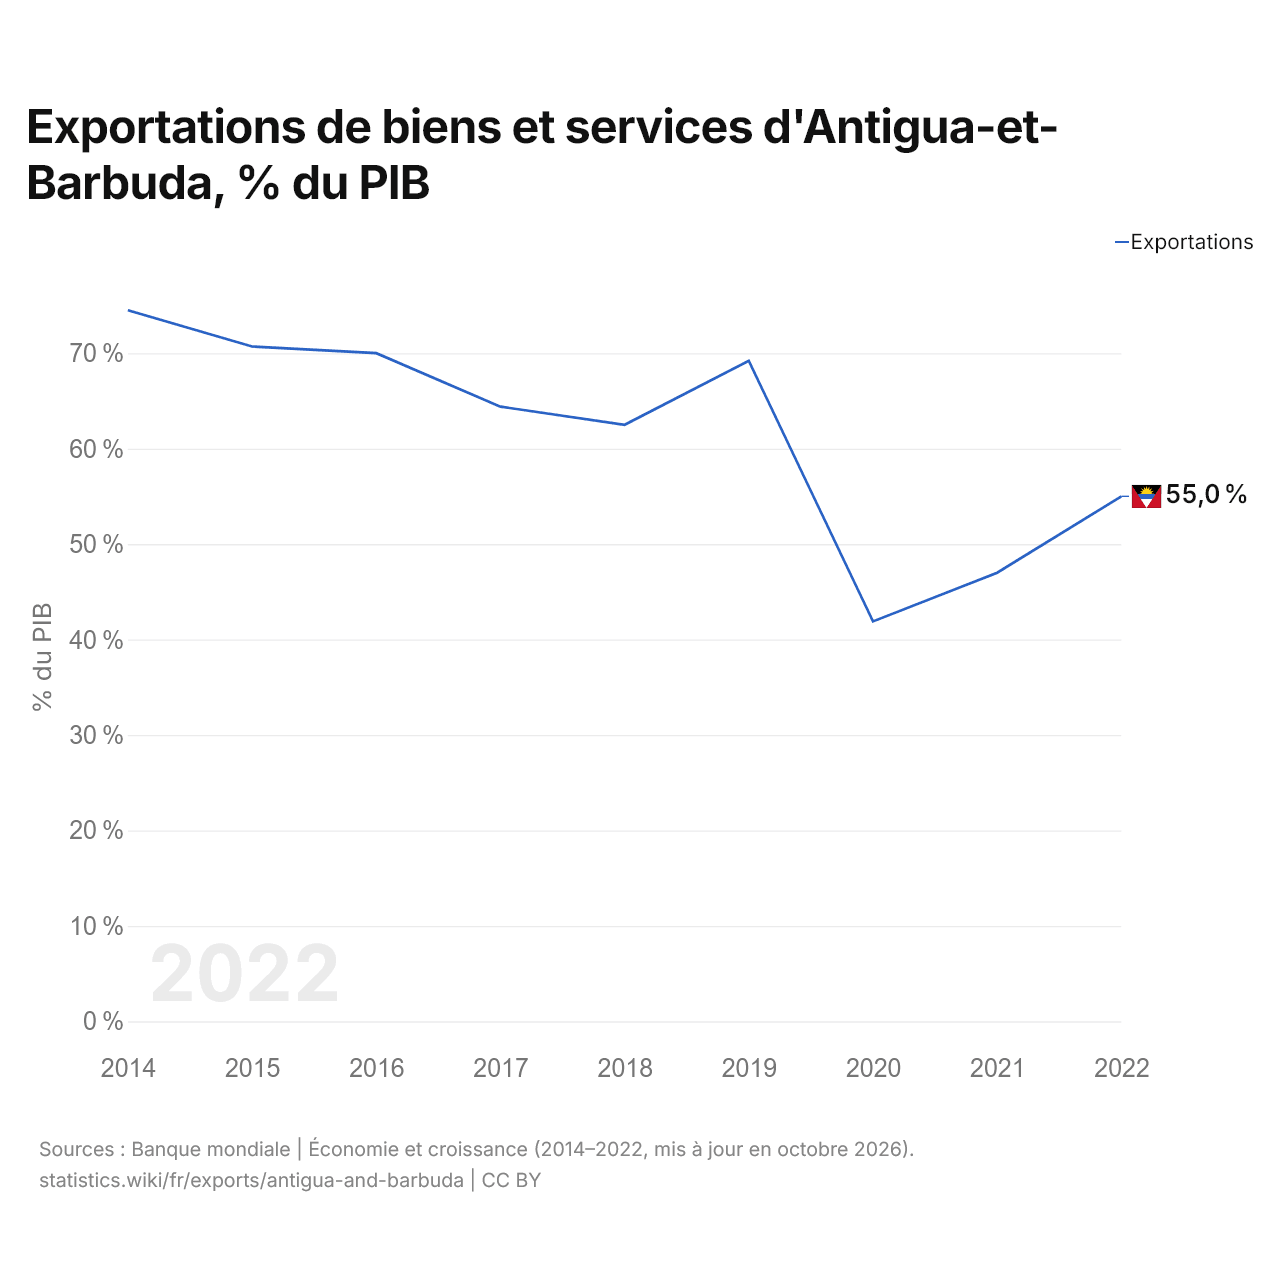
Les exportations de biens et services d'Antigua-et-Barbuda équivalent à 55,0 % de son PIB (2022), contre 74,5 % en 2014. La part la plus faible a été de 41,9 %, en 2020.
Comparer les exportations d'Antigua-et-Barbuda avec celles d'autres pays
Sources :
- TradeMap (2005–2025, mis à jour en octobre 2026)
- Banque mondiale | Économie et croissance (1977–2025, mis à jour en octobre 2026)
Creative Commons Attribution (CC BY) : vous pouvez copier, partager, adapter et réutiliser ce contenu, y compris à des fins commerciales, à condition de citer statistics.wiki et d’indiquer les modifications apportées. Les sources citées ci-dessus peuvent avoir leurs propres conditions de licence.