
Exportations de biens et services des Îles Salomon par année ($ US)
| Année | $ US | Rang mondial |
|---|---|---|
| Exportations | Rang mondial | |
| 2024 | 642 590 820 $ US | #161 |
| 2023 | 546 110 325 $ US | #163 |
| 2022 | 412 603 523 $ US | #165 |
| 2021 | 413 817 855 $ US | #166 |
| 2020 | 429 176 032 $ US | #167 |
| 2019 | 590 941 419 $ US | #165 |
| 2018 | 680 540 283 $ US | #165 |
| 2017 | 568 502 382 $ US | #165 |
| 2016 | 548 051 856 $ US | #163 |
| 2015 | 527 879 238 $ US | #163 |
| 2014 | 565 434 186 $ US | #162 |
| 2013 | 590 649 173 $ US | #160 |
| 2012 | 591 554 033 $ US | #158 |
| 2011 | 533 563 828 $ US | #155 |
| 2010 | 315 704 592 $ US | #156 |
| 2009 | 234 871 525 $ US | #156 |
| 2008 | 269 628 043 $ US | #156 |
| 2007 | 223 522 543 $ US | #156 |
| 2006 | 167 049 900 $ US | #156 |
| 2005 | 150 928 747 $ US | #155 |
| 2004 | 116 441 671 $ US | #154 |
| 2003 | 91 885 444 $ US | #154 |
| 2002 | 74 532 078 $ US | #155 |
| 2001 | 71 807 707 $ US | #153 |
| 2000 | 113 776 351 $ US | #149 |
| 1999 | 177 960 878 $ US | #144 |
| 1998 | 185 437 103 $ US | #144 |
| 1997 | 238 637 030 $ US | #142 |
| 1996 | 230 487 237 $ US | #140 |
| 1995 | 211 397 868 $ US | #141 |
| 1994 | 199 917 481 $ US | #132 |
| 1993 | 177 241 946 $ US | #133 |
| 1992 | 144 120 761 $ US | #129 |
| 1991 | 120 084 722 $ US | #129 |
| 1990 | 99 652 679 $ US | #128 |
| 1989 | 107 271 714 $ US | #117 |
| 1988 | 109 963 088 $ US | #114 |
| 1987 | 88 853 747 $ US | #113 |
| 1986 | 86 706 862 $ US | #110 |
| 1985 | 79 013 106 $ US | #112 |
| 1984 | 101 278 543 $ US | #110 |
| 1983 | 86 195 038 $ US | #110 |
| 1982 | 91 648 268 $ US | #109 |
| 1981 | 91 936 481 $ US | #109 |
| 1980 | 86 765 073 $ US | #109 |
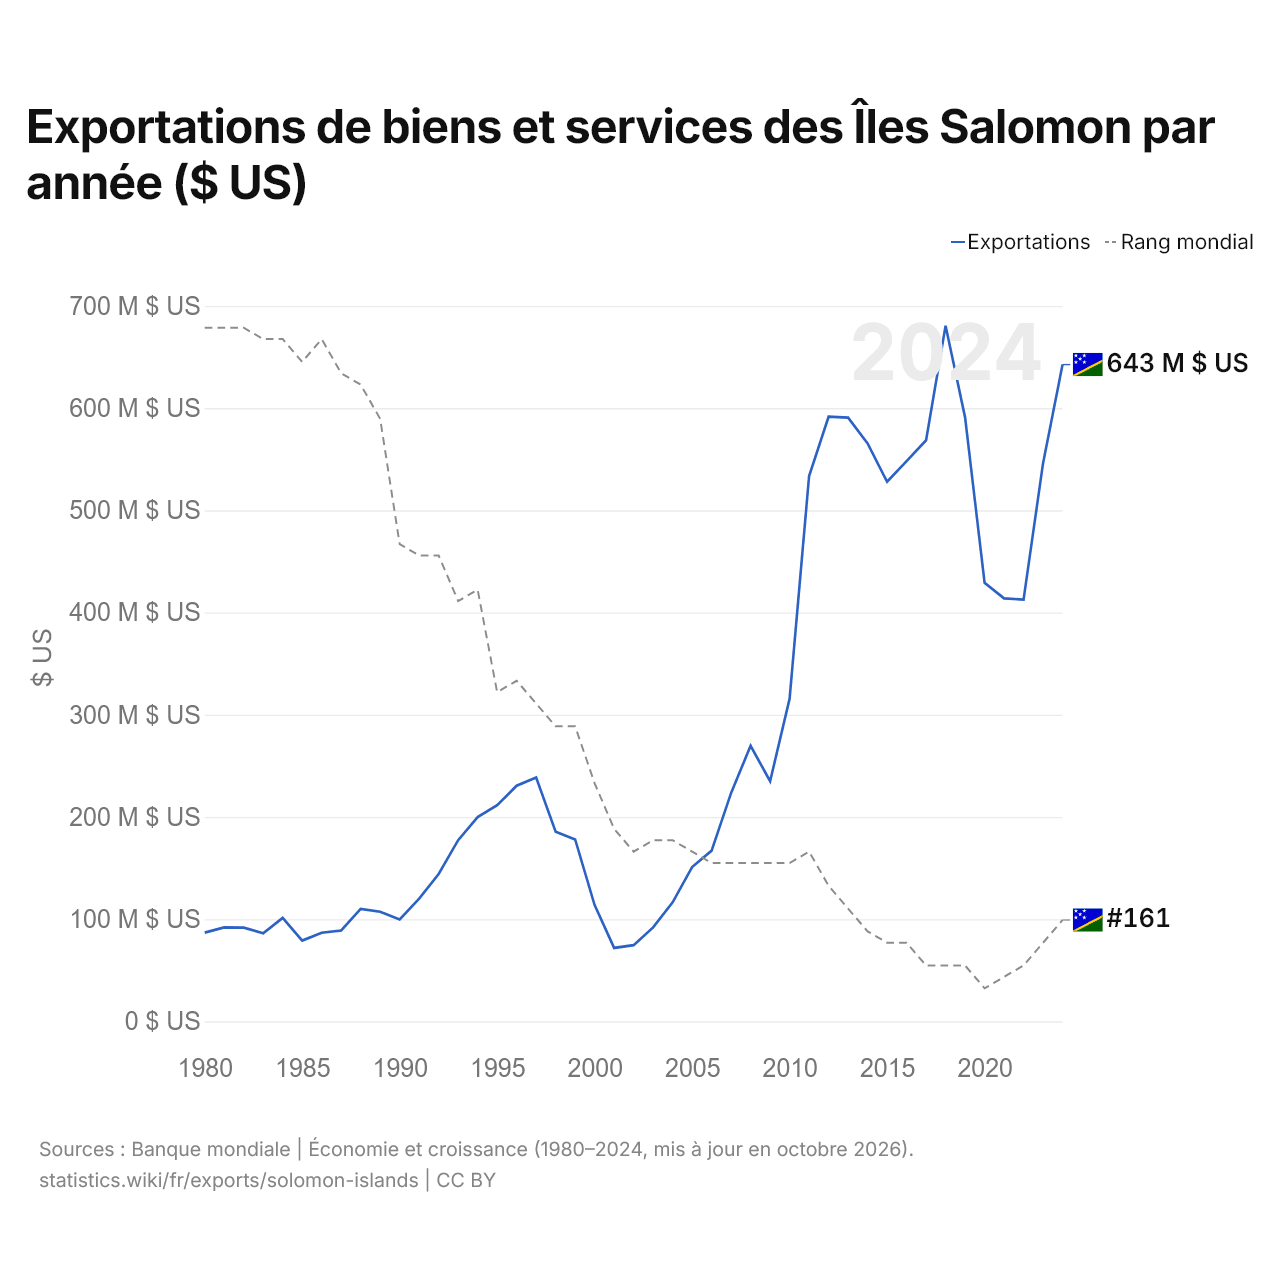
Les exportations de biens et services des Îles Salomon s'élèvent à 643 millions de dollars (2024), contre 86,8 millions de dollars en 1980. Le maximum a été de 681 millions de dollars, en 2018. Elles se classent au 161e rang mondial, en hausse par rapport au 163e rang l'année précédente. Leur meilleur rang a été le 109e, occupé pour la dernière fois en 1982.
Les exportations de biens et services des Îles Salomon sont les 5es plus élevées de 12 pays situés en Océanie. Les importations de biens et services des Îles Salomon s'élèvent à 1,12 milliard de dollars (2024), au 161e rang mondial. Les importations des Îles Salomon dépassent leurs exportations de 479 millions de dollars, soit un déficit commercial (2024).
Exportations de biens des Îles Salomon par catégorie, 2025
Exportations de biens, 2025: 704 M $US
En 2025, la première catégorie des exportations de biens des Îles Salomon était « métaux précieux, pierres précieuses, bijoux, montres, instruments de musique et art », avec 35,9 %, suivie de « bois, papier et imprimés », avec 19,5 %.
Destinations des exportations de biens des Îles Salomon : les 10 premières, 2025
| Rang | Pays | Exportations de biens | Part | |
|---|---|---|---|---|
| 1 |
 Australie |
232 M $US | 32,9 % | |
| 2 |
 Chine |
230 M $US | 32,6 % | |
| 3 |
 Malaisie |
44,7 M $US | 6,35 % | |
| 4 |
 Italie |
36,4 M $US | 5,17 % | |
| 5 |
 Pays-Bas |
31,7 M $US | 4,51 % | |
| 6 |
 Espagne |
21,3 M $US | 3,02 % | |
| 7 |
 Indonésie |
13,8 M $US | 1,96 % | |
| 8 |
 Suisse |
12,1 M $US | 1,72 % | |
| 9 |
 Royaume-Uni |
7,93 M $US | 1,13 % | |
| 10 |
 Nouvelle-Zélande |
7,75 M $US | 1,1 % | |
| Autres partenaires et non précisés | 67,2 M $US | 9,55 % |
Exportations de biens des Îles Salomon vers leurs 5 principales destinations ($ US), 2001–2025
| Année | $ US | ||||
|---|---|---|---|---|---|
| Australie | Chine | Malaisie | Italie | Pays-Bas | |
| 2025 | 231 729 000 $ US | 229 573 000 $ US | 44 715 000 $ US | 36 434 000 $ US | 31 745 000 $ US |
| 2024 | 93 871 000 $ US | 241 763 000 $ US | 11 381 000 $ US | - | 29 820 000 $ US |
| 2023 | 58 872 000 $ US | 183 427 000 $ US | 4 910 000 $ US | - | 32 302 000 $ US |
| 2022 | 16 892 000 $ US | 136 719 000 $ US | 3 850 000 $ US | - | 30 361 000 $ US |
| 2021 | 10 820 000 $ US | 184 559 000 $ US | 7 920 000 $ US | - | 19 910 000 $ US |
| 2020 | 5 217 000 $ US | 246 627 000 $ US | 6 977 000 $ US | - | 16 329 000 $ US |
| 2019 | 5 017 000 $ US | 380 353 000 $ US | 8 772 000 $ US | 41 102 000 $ US | 10 912 000 $ US |
| 2018 | 5 017 000 $ US | 380 353 000 $ US | 8 772 000 $ US | 41 102 000 $ US | 10 912 000 $ US |
| 2017 | 4 120 000 $ US | 325 830 000 $ US | 7 553 000 $ US | 38 696 000 $ US | 15 005 000 $ US |
| 2016 | 5 064 000 $ US | 273 318 000 $ US | 12 822 000 $ US | 30 511 000 $ US | 3 028 000 $ US |
| 2015 | 5 659 000 $ US | 232 211 000 $ US | 12 617 000 $ US | 27 658 000 $ US | 248 000 $ US |
| 2014 | 48 574 000 $ US | 263 848 000 $ US | 11 999 000 $ US | 26 883 000 $ US | 237 000 $ US |
| 2013 | 110 722 000 $ US | 219 154 000 $ US | 7 669 000 $ US | 30 770 000 $ US | 2 000 $ US |
| 2012 | 117 632 000 $ US | 180 182 000 $ US | 4 511 000 $ US | 17 211 000 $ US | - |
| 2011 | 72 804 000 $ US | 181 117 000 $ US | 7 789 000 $ US | 18 656 000 $ US | 20 689 000 $ US |
| 2010 | 8 908 000 $ US | 109 407 000 $ US | 1 969 000 $ US | 7 728 000 $ US | - |
| 2009 | 7 201 000 $ US | 96 574 000 $ US | 5 299 000 $ US | 8 683 000 $ US | - |
| 2008 | 8 832 000 $ US | 93 643 000 $ US | 369 000 $ US | 11 723 000 $ US | - |
| 2007 | 5 813 000 $ US | 94 703 000 $ US | 2 958 000 $ US | 8 015 000 $ US | 21 000 $ US |
| 2006 | 4 867 000 $ US | 53 907 000 $ US | 1 176 000 $ US | 2 797 000 $ US | 7 000 $ US |
| 2005 | 2 663 000 $ US | 33 553 000 $ US | 1 323 000 $ US | - | - |
| 2004 | 4 307 000 $ US | 22 476 000 $ US | 455 000 $ US | 5 000 $ US | - |
| 2003 | 2 099 000 $ US | 17 049 000 $ US | 55 000 $ US | - | - |
| 2002 | 1 834 000 $ US | 7 534 000 $ US | 1 538 000 $ US | 27 000 $ US | - |
| 2001 | 1 694 000 $ US | 1 628 000 $ US | 255 000 $ US | - | 58 000 $ US |
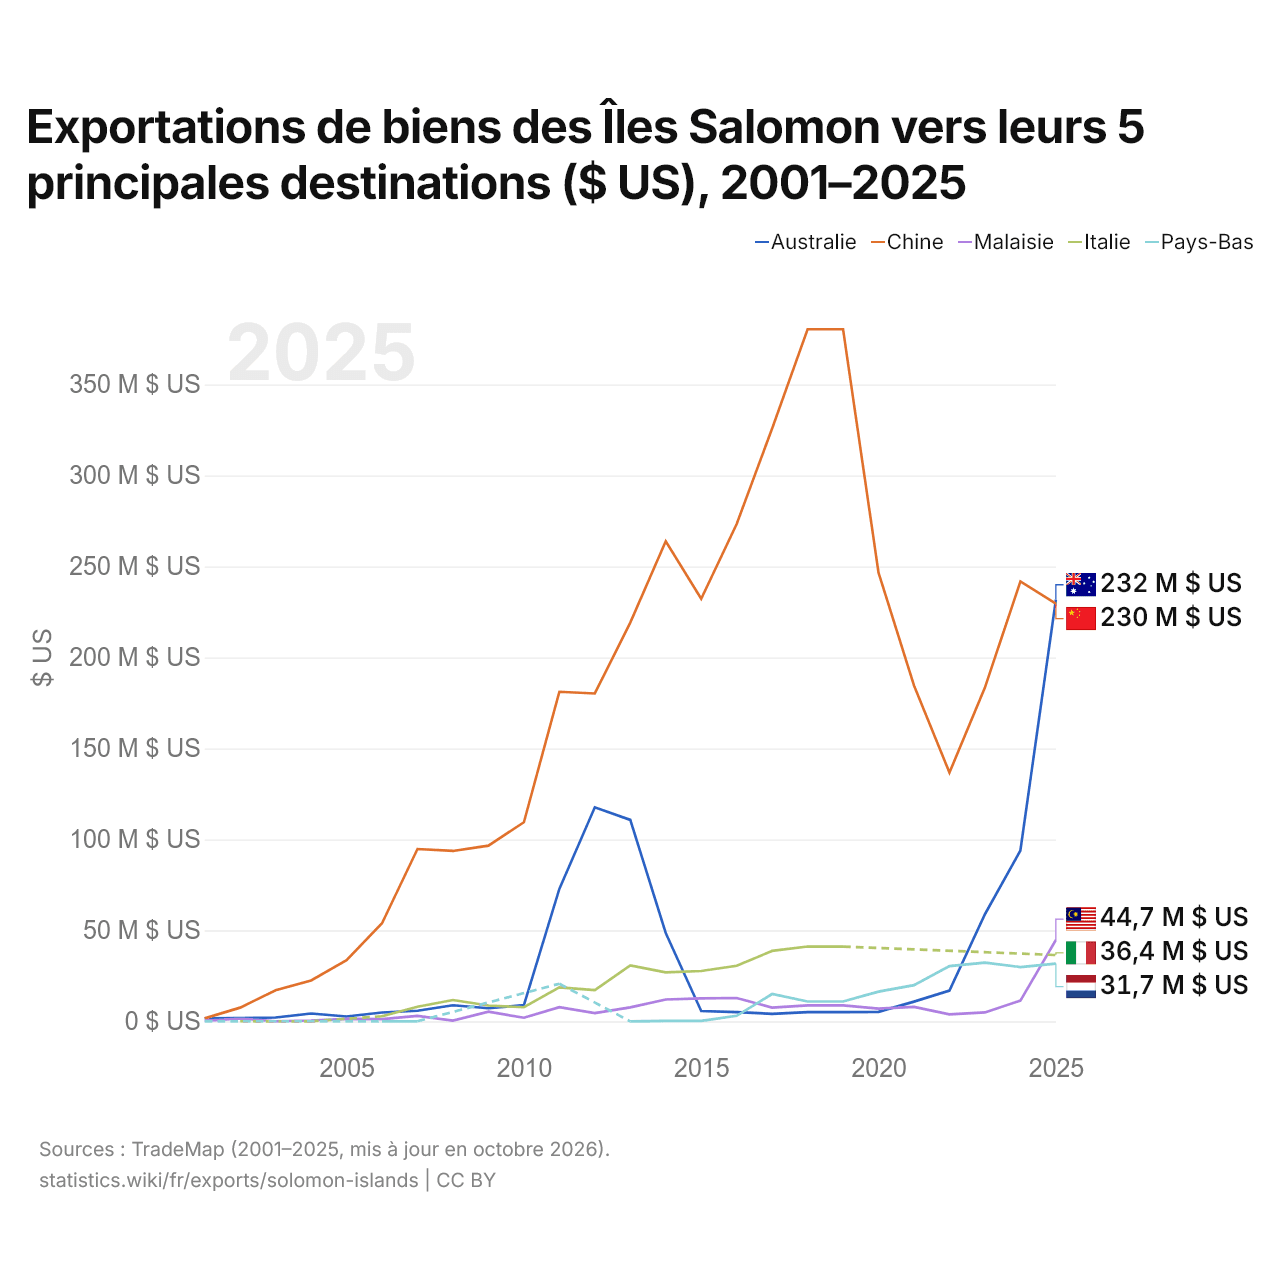
En 2025, les exportations de biens s'élevaient à 232 millions de dollars vers l'Australie, 230 millions de dollars vers la Chine, 44,7 millions de dollars vers la Malaisie, 36,4 millions de dollars vers l'Italie et 31,7 millions de dollars vers les Pays-Bas.
Exportations de biens et de services des Îles Salomon ($ US)
| Année | $ US | |
|---|---|---|
| Biens | Services | |
| 2024 | 510 244 191 $ US | 132 632 606 $ US |
| 2023 | 430 769 828 $ US | 115 254 830 $ US |
| 2022 | 340 868 968 $ US | 70 490 176 $ US |
| 2021 | 371 236 827 $ US | 42 420 404 $ US |
| 2020 | 378 712 319 $ US | 50 121 312 $ US |
| 2019 | 460 924 260 $ US | 130 368 313 $ US |
| 2018 | 535 980 418 $ US | 144 676 279 $ US |
| 2017 | 467 990 273 $ US | 125 896 431 $ US |
| 2016 | 432 138 585 $ US | 122 721 264 $ US |
| 2015 | 420 708 944 $ US | 105 227 004 $ US |
| 2014 | 455 210 234 $ US | 112 561 336 $ US |
| 2013 | 447 808 090 $ US | 125 701 929 $ US |
| 2012 | 499 690 096 $ US | 119 114 190 $ US |
| 2011 | 419 650 143 $ US | 117 494 183 $ US |
| 2010 | 223 952 032 $ US | 91 707 421 $ US |
| 2009 | 164 901 408 $ US | 59 187 724 $ US |
| 2008 | 209 841 148 $ US | 49 556 968 $ US |
| 2007 | 164 456 236 $ US | 54 198 061 $ US |
| 2006 | 113 984 570 $ US | 48 588 523 $ US |
| 2005 | 104 757 514 $ US | 41 423 537 $ US |
| 2004 | 85 642 877 $ US | 30 798 889 $ US |
| 2003 | 66 626 532 $ US | 25 258 921 $ US |
| 2002 | 33 474 237 $ US | 15 959 777 $ US |
| 2001 | 40 039 712 $ US | 51 610 606 $ US |
| 2000 | 69 287 639 $ US | 52 231 011 $ US |
| 1999 | 164 546 649 $ US | 56 323 278 $ US |
| 1998 | 141 829 269 $ US | 55 070 457 $ US |
| 1997 | 156 445 824 $ US | 70 353 539 $ US |
| 1996 | 161 509 289 $ US | 53 135 435 $ US |
| 1995 | 168 296 192 $ US | 41 809 801 $ US |
| 1994 | 142 160 152 $ US | 49 948 983 $ US |
| 1993 | 129 057 219 $ US | 42 443 952 $ US |
| 1992 | 101 738 329 $ US | 36 030 190 $ US |
| 1991 | 83 433 097 $ US | 31 605 120 $ US |
| 1990 | 70 112 768 $ US | 25 348 158 $ US |
| 1989 | 74 697 753 $ US | 26 512 688 $ US |
| 1988 | 81 920 113 $ US | 21 992 621 $ US |
| 1987 | 63 195 990 $ US | 21 025 396 $ US |
| 1986 | 63 853 000 $ US | 16 652 311 $ US |
| 1985 | 70 976 746 $ US | 9 387 029 $ US |
| 1984 | 93 113 441 $ US | 9 499 769 $ US |
| 1983 | 61 990 758 $ US | 15 149 427 $ US |
| 1982 | 58 284 157 $ US | 13 695 747 $ US |
| 1981 | 66 194 244 $ US | 12 986 024 $ US |
| 1980 | 73 268 263 $ US | 11 689 180 $ US |
| 1979 | 68 478 572 $ US | 5 773 910 $ US |
| 1978 | 35 025 134 $ US | 5 265 216 $ US |
| 1977 | 32 822 636 $ US | 3 326 618 $ US |
| 1976 | 24 319 205 $ US | 3 055 176 $ US |
| 1975 | 15 447 722 $ US | 2 487 345 $ US |
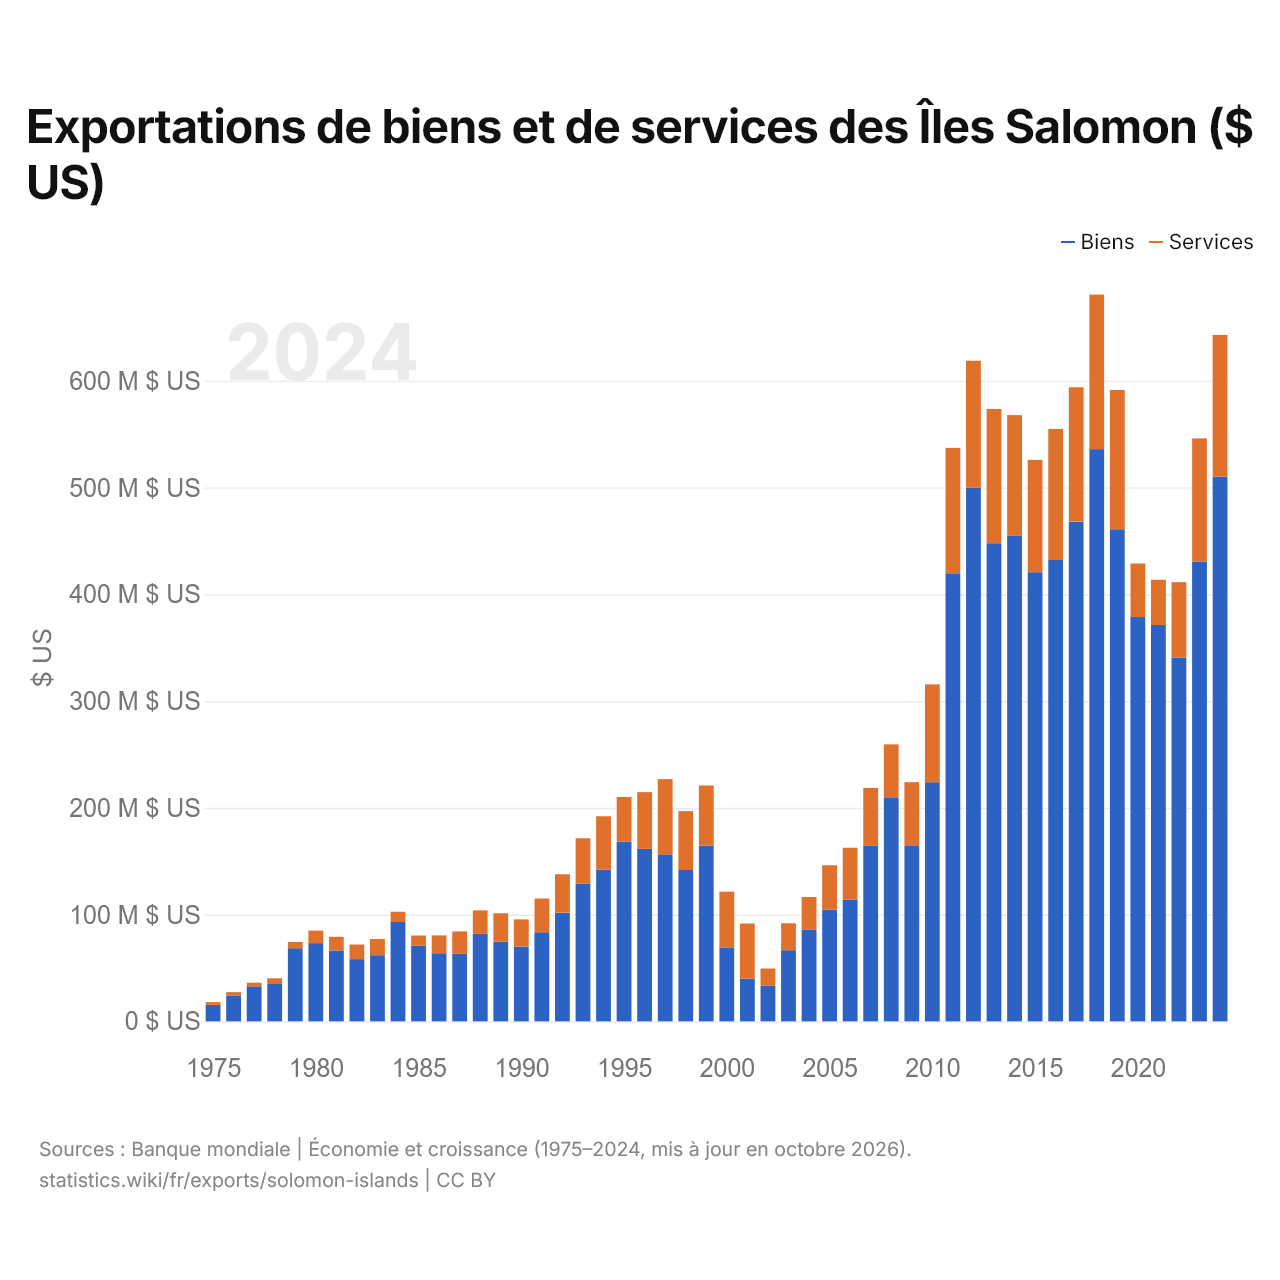
Les exportations de biens des Îles Salomon s'élèvent à 510 millions de dollars (2024) et celles de services à 133 millions de dollars ; les services représentent 20,6 % du total, contre 13,9 % en 1975.
Les Îles Salomon dans le classement mondial des exportations







Exportations de biens et services des Îles Salomon, % du PIB
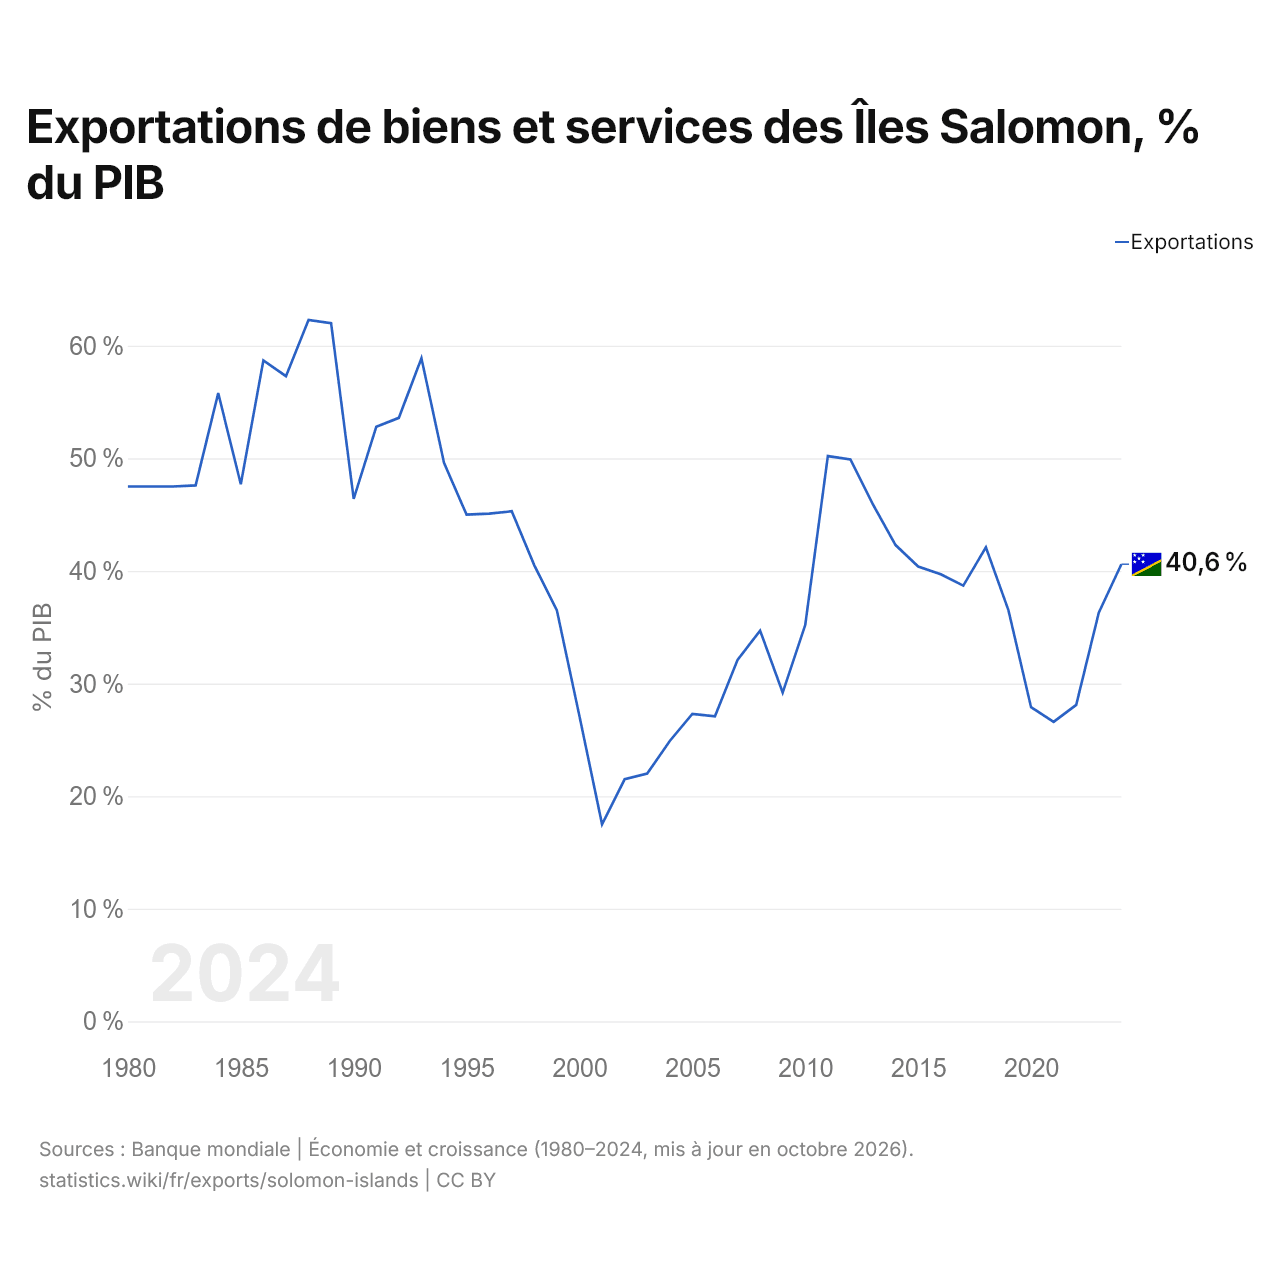
Les exportations de biens et services des Îles Salomon équivalent à 40,6 % de leur PIB (2024), contre 47,5 % en 1980. La part la plus élevée a été de 62,3 %, en 1988.
Comparer les exportations des Îles Salomon avec celles d'autres pays
Sources :
- Banque mondiale | Économie et croissance (1975–2025, mis à jour en octobre 2026)
- TradeMap (2001–2025, mis à jour en octobre 2026)
Creative Commons Attribution (CC BY) : vous pouvez copier, partager, adapter et réutiliser ce contenu, y compris à des fins commerciales, à condition de citer statistics.wiki et d’indiquer les modifications apportées. Les sources citées ci-dessus peuvent avoir leurs propres conditions de licence.