
Exportations de biens et services du Ghana par année ($ US)
| Année | $ US | Rang mondial |
|---|---|---|
| Exportations | Rang mondial | |
| 2024 | 29 197 465 999 $ US | #83 |
| 2023 | 25 590 486 225 $ US | #82 |
| 2022 | 25 623 315 467 $ US | #80 |
| 2021 | 23 898 089 227 $ US | #78 |
| 2020 | 22 070 393 252 $ US | #70 |
| 2019 | 25 597 786 148 $ US | #74 |
| 2018 | 22 501 546 549 $ US | #76 |
| 2017 | 20 456 689 540 $ US | #73 |
| 2016 | 17 513 188 147 $ US | #76 |
| 2015 | 16 725 314 358 $ US | #79 |
| 2014 | 15 436 790 167 $ US | #83 |
| 2013 | 15 988 443 998 $ US | #80 |
| 2012 | 16 656 935 875 $ US | #79 |
| 2011 | 14 529 631 106 $ US | #82 |
| 2010 | 9 490 812 129 $ US | #92 |
| 2009 | 7 630 156 153 $ US | #93 |
| 2008 | 7 178 293 982 $ US | #105 |
| 2007 | 6 088 927 418 $ US | #102 |
| 2006 | 5 149 454 654 $ US | #101 |
| 2005 | 3 916 311 040 $ US | #104 |
| 2004 | 3 490 692 555 $ US | #105 |
| 2003 | 3 104 918 871 $ US | #101 |
| 2002 | 2 627 802 407 $ US | #103 |
| 2001 | 2 404 077 313 $ US | #101 |
| 2000 | 2 431 743 617 $ US | #101 |
| 1999 | 2 475 841 481 $ US | #98 |
| 1998 | 2 534 277 965 $ US | #94 |
| 1997 | 2 233 536 788 $ US | #102 |
| 1996 | 2 226 334 937 $ US | #97 |
| 1995 | 1 583 544 040 $ US | #101 |
| 1994 | 1 375 682 237 $ US | #97 |
| 1993 | 1 208 940 821 $ US | #97 |
| 1992 | 1 105 235 207 $ US | #99 |
| 1991 | 1 120 134 374 $ US | #100 |
| 1990 | 993 956 954 $ US | #100 |
| 1989 | 879 299 611 $ US | #91 |
| 1988 | 945 129 549 $ US | #86 |
| 1987 | 997 843 537 $ US | #85 |
| 1986 | 950 751 458 $ US | #82 |
| 1985 | 479 910 714 $ US | #91 |
| 1984 | 354 924 984 $ US | #95 |
| 1983 | 225 418 871 $ US | #97 |
| 1982 | 134 733 894 $ US | #106 |
| 1981 | 200 813 953 $ US | #101 |
| 1980 | 376 348 548 $ US | #94 |
| 1979 | 451 566 952 $ US | #85 |
| 1978 | 306 108 202 $ US | #89 |
| 1977 | 334 857 143 $ US | #84 |
| 1976 | 434 322 034 $ US | #77 |
| 1975 | 544 148 936 $ US | #73 |
| 1974 | 530 434 783 $ US | #71 |
| 1973 | 644 981 958 $ US | #57 |
| 1972 | 437 466 068 $ US | #57 |
| 1971 | 380 936 312 $ US | #58 |
| 1970 | 472 617 875 $ US | #55 |
| 1969 | 387 311 329 $ US | - |
| 1968 | 339 265 114 $ US | - |
| 1967 | 304 363 805 $ US | - |
| 1966 | 310 960 968 $ US | - |
| 1965 | 351 581 995 $ US | - |
| 1964 | 344 578 370 $ US | - |
| 1963 | 326 368 944 $ US | - |
| 1962 | 334 773 294 $ US | - |
| 1961 | 340 376 195 $ US | - |
| 1960 | 343 177 645 $ US | - |
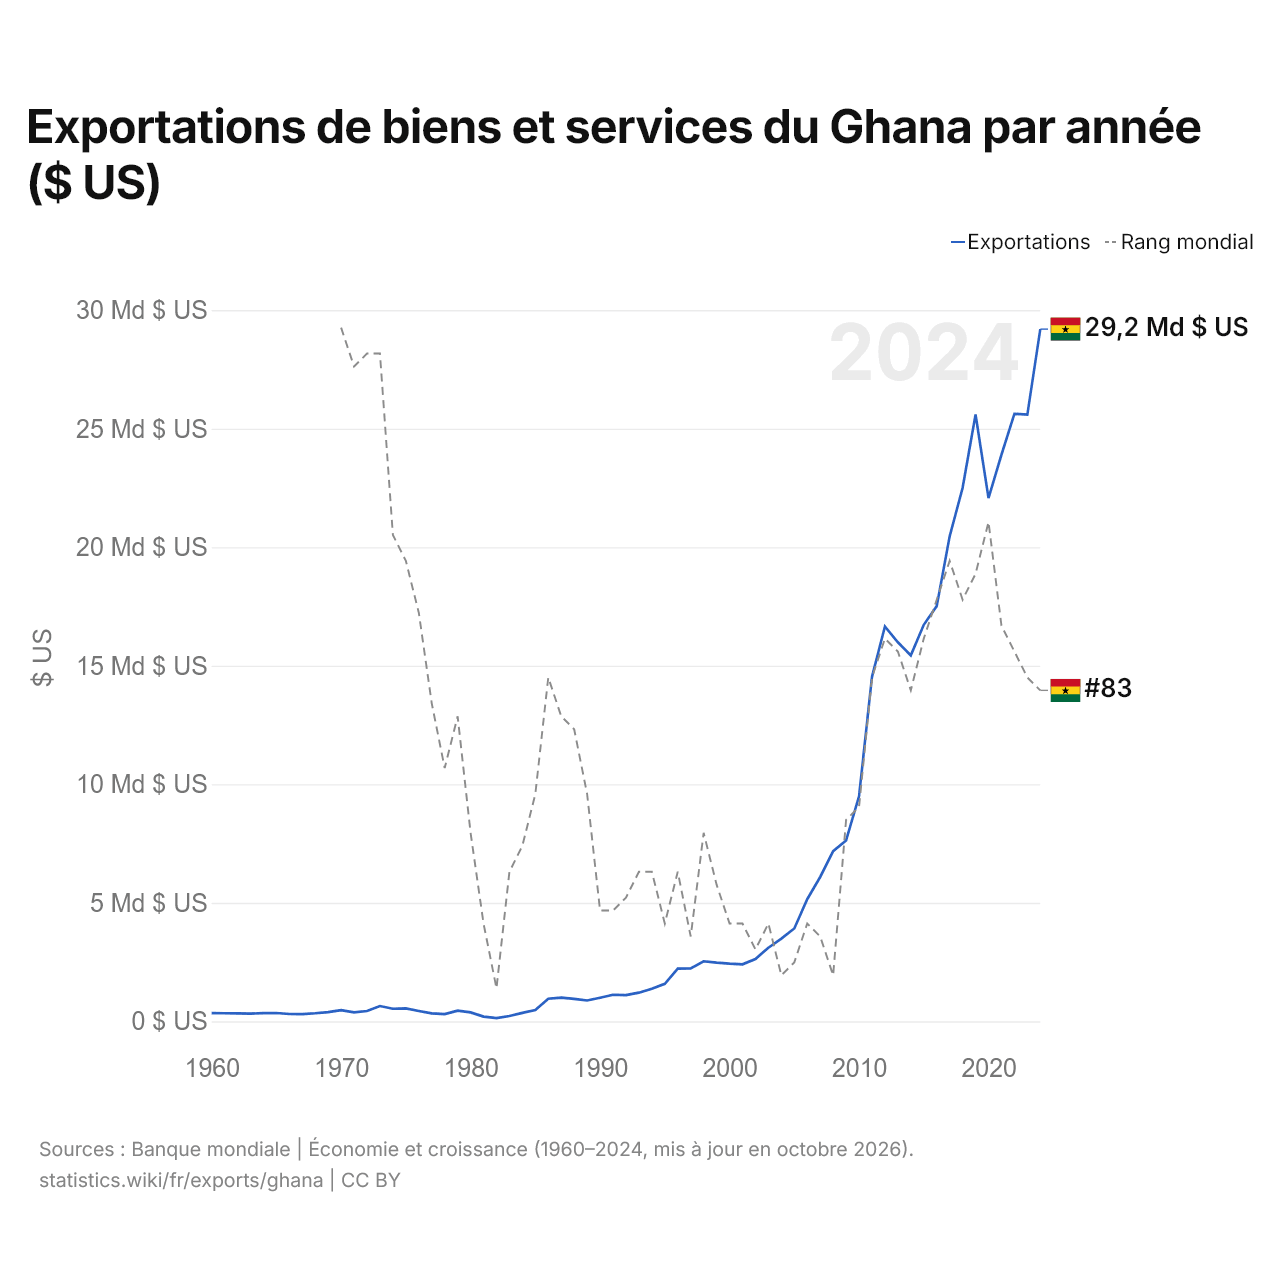
Les exportations de biens et services du Ghana s'élèvent à 29,2 milliards de dollars (2024), contre 343 millions de dollars en 1960. Le minimum a été de 135 millions de dollars, en 1982. Elles se classent au 83e rang mondial, en baisse par rapport au 82e rang l'année précédente. Leur meilleur rang a été le 55e, occupé pour la dernière fois en 1970.
Les exportations de biens et services du Ghana sont les 8es plus élevées de 50 pays situés en Afrique. Les importations de biens et services du Ghana s'élèvent à 28,2 milliards de dollars (2024), au 84e rang mondial. Les exportations du Ghana dépassent ses importations de 953 millions de dollars, soit un excédent commercial (2024).
Exportations de biens du Ghana par catégorie, 2025
Exportations de biens, 2025: 32,0 Md $US
En 2025, la première catégorie des exportations de biens du Ghana était « métaux précieux, pierres précieuses, bijoux, montres, instruments de musique et art », avec 63,1 %, suivie de « aliments transformés, huiles, aliments pour animaux, boissons et tabac », avec 16,4 %.
Destinations des exportations de biens du Ghana : les 10 premières, 2025
| Rang | Pays | Exportations de biens | Part | |
|---|---|---|---|---|
| 1 |
 EAU |
8,28 Md $US | 25,9 % | |
| 2 |
 Inde |
5,12 Md $US | 16 % | |
| 3 |
 Suisse |
4,53 Md $US | 14,2 % | vs Suisse |
| 4 |
 Afrique du Sud |
3,29 Md $US | 10,3 % | vs Afrique du Sud |
| 5 |
 Chine |
1,56 Md $US | 4,88 % | vs Chine |
| 6 |
 Pays-Bas |
1,44 Md $US | 4,51 % | |
| 7 |
 États-Unis |
1,04 Md $US | 3,26 % | |
| 8 |
 Burkina Faso |
941 M $US | 2,94 % | vs Burkina Faso |
| 9 |
 Belgique |
412 M $US | 1,29 % | vs Belgique |
| 10 |
 France |
344 M $US | 1,08 % | vs France |
| Autres partenaires et non précisés | 5,02 Md $US | 15,7 % |
Exportations de biens du Ghana vers ses 5 principales destinations ($ US), 2001–2025
| Année | $ US | ||||
|---|---|---|---|---|---|
| Émirats arabes unis | Inde | Suisse | Afrique du Sud | Chine | |
| 2025 | 8 283 613 000 $ US | 5 121 240 000 $ US | 4 526 685 000 $ US | 3 286 002 000 $ US | 1 560 481 000 $ US |
| 2024 | 4 189 167 000 $ US | 1 377 164 000 $ US | 4 150 685 000 $ US | 2 510 322 000 $ US | 1 502 647 000 $ US |
| 2023 | 1 617 405 000 $ US | 1 133 322 000 $ US | 2 906 621 000 $ US | 1 866 676 000 $ US | 1 309 692 000 $ US |
| 2022 | 358 454 000 $ US | 1 649 901 000 $ US | 3 081 823 000 $ US | 1 762 138 000 $ US | 2 152 279 000 $ US |
| 2021 | 117 989 000 $ US | 1 336 519 000 $ US | 2 411 586 000 $ US | 1 969 724 000 $ US | 1 386 529 000 $ US |
| 2020 | 899 160 000 $ US | 2 380 131 000 $ US | 2 465 917 000 $ US | 1 971 004 000 $ US | 2 808 597 000 $ US |
| 2019 | 899 160 000 $ US | 2 380 131 000 $ US | 2 465 917 000 $ US | 1 971 004 000 $ US | 2 808 597 000 $ US |
| 2018 | 587 809 000 $ US | 3 652 238 000 $ US | 1 623 657 000 $ US | 1 733 864 000 $ US | 2 022 226 000 $ US |
| 2017 | 800 817 000 $ US | 2 689 586 000 $ US | 1 660 198 000 $ US | 910 321 000 $ US | 2 381 504 000 $ US |
| 2016 | 1 447 900 000 $ US | 1 598 600 000 $ US | 1 933 777 000 $ US | 401 073 000 $ US | 959 751 000 $ US |
| 2015 | 351 887 000 $ US | 2 351 606 000 $ US | 1 356 234 000 $ US | 594 009 000 $ US | 1 112 868 000 $ US |
| 2014 | 1 129 391 000 $ US | 812 293 000 $ US | 1 154 061 000 $ US | 2 490 182 000 $ US | 830 204 000 $ US |
| 2013 | 1 659 719 000 $ US | 465 811 000 $ US | 1 172 029 000 $ US | 2 833 217 000 $ US | 457 594 000 $ US |
| 2012 | 1 634 295 000 $ US | 237 314 000 $ US | 1 212 356 000 $ US | 4 535 195 000 $ US | 626 810 000 $ US |
| 2011 | 993 892 000 $ US | 722 194 000 $ US | 865 865 000 $ US | 3 146 838 000 $ US | 257 853 000 $ US |
| 2010 | 353 374 000 $ US | 48 548 000 $ US | 215 488 000 $ US | 2 798 531 000 $ US | 51 251 000 $ US |
| 2009 | 57 225 000 $ US | 59 230 000 $ US | 515 493 000 $ US | 2 363 725 000 $ US | 46 019 000 $ US |
| 2008 | 16 187 000 $ US | 202 959 000 $ US | 100 684 000 $ US | 1 676 179 000 $ US | 71 599 000 $ US |
| 2007 | 11 473 000 $ US | 78 364 000 $ US | 210 165 000 $ US | 1 312 035 000 $ US | 32 695 000 $ US |
| 2006 | 12 336 000 $ US | 58 850 000 $ US | 245 402 000 $ US | 932 813 000 $ US | 38 805 000 $ US |
| 2005 | 8 023 000 $ US | 41 549 000 $ US | 138 974 000 $ US | 768 967 000 $ US | 41 720 000 $ US |
| 2004 | 9 032 000 $ US | 16 680 000 $ US | 113 779 000 $ US | 504 783 000 $ US | 15 822 000 $ US |
| 2003 | 1 811 000 $ US | 12 277 000 $ US | 587 889 000 $ US | 87 793 000 $ US | 32 281 000 $ US |
| 2002 | 2 142 000 $ US | 8 716 000 $ US | 426 479 000 $ US | 59 572 000 $ US | 24 691 000 $ US |
| 2001 | 2 142 000 $ US | 8 716 000 $ US | 426 479 000 $ US | 59 572 000 $ US | 24 691 000 $ US |
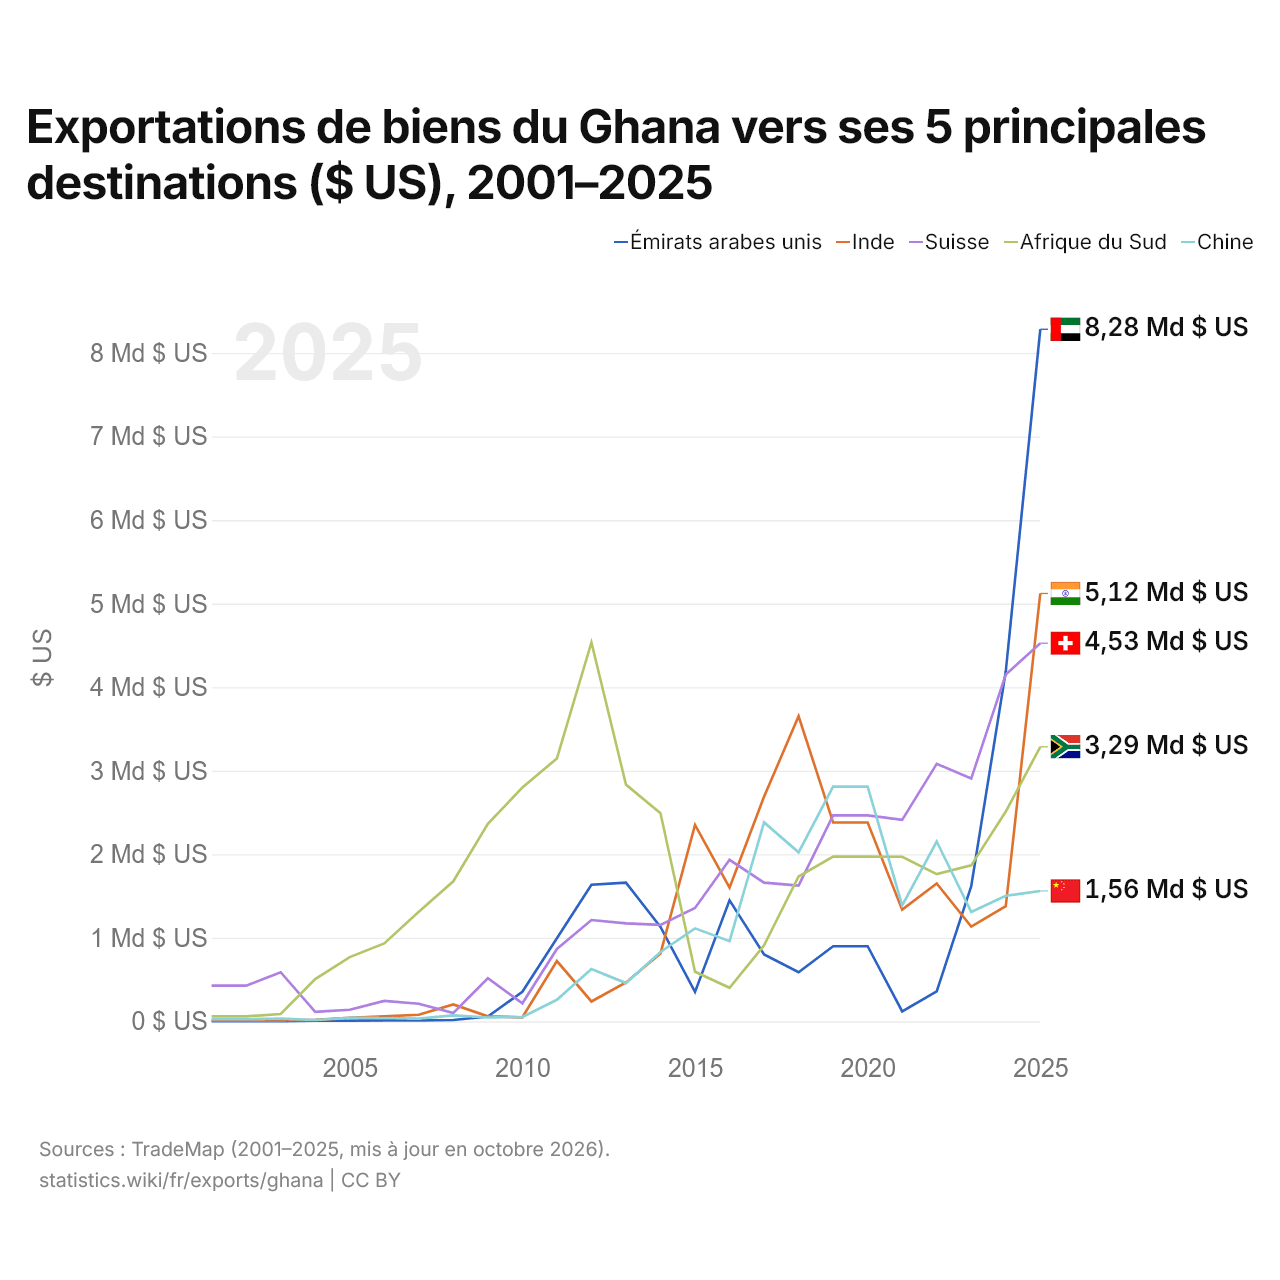
En 2025, les exportations de biens s'élevaient à 8,28 milliards de dollars vers les Émirats arabes unis, 5,12 milliards de dollars vers l'Inde, 4,53 milliards de dollars vers la Suisse, 3,29 milliards de dollars vers l'Afrique du Sud et 1,56 milliard de dollars vers la Chine. Le premier rang des cinq destinations du Ghana est occupé par les Émirats arabes unis depuis 2024. Le changement le plus récent dans leur ordre remonte à 2025, quand les exportations du Ghana vers l'Inde ont dépassé celles vers la Suisse.
Exportations de biens et de services du Ghana ($ US), 1975–2025
| Année | $ US | |
|---|---|---|
| Biens | Services | |
| 2025 | 31 248 007 649 $ US | 10 059 900 446 $ US |
| 2024 | 19 164 781 853 $ US | 9 270 170 149 $ US |
| 2023 | 15 715 819 894 $ US | 8 745 364 927 $ US |
| 2022 | 17 095 695 298 $ US | 8 297 183 733 $ US |
| 2021 | 14 727 459 381 $ US | 9 141 816 836 $ US |
| 2020 | 14 471 527 063 $ US | 7 605 546 294 $ US |
| 2019 | 15 667 527 637 $ US | 9 924 810 905 $ US |
| 2018 | 14 942 720 191 $ US | 7 572 036 284 $ US |
| 2017 | 13 834 850 000 $ US | 6 601 990 000 $ US |
| 2016 | 11 136 878 170 $ US | 6 332 982 157 $ US |
| 2015 | 10 321 186 611 $ US | 6 142 193 023 $ US |
| 2014 | 13 216 778 567 $ US | 2 044 681 622 $ US |
| 2013 | 13 751 918 378 $ US | 2 454 044 041 $ US |
| 2012 | 13 552 347 535 $ US | 3 259 675 541 $ US |
| 2011 | 12 785 406 533 $ US | 1 810 112 513 $ US |
| 2010 | 7 960 080 000 $ US | 1 477 300 000 $ US |
| 2009 | 5 839 700 000 $ US | 1 769 710 000 $ US |
| 2008 | 5 269 730 513 $ US | 1 800 898 739 $ US |
| 2007 | 4 172 139 004 $ US | 1 831 864 827 $ US |
| 2006 | 3 726 674 820 $ US | 1 382 846 296 $ US |
| 2005 | 2 802 195 812 $ US | 1 106 489 310 $ US |
| 2004 | 2 704 467 546 $ US | 702 310 000 $ US |
| 2003 | 2 562 560 897 $ US | 630 005 000 $ US |
| 2002 | 2 015 190 116 $ US | 554 900 000 $ US |
| 2001 | 1 867 114 038 $ US | 531 658 600 $ US |
| 2000 | 1 936 321 433 $ US | 504 272 625 $ US |
| 1999 | 2 005 500 000 $ US | 467 800 000 $ US |
| 1998 | 2 090 800 000 $ US | 440 900 000 $ US |
| 1997 | 1 489 860 000 $ US | 164 900 000 $ US |
| 1996 | 1 570 000 000 $ US | 156 800 000 $ US |
| 1995 | 1 431 200 000 $ US | 150 600 000 $ US |
| 1994 | 1 237 700 000 $ US | 147 500 000 $ US |
| 1993 | 1 063 600 000 $ US | 144 700 000 $ US |
| 1992 | 986 300 000 $ US | 154 400 000 $ US |
| 1991 | 997 700 000 $ US | 102 800 000 $ US |
| 1990 | 896 800 000 $ US | 86 400 000 $ US |
| 1989 | 808 200 000 $ US | 80 900 000 $ US |
| 1988 | 881 000 000 $ US | 76 700 000 $ US |
| 1987 | 826 800 000 $ US | 78 700 000 $ US |
| 1986 | 749 300 000 $ US | 54 830 000 $ US |
| 1985 | 632 400 000 $ US | 38 000 000 $ US |
| 1984 | 565 900 000 $ US | 43 800 000 $ US |
| 1983 | 439 100 000 $ US | 38 200 000 $ US |
| 1982 | 607 000 000 $ US | 103 891 088 $ US |
| 1981 | 710 700 000 $ US | 119 100 000 $ US |
| 1980 | 1 103 600 000 $ US | 106 700 000 $ US |
| 1979 | 1 065 700 000 $ US | 97 000 068 $ US |
| 1978 | 892 790 905 $ US | 103 256 414 $ US |
| 1977 | 889 569 295 $ US | 128 261 457 $ US |
| 1976 | 779 047 763 $ US | 112 435 401 $ US |
| 1975 | 800 960 927 $ US | 90 000 495 $ US |
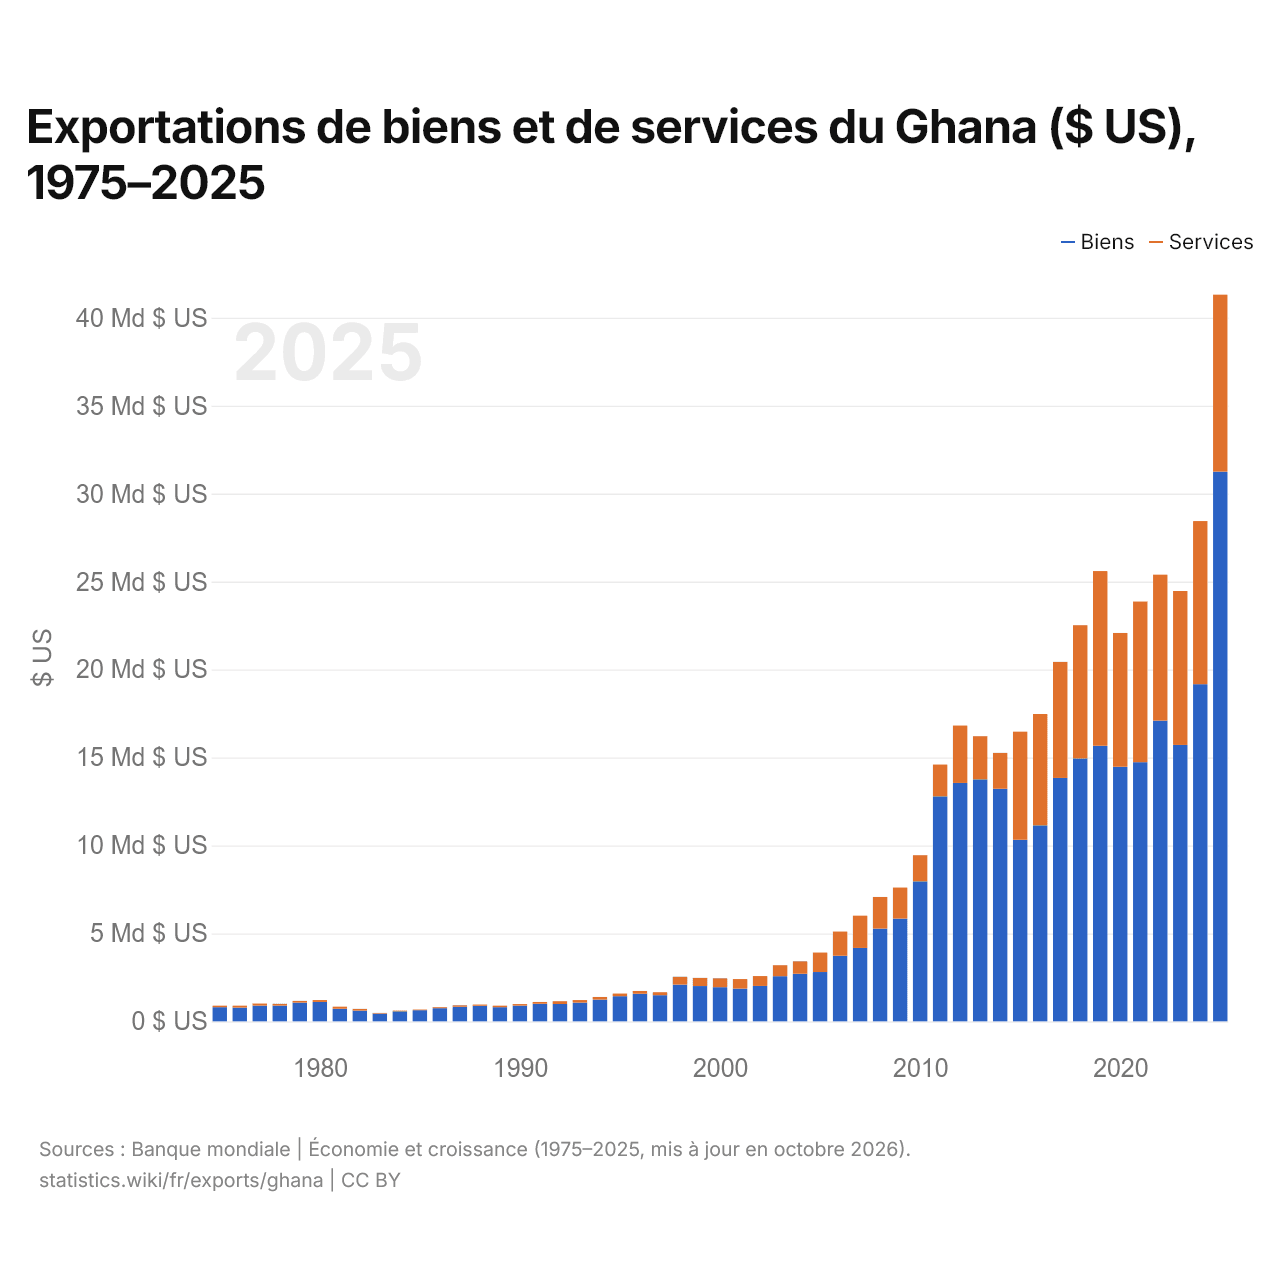
En 2025, les exportations de biens du Ghana s'élevaient à 31,2 milliards de dollars et celles de services à 10,1 milliards de dollars ; les services représentaient 24,4 % du total, contre 10,1 % en 1975.
Le Ghana dans le classement mondial des exportations
| Rang | Pays | Exportations | Part mondiale | |
|---|---|---|---|---|
| 80 |
 Lettonie |
30,4 Md $US (2025) | 0,09 % | |
| 81 |
 Rép. dominicaine |
30,1 Md $US (2025) | 0,09 % | |
| 82 |
 Côte d’Ivoire |
29,7 Md $US (2025) | 0,09 % | vs Côte d’Ivoire |
| 83 |
 Ghana |
29,2 Md $US | 0,09 % | |
| 84 |
 Angola |
28,1 Md $US (2025) | 0,08 % | |
| 85 |
 Tunisie |
26,8 Md $US (2025) | 0,08 % | |
| 86 |
 Jordanie |
25,0 Md $US | 0,08 % |
Exportations de biens et services du Ghana, % du PIB
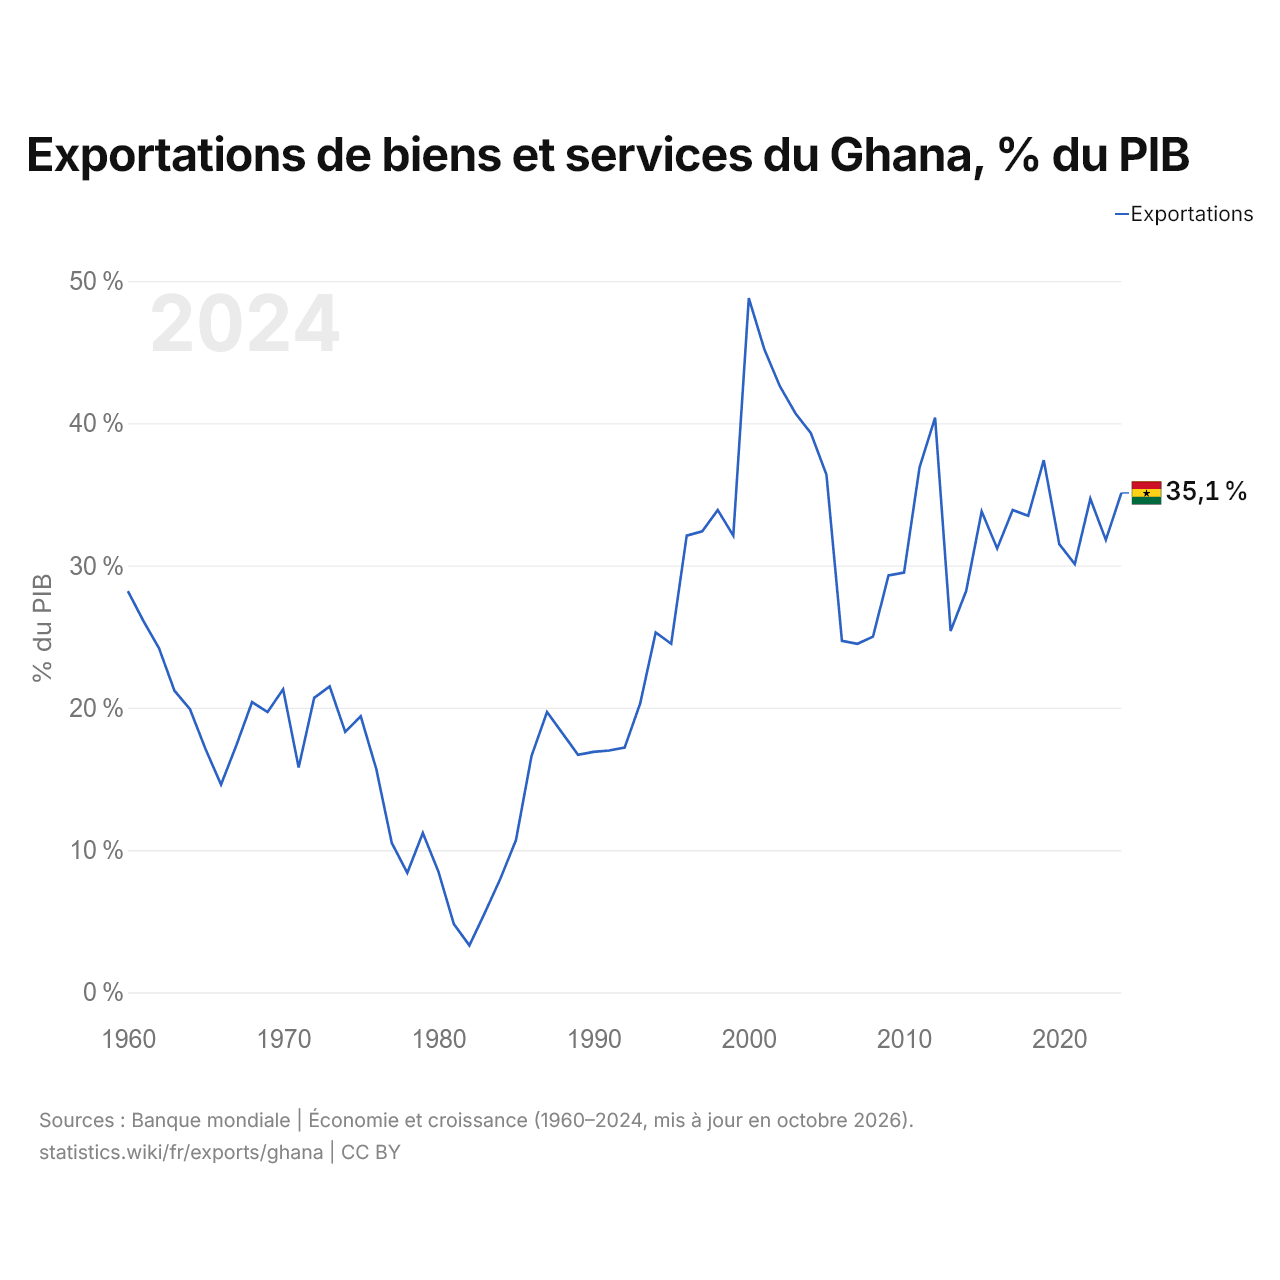
Les exportations de biens et services du Ghana équivalent à 35,1 % de son PIB (2024), contre 28,2 % en 1960. La part la plus élevée a été de 48,8 %, en 2000.
Comparer les exportations du Ghana avec celles d'autres pays
Sources :
- Banque mondiale | Économie et croissance (1960–2025, mis à jour en octobre 2026)
- TradeMap (2001–2025, mis à jour en octobre 2026)
Creative Commons Attribution (CC BY) : vous pouvez copier, partager, adapter et réutiliser ce contenu, y compris à des fins commerciales, à condition de citer statistics.wiki et d’indiquer les modifications apportées. Les sources citées ci-dessus peuvent avoir leurs propres conditions de licence.