
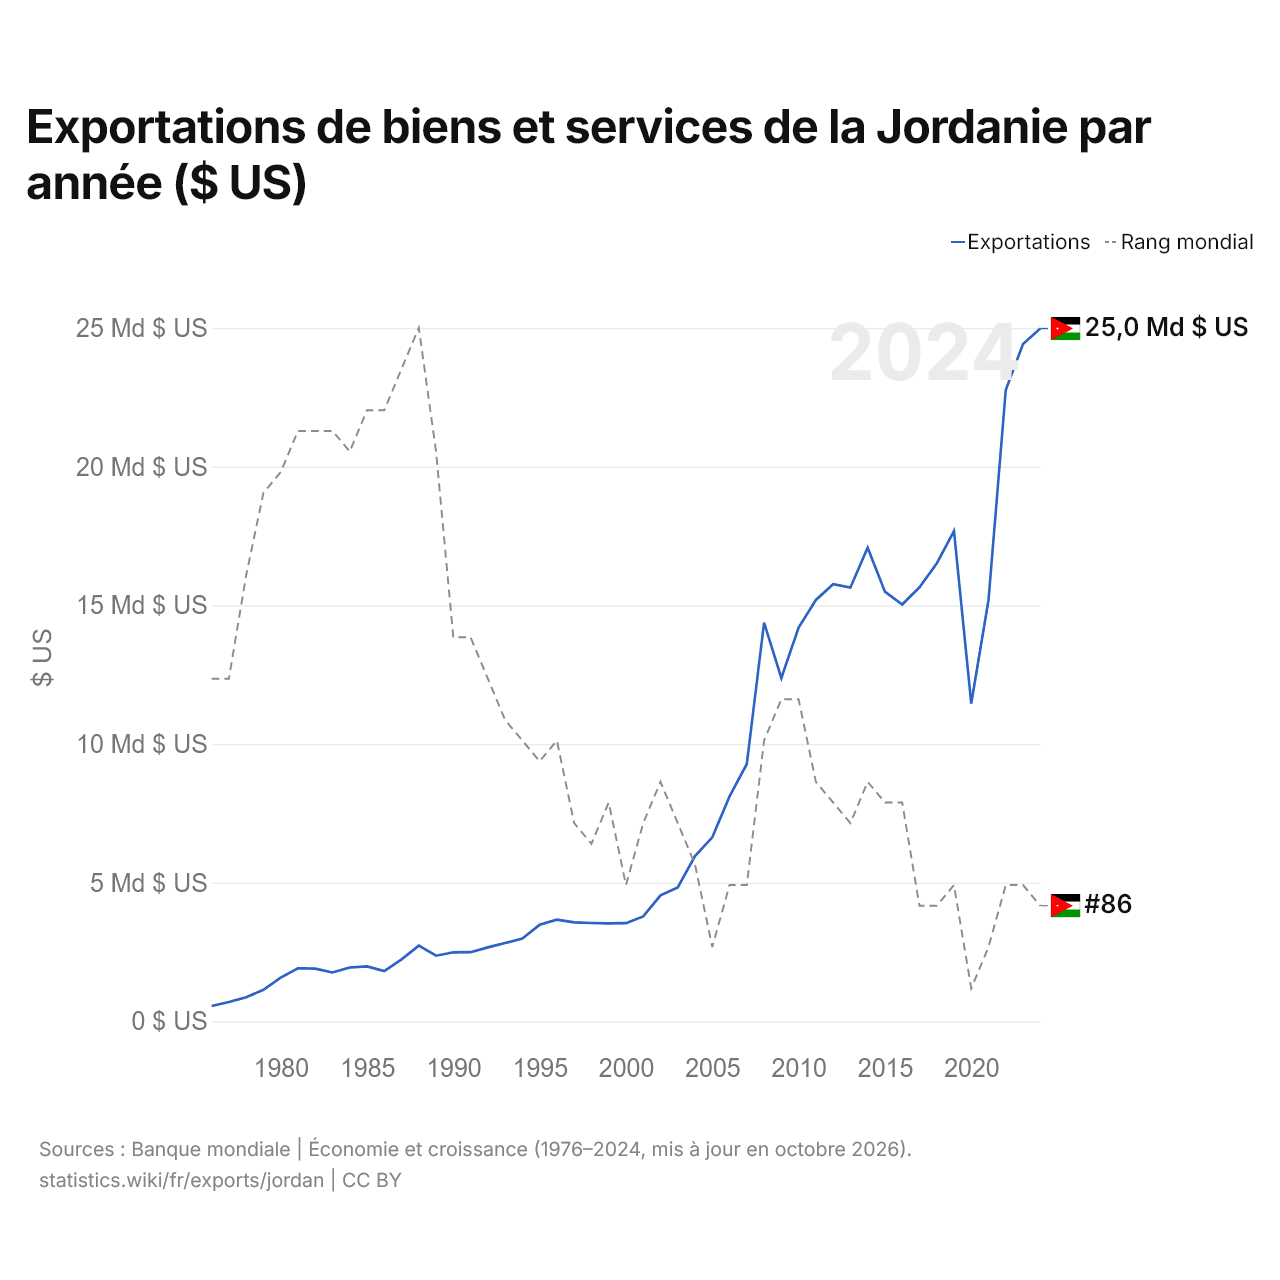
Exportations de biens et services de la Jordanie par année ($ US)
| Année | $ US | Rang mondial |
|---|---|---|
| Exportations | Rang mondial | |
| 2024 | 24 978 496 636 $ US | #86 |
| 2023 | 24 423 185 916 $ US | #85 |
| 2022 | 22 764 746 582 $ US | #85 |
| 2021 | 15 189 797 101 $ US | #88 |
| 2020 | 11 455 665 446 $ US | #90 |
| 2019 | 17 673 414 514 $ US | #85 |
| 2018 | 16 507 256 537 $ US | #86 |
| 2017 | 15 649 848 031 $ US | #86 |
| 2016 | 15 026 750 914 $ US | #81 |
| 2015 | 15 492 666 646 $ US | #81 |
| 2014 | 17 079 021 029 $ US | #80 |
| 2013 | 15 640 033 827 $ US | #82 |
| 2012 | 15 763 073 043 $ US | #81 |
| 2011 | 15 194 244 256 $ US | #80 |
| 2010 | 14 194 440 554 $ US | #76 |
| 2009 | 12 378 849 705 $ US | #76 |
| 2008 | 14 377 860 853 $ US | #78 |
| 2007 | 9 279 830 748 $ US | #85 |
| 2006 | 8 111 847 673 $ US | #85 |
| 2005 | 6 634 978 843 $ US | #88 |
| 2004 | 5 955 712 271 $ US | #84 |
| 2003 | 4 829 901 269 $ US | #82 |
| 2002 | 4 544 146 685 $ US | #80 |
| 2001 | 3 781 896 040 $ US | #82 |
| 2000 | 3 538 928 068 $ US | #85 |
| 1999 | 3 529 798 449 $ US | #81 |
| 1998 | 3 544 310 014 $ US | #83 |
| 1997 | 3 568 401 834 $ US | #82 |
| 1996 | 3 663 187 588 $ US | #78 |
| 1995 | 3 479 594 749 $ US | #79 |
| 1994 | 2 984 831 258 $ US | #78 |
| 1993 | 2 821 988 710 $ US | #77 |
| 1992 | 2 667 772 992 $ US | #75 |
| 1991 | 2 493 295 303 $ US | #73 |
| 1990 | 2 489 182 055 $ US | #73 |
| 1989 | 2 366 092 562 $ US | #64 |
| 1988 | 2 727 282 443 $ US | #58 |
| 1987 | 2 234 244 030 $ US | #60 |
| 1986 | 1 811 890 298 $ US | #62 |
| 1985 | 1 980 361 102 $ US | #62 |
| 1984 | 1 941 138 985 $ US | #64 |
| 1983 | 1 761 600 093 $ US | #63 |
| 1982 | 1 901 319 746 $ US | #63 |
| 1981 | 1 913 247 164 $ US | #63 |
| 1980 | 1 579 256 524 $ US | #65 |
| 1979 | 1 136 072 293 $ US | #66 |
| 1978 | 870 674 847 $ US | #70 |
| 1977 | 694 573 097 $ US | #75 |
| 1976 | 553 341 587 $ US | #75 |
Les exportations de biens et services de la Jordanie s'élèvent à 25 milliards de dollars (2024), contre 553 millions de dollars en 1976. Elles se classent au 86e rang mondial, en baisse par rapport au 85e rang l'année précédente. Leur meilleur rang a été le 58e, occupé pour la dernière fois en 1988.
Les exportations de biens et services de la Jordanie sont les 28es plus élevées de 44 pays situés en Asie. Les importations de biens et services de la Jordanie s'élèvent à 33,5 milliards de dollars (2024), au 79e rang mondial. Les importations de la Jordanie dépassent ses exportations de 8,47 milliards de dollars, soit un déficit commercial (2024).
Exportations de biens de la Jordanie par catégorie, 2025
Exportations de biens, 2025: 17,2 Md $US
En 2025, la première catégorie des exportations de biens de la Jordanie était « pétrole, gaz, minerais et autres matières premières », avec 23,4 %, suivie de « textiles, vêtements, chaussures, meubles et jouets », avec 16,7 %.
Destinations des exportations de biens de la Jordanie : les 10 premières, 2025
| Rang | Pays | Exportations de biens | Part | |
|---|---|---|---|---|
| 1 |
 États-Unis |
3,17 Md $US | 18,5 % | |
| 2 |
 Irak |
2,64 Md $US | 15,4 % | vs Irak |
| 3 |
 Arabie saoudite |
2,03 Md $US | 11,8 % | |
| 4 |
 Inde |
1,65 Md $US | 9,6 % | |
| 5 |
 Syrie |
878 M $US | 5,11 % | vs Syrie |
| 6 |
 EAU |
872 M $US | 5,07 % | |
| 7 |
 Égypte |
762 M $US | 4,43 % | vs Égypte |
| 8 |
 Chine |
391 M $US | 2,28 % | |
| 9 |
 Palestine |
319 M $US | 1,86 % | |
| 10 |
 Israël |
289 M $US | 1,68 % | vs Israël |
| Autres partenaires et non précisés | 4,17 Md $US | 24,3 % |
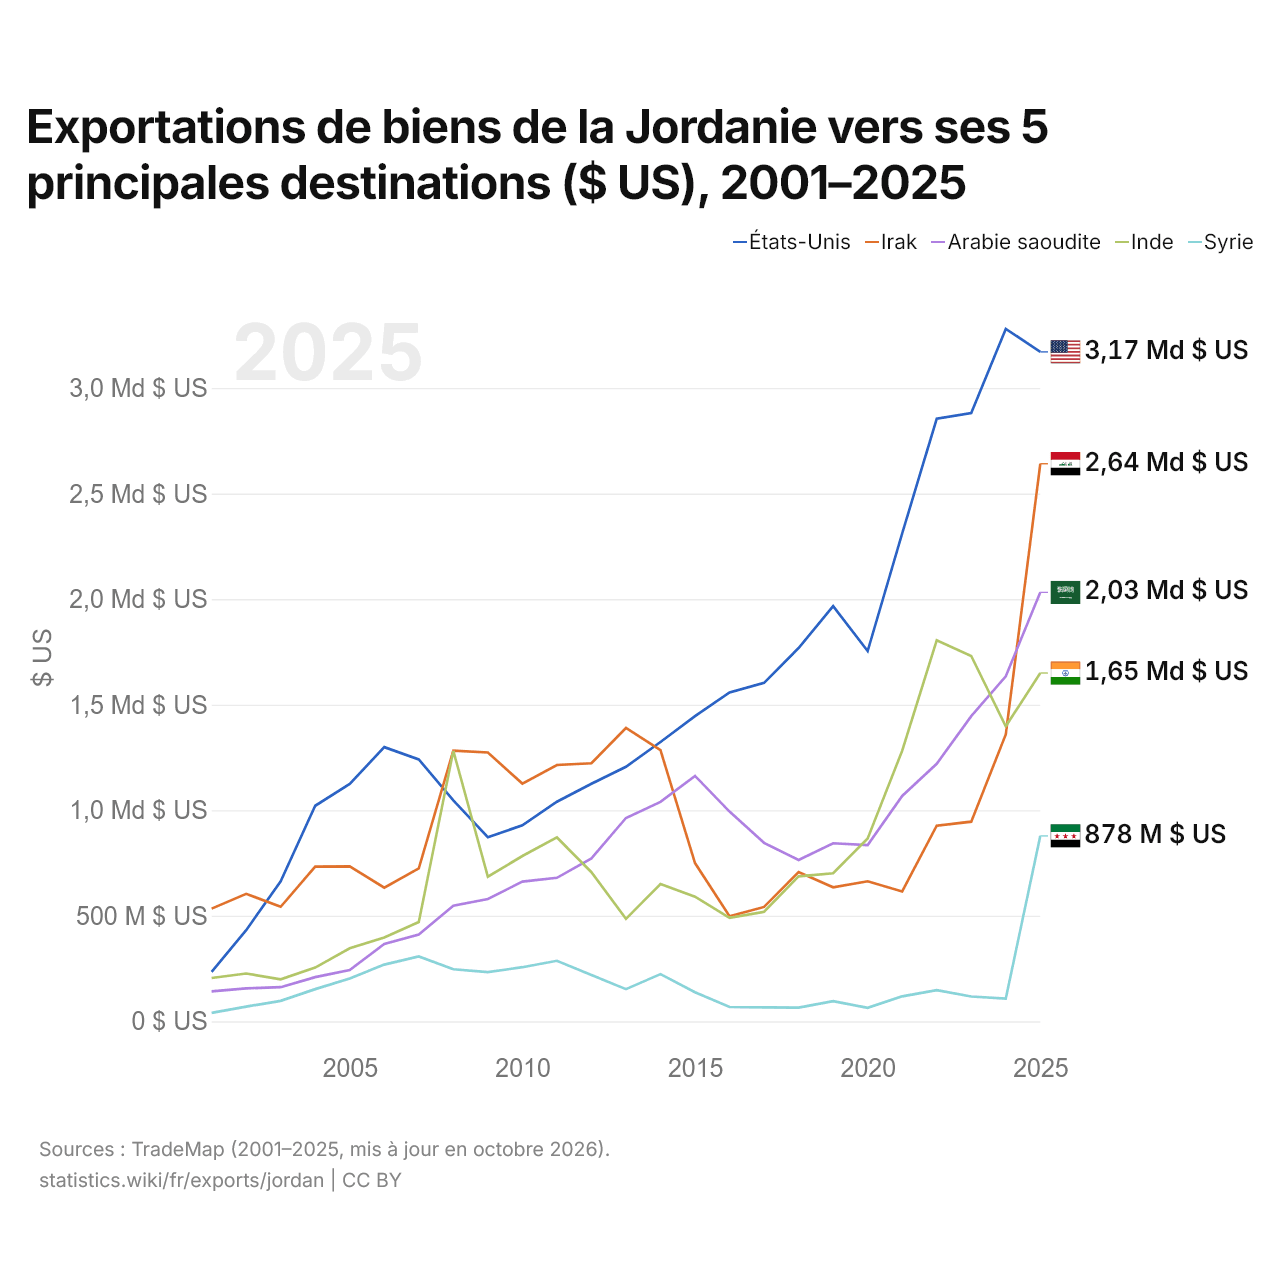
Exportations de biens de la Jordanie vers ses 5 principales destinations ($ US), 2001–2025
| Année | $ US | ||||
|---|---|---|---|---|---|
| États-Unis | Irak | Arabie saoudite | Inde | Syrie | |
| 2025 | 3 171 136 000 $ US | 2 641 283 000 $ US | 2 032 133 000 $ US | 1 649 869 000 $ US | 878 401 000 $ US |
| 2024 | 3 280 167 000 $ US | 1 358 765 000 $ US | 1 634 513 000 $ US | 1 397 280 000 $ US | 107 592 000 $ US |
| 2023 | 2 881 097 000 $ US | 945 668 000 $ US | 1 445 741 000 $ US | 1 730 648 000 $ US | 117 647 000 $ US |
| 2022 | 2 854 204 000 $ US | 926 736 000 $ US | 1 219 955 000 $ US | 1 804 567 000 $ US | 147 369 000 $ US |
| 2021 | 2 311 749 000 $ US | 615 171 000 $ US | 1 067 571 000 $ US | 1 281 818 000 $ US | 118 323 000 $ US |
| 2020 | 1 754 035 000 $ US | 663 507 000 $ US | 834 785 000 $ US | 866 447 000 $ US | 63 853 000 $ US |
| 2019 | 1 967 154 000 $ US | 634 694 000 $ US | 843 374 000 $ US | 701 672 000 $ US | 95 315 000 $ US |
| 2018 | 1 768 378 000 $ US | 707 475 000 $ US | 764 670 000 $ US | 686 684 000 $ US | 65 159 000 $ US |
| 2017 | 1 603 242 000 $ US | 541 981 000 $ US | 845 545 000 $ US | 519 010 000 $ US | 65 791 000 $ US |
| 2016 | 1 558 302 000 $ US | 497 560 000 $ US | 993 368 000 $ US | 489 874 000 $ US | 67 759 000 $ US |
| 2015 | 1 445 605 000 $ US | 749 534 000 $ US | 1 162 551 000 $ US | 590 543 000 $ US | 137 719 000 $ US |
| 2014 | 1 323 267 000 $ US | 1 284 319 000 $ US | 1 039 254 000 $ US | 650 845 000 $ US | 223 679 000 $ US |
| 2013 | 1 205 678 000 $ US | 1 389 561 000 $ US | 963 295 000 $ US | 485 385 000 $ US | 152 394 000 $ US |
| 2012 | 1 125 340 000 $ US | 1 222 697 000 $ US | 771 608 000 $ US | 706 258 000 $ US | 219 777 000 $ US |
| 2011 | 1 040 465 000 $ US | 1 214 260 000 $ US | 679 789 000 $ US | 871 201 000 $ US | 286 800 000 $ US |
| 2010 | 928 400 000 $ US | 1 126 243 000 $ US | 661 698 000 $ US | 782 972 000 $ US | 256 483 000 $ US |
| 2009 | 872 286 000 $ US | 1 273 361 000 $ US | 579 514 000 $ US | 685 076 000 $ US | 232 888 000 $ US |
| 2008 | 1 046 918 000 $ US | 1 282 648 000 $ US | 547 274 000 $ US | 1 281 584 000 $ US | 246 831 000 $ US |
| 2007 | 1 240 769 000 $ US | 724 567 000 $ US | 411 129 000 $ US | 470 630 000 $ US | 307 573 000 $ US |
| 2006 | 1 298 877 000 $ US | 633 368 000 $ US | 366 958 000 $ US | 396 680 000 $ US | 268 813 000 $ US |
| 2005 | 1 124 455 000 $ US | 734 036 000 $ US | 243 360 000 $ US | 346 336 000 $ US | 202 543 000 $ US |
| 2004 | 1 021 196 000 $ US | 732 775 000 $ US | 209 268 000 $ US | 254 524 000 $ US | 152 526 000 $ US |
| 2003 | 662 955 000 $ US | 542 517 000 $ US | 161 717 000 $ US | 199 004 000 $ US | 97 102 000 $ US |
| 2002 | 431 724 000 $ US | 603 970 000 $ US | 156 484 000 $ US | 226 391 000 $ US | 69 746 000 $ US |
| 2001 | 234 771 000 $ US | 533 834 000 $ US | 142 119 000 $ US | 205 210 000 $ US | 39 858 000 $ US |
En 2025, les exportations de biens s'élevaient à 3,17 milliards de dollars vers les États-Unis, 2,64 milliards de dollars vers l'Irak, 2,03 milliards de dollars vers l'Arabie saoudite, 1,65 milliard de dollars vers l'Inde et 878 millions de dollars vers la Syrie. Le premier rang des cinq destinations de la Jordanie est occupé par les États-Unis depuis 2014. Le changement le plus récent dans leur ordre remonte à 2025, quand les exportations de la Jordanie vers l'Irak ont dépassé celles vers l'Arabie saoudite.
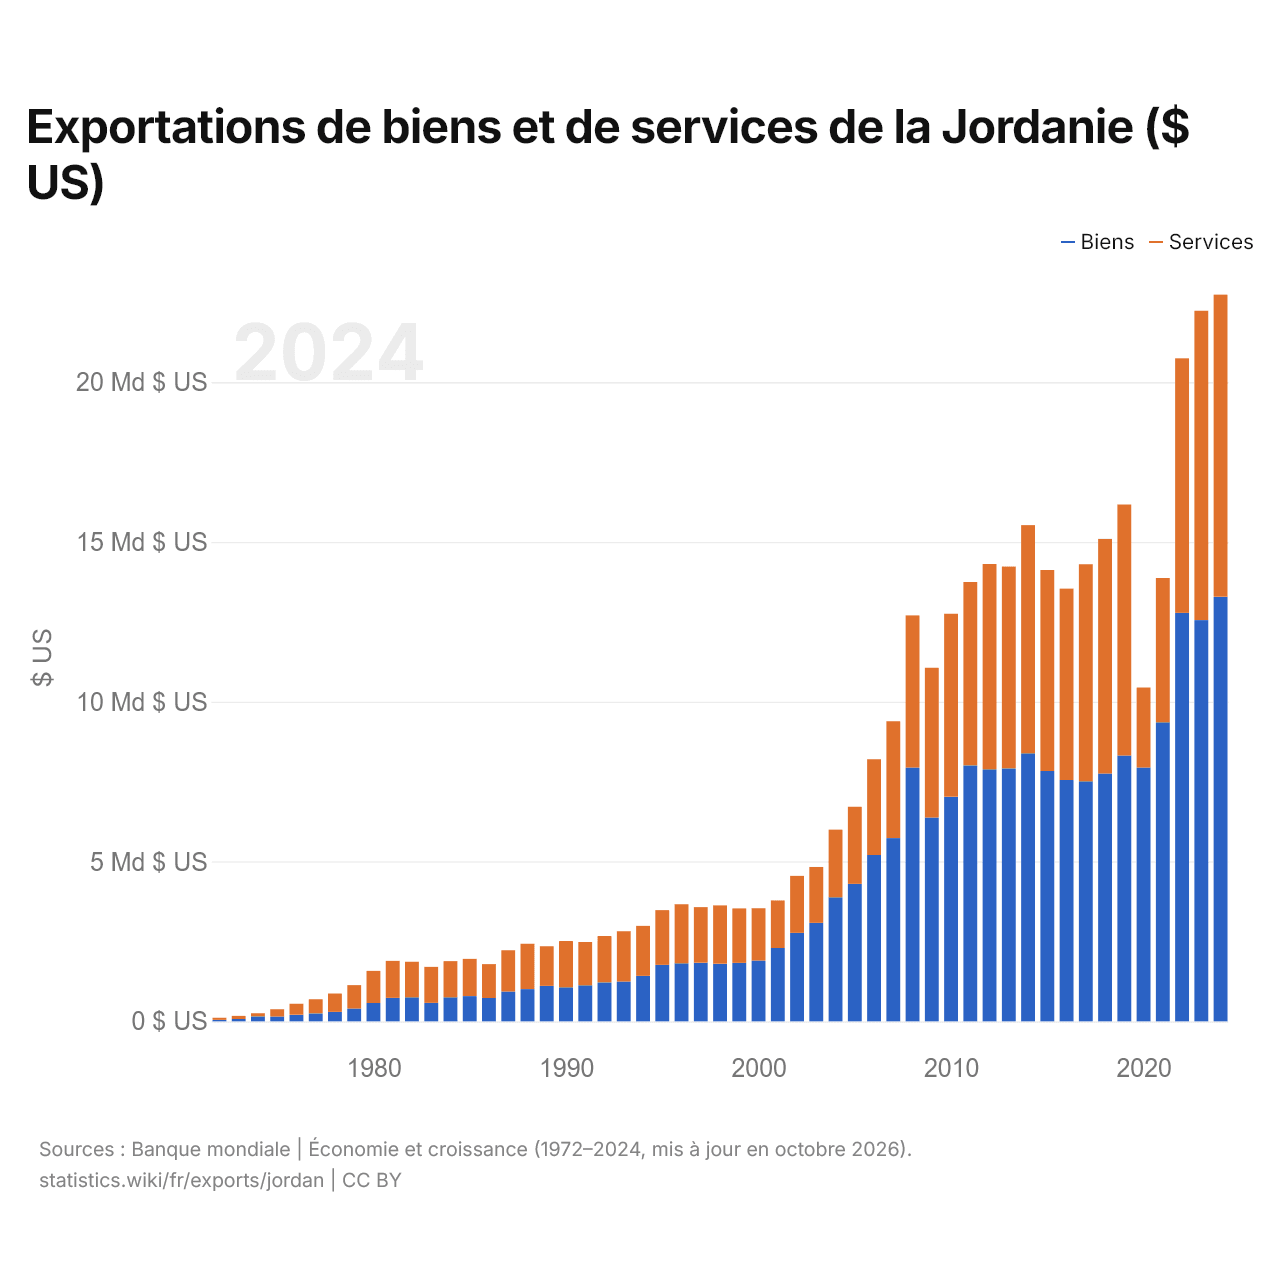
Exportations de biens et de services de la Jordanie ($ US)
| Année | $ US | |
|---|---|---|
| Biens | Services | |
| 2024 | 13 285 774 648 $ US | 9 448 732 394 $ US |
| 2023 | 12 551 830 986 $ US | 9 680 281 690 $ US |
| 2022 | 12 780 000 000 $ US | 7 963 380 282 $ US |
| 2021 | 9 357 464 789 $ US | 4 512 112 676 $ US |
| 2020 | 7 943 239 437 $ US | 2 501 126 761 $ US |
| 2019 | 8 317 323 944 $ US | 7 852 816 901 $ US |
| 2018 | 7 750 281 690 $ US | 7 342 394 366 $ US |
| 2017 | 7 511 408 451 $ US | 6 788 732 394 $ US |
| 2016 | 7 548 732 394 $ US | 5 989 295 775 $ US |
| 2015 | 7 832 957 746 $ US | 6 287 605 634 $ US |
| 2014 | 8 385 352 113 $ US | 7 139 577 465 $ US |
| 2013 | 7 912 535 211 $ US | 6 315 211 268 $ US |
| 2012 | 7 886 619 718 $ US | 6 420 704 225 $ US |
| 2011 | 8 006 338 028 $ US | 5 737 464 789 $ US |
| 2010 | 7 028 309 859 $ US | 5 723 521 127 $ US |
| 2009 | 6 375 070 423 $ US | 4 686 056 338 $ US |
| 2008 | 7 937 108 747 $ US | 4 761 891 693 $ US |
| 2007 | 5 731 454 731 $ US | 3 656 136 542 $ US |
| 2006 | 5 204 372 355 $ US | 2 996 897 038 $ US |
| 2005 | 4 301 410 437 $ US | 2 412 411 848 $ US |
| 2004 | 3 882 933 709 $ US | 2 115 655 853 $ US |
| 2003 | 3 081 664 316 $ US | 1 748 236 953 $ US |
| 2002 | 2 769 958 231 $ US | 1 782 228 838 $ US |
| 2001 | 2 294 419 190 $ US | 1 487 479 928 $ US |
| 2000 | 1 899 294 781 $ US | 1 639 633 286 $ US |
| 1999 | 1 831 875 882 $ US | 1 701 692 525 $ US |
| 1998 | 1 802 397 743 $ US | 1 825 105 783 $ US |
| 1997 | 1 835 543 018 $ US | 1 736 812 412 $ US |
| 1996 | 1 816 925 247 $ US | 1 846 262 341 $ US |
| 1995 | 1 769 589 378 $ US | 1 709 171 523 $ US |
| 1994 | 1 424 454 581 $ US | 1 561 981 099 $ US |
| 1993 | 1 246 308 319 $ US | 1 573 661 808 $ US |
| 1992 | 1 218 924 508 $ US | 1 449 230 808 $ US |
| 1991 | 1 129 469 207 $ US | 1 351 233 876 $ US |
| 1990 | 1 063 813 537 $ US | 1 447 172 278 $ US |
| 1989 | 1 109 430 328 $ US | 1 239 248 393 $ US |
| 1988 | 1 007 437 471 $ US | 1 420 634 453 $ US |
| 1987 | 933 109 191 $ US | 1 291 671 046 $ US |
| 1986 | 731 989 985 $ US | 1 058 831 756 $ US |
| 1985 | 788 861 137 $ US | 1 167 107 917 $ US |
| 1984 | 751 909 661 $ US | 1 130 978 577 $ US |
| 1983 | 579 969 445 $ US | 1 124 530 459 $ US |
| 1982 | 751 557 486 $ US | 1 112 061 730 $ US |
| 1981 | 733 222 439 $ US | 1 160 018 018 $ US |
| 1980 | 575 198 032 $ US | 1 002 892 500 $ US |
| 1979 | 402 216 771 $ US | 731 342 765 $ US |
| 1978 | 297 406 076 $ US | 572 393 805 $ US |
| 1977 | 248 885 811 $ US | 442 535 297 $ US |
| 1976 | 206 938 100 $ US | 344 294 393 $ US |
| 1975 | 152 912 053 $ US | 226 397 395 $ US |
| 1974 | 154 303 899 $ US | 98 108 717 $ US |
| 1973 | 73 652 300 $ US | 96 174 077 $ US |
| 1972 | 47 599 947 $ US | 64 959 928 $ US |
Les exportations de biens de la Jordanie s'élèvent à 13,3 milliards de dollars (2024) et celles de services à 9,45 milliards de dollars ; les services représentent 41,6 % du total, contre 57,7 % en 1972.
La Jordanie dans le classement mondial des exportations







Exportations de biens et services de la Jordanie, % du PIB
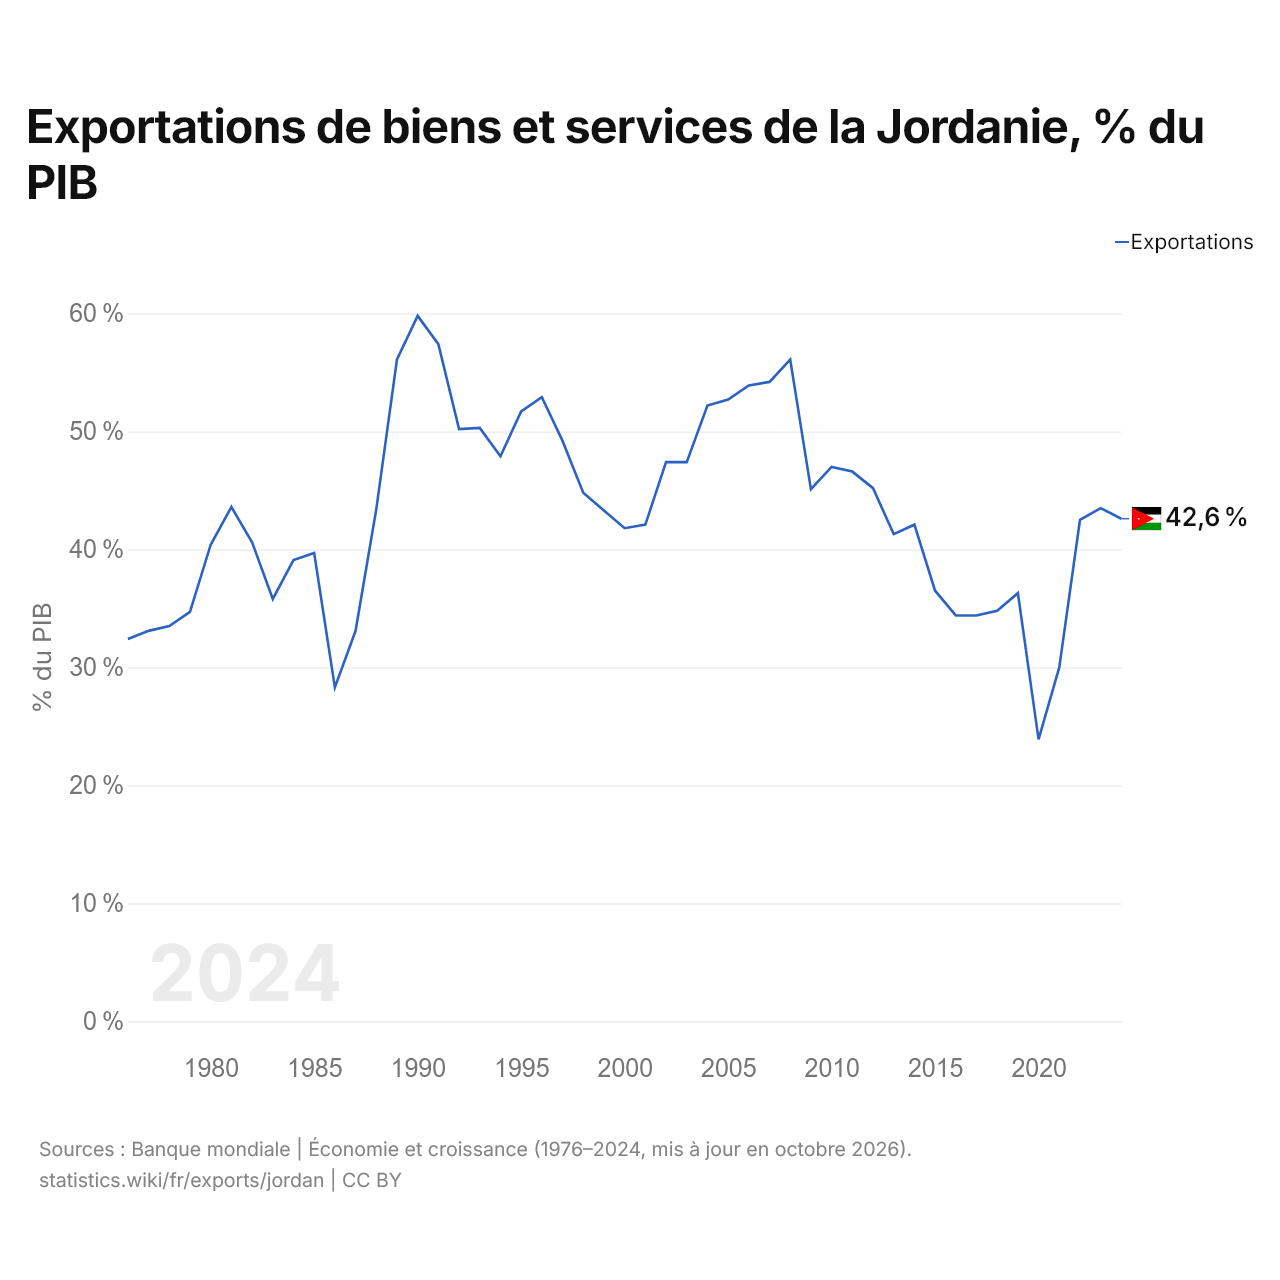
Les exportations de biens et services de la Jordanie équivalent à 42,6 % de son PIB (2024), contre 32,4 % en 1976. La part la plus élevée a été de 59,8 %, en 1990.
Comparer les exportations de la Jordanie avec celles d'autres pays
Sources :
- TradeMap (2001–2025, mis à jour en octobre 2026)
- Banque mondiale | Économie et croissance (1972–2025, mis à jour en octobre 2026)
Creative Commons Attribution (CC BY) : vous pouvez copier, partager, adapter et réutiliser ce contenu, y compris à des fins commerciales, à condition de citer statistics.wiki et d’indiquer les modifications apportées. Les sources citées ci-dessus peuvent avoir leurs propres conditions de licence.